In January, the owner of Sundial Florist, an example business we'll follow through this guide, opened her profit and loss statement and saw a loss of $3,755. A month later the same report showed a profit of $8,010. Neither number told her much on its own. Put all twelve months side by side, though, and the report showed her where the shop makes its money, where it leaks, and why the busiest month of her year had the thinnest margin on flowers.
This guide reads a profit and loss statement the way you'd read your own: line by line for the year, then month by month. It covers what each line means, five numbers to work out from it, how to get one out of QuickBooks, Xero or a spreadsheet, and the mistakes that quietly make small-business P&Ls wrong.
What a profit and loss statement tells you, and what it doesn't
A profit and loss statement (P&L, also called an income statement) lists what the business earned over a period and what it cost to earn it, then subtracts one from the other. The period can be a month, a quarter or a year. The SEC's beginners' guide to financial statements describes it as a report of the revenue a company earned over a specific time period and the costs and expenses charged against it, ending in net earnings or a loss.
Every P&L, however long, follows the same three subtractions:
Revenue − cost of goods sold = gross profitGross profit − operating expenses = operating profitOperating profit + other income − interest = net profit (before income tax)
Two things it is not. It isn't a snapshot: it covers a stretch of time, while the balance sheet shows what you own and owe on one date (our guide to the balance sheet vs income statement shows how the two fit together). And it isn't your bank balance. A month can show a healthy profit and still leave less money in the account, because loan repayments, stock purchases and what the owner takes out don't appear on it. More on that below.
Reading Sundial Florist's year, line by line
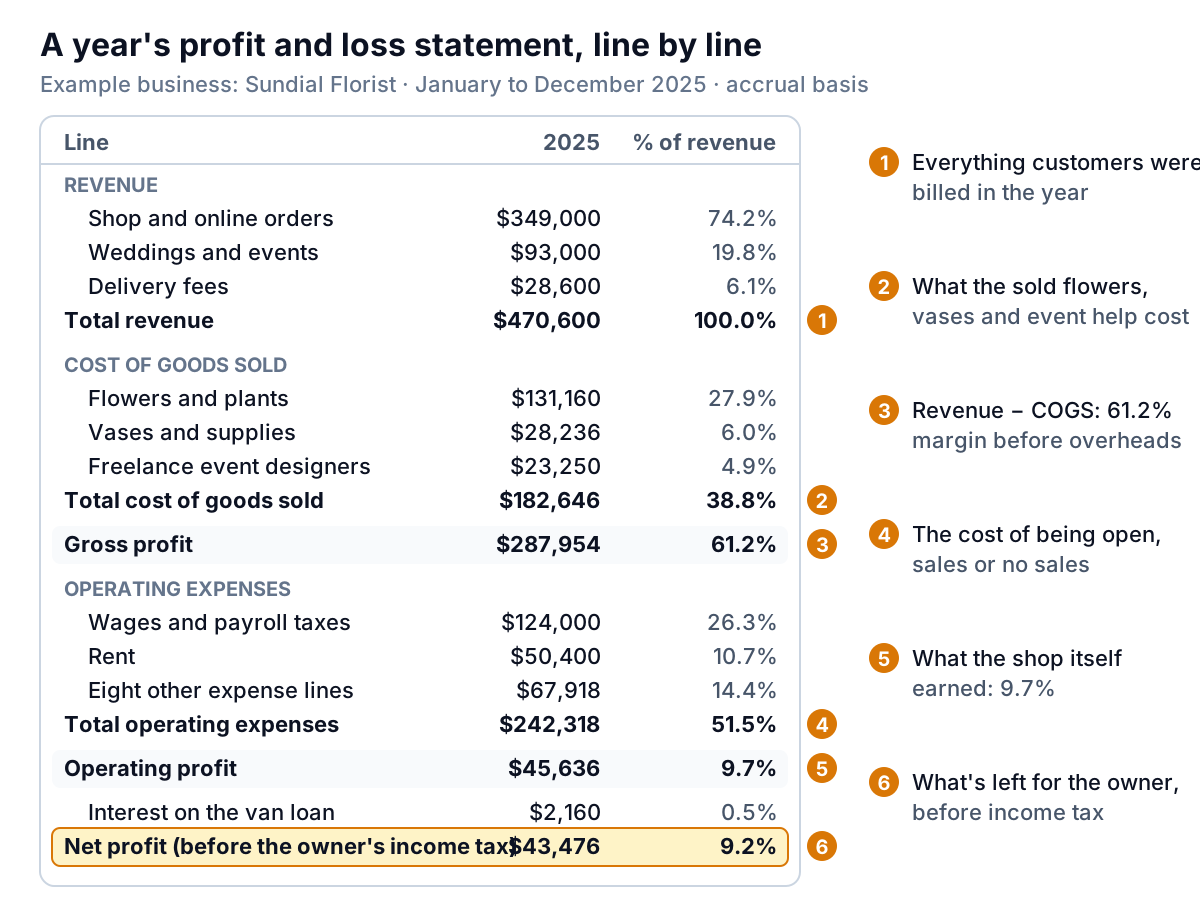
Here is the example shop's full year, 2025, on the accrual basis. The numbered circles match the sections that follow.
1. Revenue: $470,600
Everything customers were billed for in the year, split into three streams: shop and online orders, weddings and events, and delivery fees. Split revenue by stream if the streams behave differently. Events are 19.8% of Sundial's revenue, but they arrive in lumps (June and September) and carry an extra cost, freelance designers, that walk-in sales don't.
The accounting method decides which month a sale lands in. On the accrual basis, revenue is generally recorded when you earn it, so a wedding paid for in March but delivered in September is September revenue. On the cash basis, it's recorded when the money arrives. The IRS explains both methods, and who may use which, in Publication 538. Ask your accountant which one your books use, and don't switch between them mid-year.
Sales tax you collect is not revenue. It belongs to the state and sits on the balance sheet until you pay it over.
2. Cost of goods sold: $182,646
The costs that come with each sale: flowers and plants, vases and supplies, and the freelance designers hired for events. If Sundial sold nothing, these would be close to zero. That's the test for what goes here. Rent, the delivery van and salaried staff stay in operating expenses, because they're paid whether or not a bouquet leaves the shop.
3. Gross profit: $287,954, or 61.2%
Revenue minus cost of goods sold. Of every dollar a customer paid, 61 cents was left to pay for the shop itself. Gross margin is the line to watch month by month, because it moves when supplier prices, discounts or the product mix change, often before anything else on the statement does.
4. Operating expenses: $242,318
The cost of being open. Wages and payroll taxes are the biggest line at $124,000 (26.3% of revenue), then rent at $50,400 (10.7%). Eight smaller lines make up the rest: utilities for the cooler, van running costs, marketing, card and order-platform fees, insurance, software, depreciation and other costs.
Depreciation ($7,200) deserves a word. It isn't a payment. It spreads the cost of equipment such as the van and the walk-in cooler over the years you use it, so the year you buy a cooler doesn't look like a disaster and the next four don't look better than they are.
5. Operating profit: $45,636, or 9.7%
What the business earns from doing what it does, before interest and tax. It's the cleanest number for comparing one year with another, because it isn't moved by how the business is financed.
6. Interest and net profit: $43,476, or 9.2%
Take off $2,160 of interest on the van loan and you reach net profit before income tax. Sundial is run by its owner as a sole proprietorship, so there's no owner's salary on the statement. The $43,476 is what she earned for a year's work, before her own income tax. A sole proprietor reports business profit to the IRS on Schedule C, though the tax figure can differ from the books (depreciation rules are one reason), so leave that translation to your accountant. If you run a corporation and pay yourself a salary, your pay sits in wages and the bottom line is what's left for the business.
Monthly vs annual: same statement, different questions
The annual profit and loss statement tells you whether the business works. The monthly one tells you when it works, and whether something is going wrong now, while you can still act.
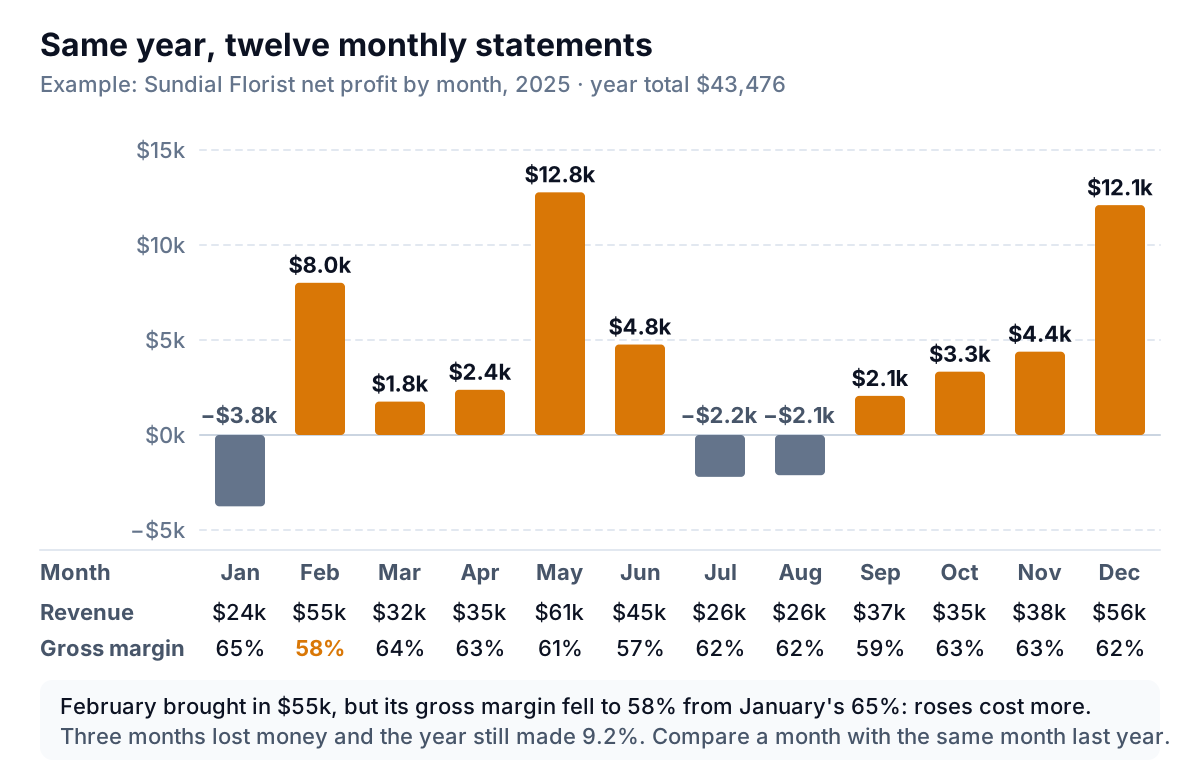
Sundial lost money in January, July and August. That's not a crisis; it's a florist's year. The Society of American Florists calls Valentine's Day the number one holiday for florists, and Sundial's other peaks are May and December. What the monthly view adds is February's gross margin: 58.3%, against 64.6% in January. Roses cost more that week. Had February kept January's margin, gross profit would have been about $3,440 higher. That's a pricing question for next Valentine's Day, and the annual statement would never have raised it.
Four rules for reading monthly statements:
- Compare a month with the same month last year, not with the month before. February against January tells you about Valentine's Day, not about your business.
- Watch percentages, not just dollars. Rent is 10.7% of Sundial's revenue for the year, but 17.9% of January's and 7.6% of February's. Fixed costs look worse in slow months; that's arithmetic, not a problem.
- Use year to date or the last 12 months for the trend. A rolling 12-month total smooths out seasons, so a drop in it means something real has changed.
- Book lumpy bills the same way every year. An annual insurance premium in one month, or spread across twelve, both work. Switching between them makes months impossible to compare.
| Your question | The view that answers it |
|---|---|
| Is the business profitable? | The full year, or the last 12 months |
| Was this month normal? | This month against the same month last year |
| Are costs creeping up? | Each line as a % of revenue, month by month |
| Can I afford a new hire? | The last 12 months, then a cash forecast |
If you want to lay out your own year this way, our profit and loss statement template has twelve monthly columns, a year total and every line as a percentage of revenue, with a filled-in example.
Five numbers to work out from any P&L
- Gross margin: gross profit ÷ revenue. Sundial: $287,954 ÷ $470,600 = 61.2%.
- Operating expenses as a % of revenue: $242,318 ÷ $470,600 = 51.5%. If this rises year on year while gross margin holds, overheads are growing faster than sales.
- Operating margin: operating profit ÷ revenue = 9.7%.
- Net margin: net profit ÷ revenue = 9.2%.
- Break-even revenue: (operating expenses + interest) ÷ gross margin. Sundial: $244,478 ÷ 61.2% ≈ $399,500 a year, or about $33,300 a month. Its three loss months all brought in less than $27,000.
Should 9.2% be higher? Be careful with published "average margins" for your industry. They mix businesses of very different sizes, and most don't say whether the owner's pay is in the numbers. Your own figures from last year, and the same months the year before, are the better yardstick. An accountant who works with similar businesses can tell you whether yours look unusual.
Getting a profit and loss statement from QuickBooks, Xero or a spreadsheet
QuickBooks Online. Go to Reports, then Standard reports, and open Profit and Loss, as Intuit describes in its guide to running reports. Intuit's guide to customizing reports shows setting Display columns by to Month for a monthly view. For this year against last, the Profit and Loss Comparison report lets you pick Previous year, choose Accrual or Cash, and show $ change or % change. Export/Print, then Export to Excel, gives you a file to work with. Intuit notes that reporting is limited on its Free and Lite plans.
Xero. Xero's US help calls it the Income Statement (Profit and Loss) report. Xero describes it as showing income, expenses and profit for the report period you select.
A spreadsheet. If you keep books in a spreadsheet, sum each category by month from your bank and card transactions. That gives you a cash-basis P&L, which is fine for many small businesses, as long as you leave out the items in the next section.
Mistakes that make a P&L wrong
Most errors on small-business P&Ls come from money that moved but wasn't an expense, or income that wasn't really revenue.
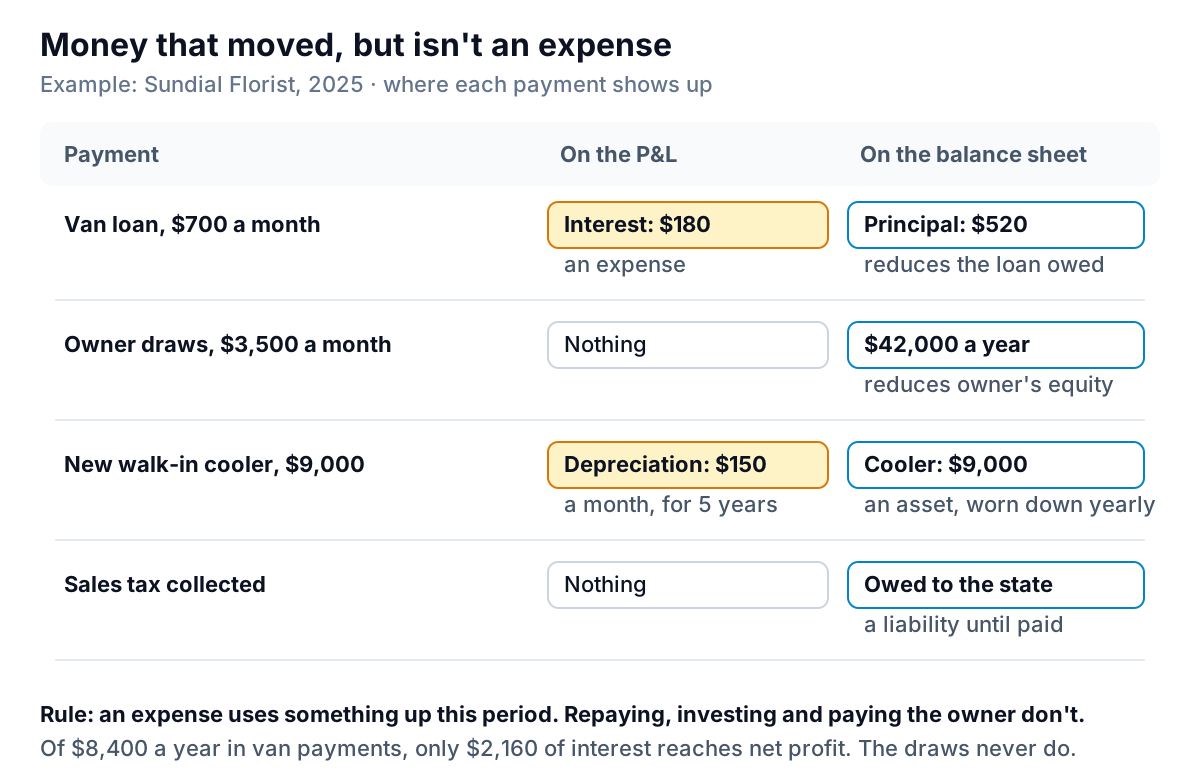
- Booking the whole loan payment as an expense. Only the interest is. Sundial pays $8,400 a year on its van loan, and only $2,160 of it belongs on the P&L.
- Treating owner draws as wages. In a sole proprietorship or partnership, what the owner takes out isn't an expense. Sundial's owner drew $42,000; counting it would have turned a $43,476 profit into $1,476.
- Expensing equipment in one go. In your books, a $9,000 cooler is an asset that's depreciated. Tax rules sometimes allow a faster write-off, which is a decision for your accountant, not a reason to distort the monthly picture.
- Counting sales tax as sales. It inflates revenue and then shows up as a mystery expense when you pay the state.
- Timing stock on the cash basis. Roses bought in late January for Valentine's Day make January look worse and February better than they were. If that distorts your view, ask your bookkeeper about recording stock when it's used.
- A big "uncategorized" or "ask my accountant" line. Anything over a few hundred dollars hides a decision. Clear it before you read the month.
- Unreconciled accounts. If the bank balance in your books doesn't match the statement, some income or expense is missing or doubled. Reconcile first, then read.
What to do when the bottom line moves
When net profit is well above or below the same month last year, walk down the statement in order and stop at the first line that explains most of the change:
- Revenue. Which stream moved? One big event, or fewer everyday orders?
- Gross margin. Did costs rise faster than prices, or did the mix shift toward lower-margin work? Multiply the change in margin by revenue to get its dollar effect, as with Sundial's $3,440 in February.
- Expense lines as a % of revenue. Look for a line that jumped, then check whether it's a one-off (a repair, an annual bill) or a new run rate (a rent rise, a new hire).
- Below the line. Interest, one-off income or a correction from your bookkeeper.
Write the answer down in one sentence: "Profit fell $2,000 because event revenue was $6,000 lower and margin on flowers slipped two points." If you set a budget, the same walk works line by line against plan; our guide to budget vs actual reports covers how to decide which gaps deserve your time. And because profit isn't cash, a quiet bank balance in a profitable month is a question for a cash flow forecast, not for the P&L.
Reading a year of monthly statements by hand means exporting, lining up columns and working out percentages before you can ask a single question. Parity does that part. Connect QuickBooks Online, or upload a Profit and Loss export as a CSV or Excel file (Parity doesn't read PDFs, so export to Excel rather than printing to PDF). Parity builds a dashboard with the headline numbers and their trends, charts, what explains them and a table of what needs attention, and every number is checked against queries on the full dataset before you see it. Ask it to "show gross margin by month against last year" or "list the expense lines that grew faster than revenue". When you want the monthly summary for a business partner or your lender, ask it to write the report from the same data.
Connect QuickBooks Online or upload a Profit and Loss export, and get a checked dashboard of your margins and costs by month. Build a report from your data free
Whatever tool you use, the habit is the same: read the year to see whether the business works, read each month against last year's to see what changed, and put a reason next to every big move. For the other half of the picture, what the business owns and owes, the balance sheet template takes you through it with checks that tell you when the numbers don't add up.