Lantern Yoga Studio, an example business we made up for this guide, lost $300 in August 2025. On its own, that looks like a summer problem: fewer students, so cut classes. Laid out next to the other eleven months, with every line as a share of revenue, it reads differently. Rent never changed. Revenue dipped for eight weeks, so fixed costs took a bigger bite, and September's teacher training more than made it back.
That side-by-side view is what this profit and loss statement template gives you: twelve monthly columns, a year total, each line as a percentage of revenue, a monthly average and a running year-to-date profit, with checks that tell you when a number has gone astray. The studio's year is filled in as an example, and an empty copy with the same formulas is ready for yours.
Download the profit and loss statement template (.xlsx). It opens in Excel, in Google Sheets and in Numbers, and has no macros.
What's in the profit and loss statement template
Three tabs: a short How to use, the filled-in Example P&L, and Your P&L, which has every formula and no figures. Amber cells are inputs. White and grey cells are formulas, so don't type over them. Rename any line in column A to match your own accounts.
The grid runs from row 8 down, with the months in columns B to M, the year in N, each line as a % of revenue in O, and the monthly average in P. Top to bottom:
| Rows | Block | What goes in |
|---|---|---|
| 4–6 | Header | Business name, year, and accounting method (cash or accrual) |
| 10–15 | Revenue | Up to five revenue streams, then a total |
| 17–23 | Cost of sales and gross profit | Up to four direct costs, a total, gross profit and gross margin |
| 25–41 | Operating expenses and operating profit | Up to fourteen expense lines, a total, operating profit and margin |
| 43–47 | Below the line | Other income, interest, net profit before tax, net margin, year to date |
| 50–53 | Checks | Months entered, two sum checks, and the number of loss months |
| 57–62 | % of revenue by month | Six key lines as a share of each month's revenue |
Filling it in from your books
You need one number per line per month. The quickest source is your accounting system's own Profit and Loss report, run month by month.
- Run the monthly report. In QuickBooks Online, go to Reports, then Standard reports, and open Profit and Loss, as Intuit's guide to running reports describes. Set the period to the full year and Display columns by to Month, as Intuit's guide to customizing reports shows, then use Export/Print and Export to Excel. In Xero, the equivalent is the Income Statement (Profit and Loss) report.
- Map your accounts to the template's lines. Your chart of accounts probably has more lines than the template. Group them, and keep the grouping the same every month. A yoga studio's mapping might look like the table below.
- Paste or type the figures into the amber cells, one column per month. Leave future months empty; the averages and checks only count months with revenue.
- Read the checks in rows 50 to 53 before you read anything else.
| Accounts in your books | Template line |
|---|---|
| Monthly unlimited, annual memberships, student memberships | Memberships (row 10) |
| Ten-class packs, drop-ins, intro offers | Class packs and drop-ins (row 11) |
| Per-class teacher pay, substitute pay | Instructor pay (row 17) |
| Front desk wages, studio manager salary | Staff wages (row 26) |
| Employer payroll taxes, workers' comp, benefits | Payroll taxes and benefits (row 27) |
| Stripe or card fees, booking platform fees | Card and booking fees (row 31) |
What goes in cost of sales and what goes in operating expenses is a judgment, and the test is simple: would the cost fall if you taught fewer classes or sold less? Lantern pays its teachers per class, so their pay is a cost of sales. Rent and the front desk are paid whether ten students come or a hundred, so they're operating expenses. If your teachers are on salary, you may reasonably put them in operating expenses instead. Choose once and stay consistent.
Also pick one accounting method and note it in B6. On the cash basis, a membership paid in December for January counts in December; on the accrual basis it counts in January. The IRS explains both in Publication 538, and your accountant can tell you which one your books use.
Every formula, explained
Each month's column works the same way, from top to bottom. Here's September, the example's best month, with the formulas from column J:
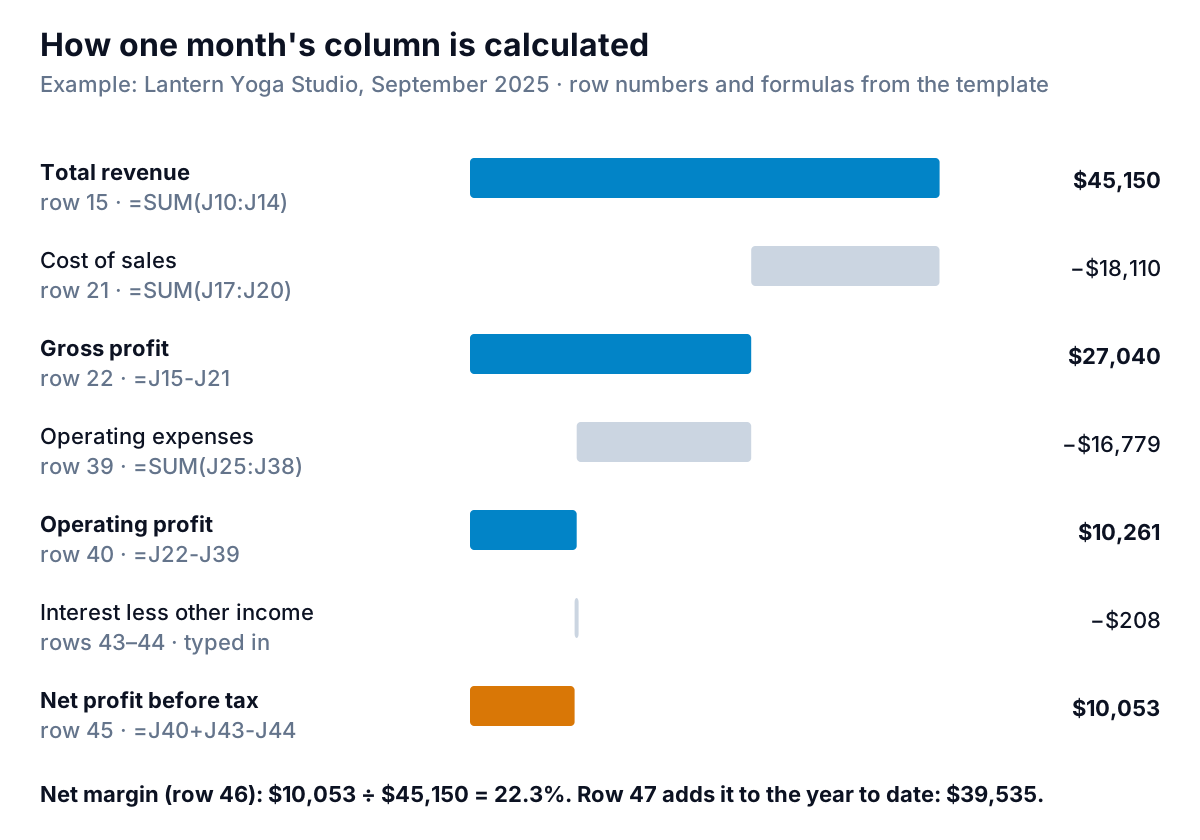
- Totals (rows 15, 21 and 39) are plain sums of the block above:
=SUM(J10:J14)for revenue. - Gross profit (row 22):
=J15-J21. Gross margin (row 23):=IF(J15=0,0,J22/J15). The IF keeps an empty month at zero instead of showing a divide-by-zero error. - Operating profit (row 40):
=J22-J39, and its margin in row 41. - Net profit before tax (row 45):
=J40+J43-J44, operating profit plus other income minus interest. Net margin is row 46. - Year to date (row 47): January equals its own net profit; every later month adds its net profit to the month before,
=I47+J45. Lantern was $29,482 ahead by the end of August and $56,703 by December. - Year (column N):
=SUM(B10:M10)on every row. - % of revenue (column O): the year total divided by the year's revenue,
=IF($N$15=0,0,N25/$N$15). Rent is 16.0% of Lantern's year. - Monthly average (column P): the year total divided by the months entered (B50), not by twelve. That way it stays right part-way through a year: after six months, it divides by six.
The checks
Row 50 counts the months with revenue. Row 51 compares the year's net profit with the twelve months added up; row 52 takes the year's revenue, subtracts every cost line individually and compares the result with net profit. Both should be $0 and say "OK ✓". If one doesn't, a row has been added outside a total or a formula has been typed over. Row 53 counts loss months; Lantern has one.
Key lines as a % of revenue, by month
Rows 57 to 62 repeat six lines as a share of each month's revenue: cost of sales, gross profit, staff wages with payroll taxes, rent, total operating expenses and net profit. This is the part of the template that answers "is this month normal?" without a calculator.
What the example year says
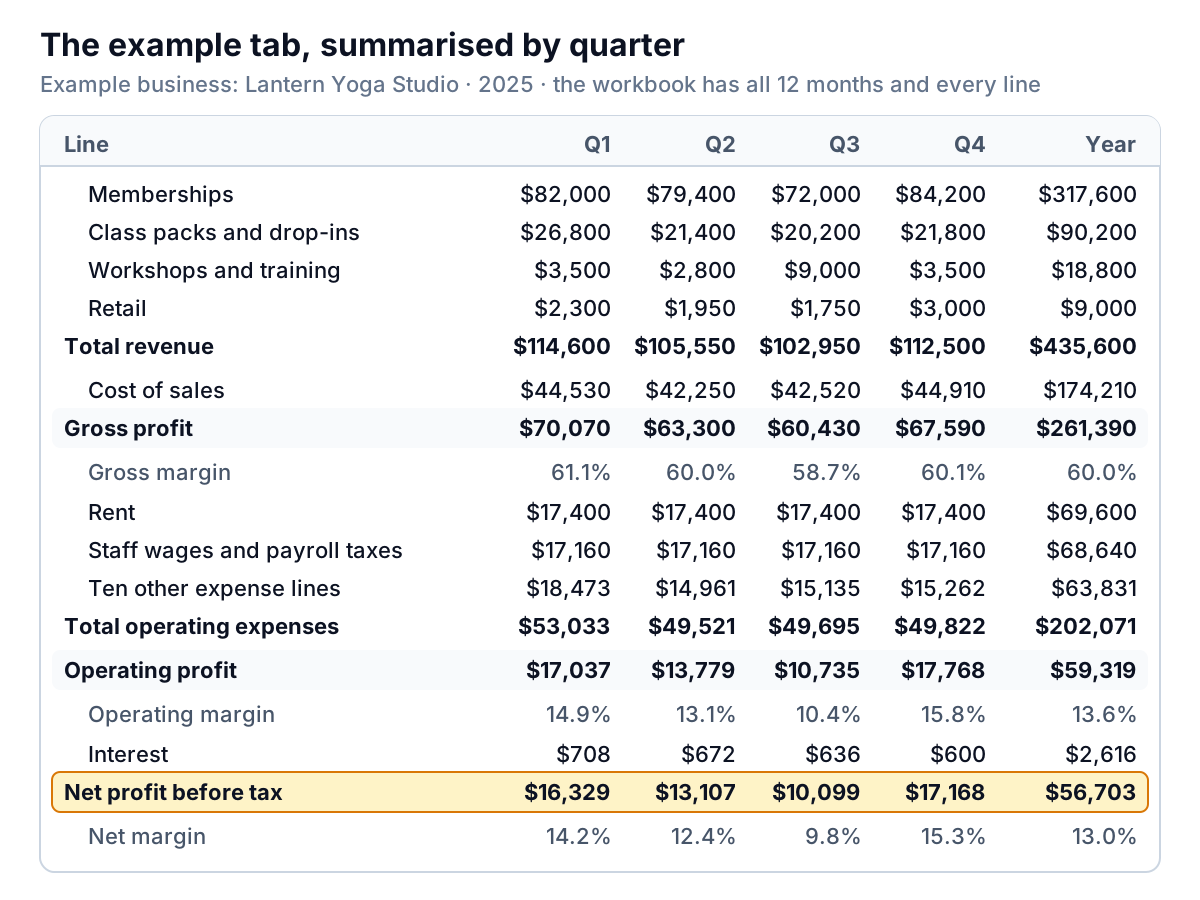
Lantern took in $435,600 in 2025, 72.9% of it from memberships. Gross profit was $261,390, a 60.0% margin, because per-class instructor pay is the studio's biggest cost at $161,700, or 37.1% of revenue. Operating expenses came to $202,071 (46.4%), led by rent at $69,600 and front-desk and manager wages of $62,400. After $2,616 of interest on the fit-out loan, net profit before tax was $56,703, a 13.0% margin. The owner isn't on the payroll in this example, so that figure is her pay as well as the business's profit, before income tax.
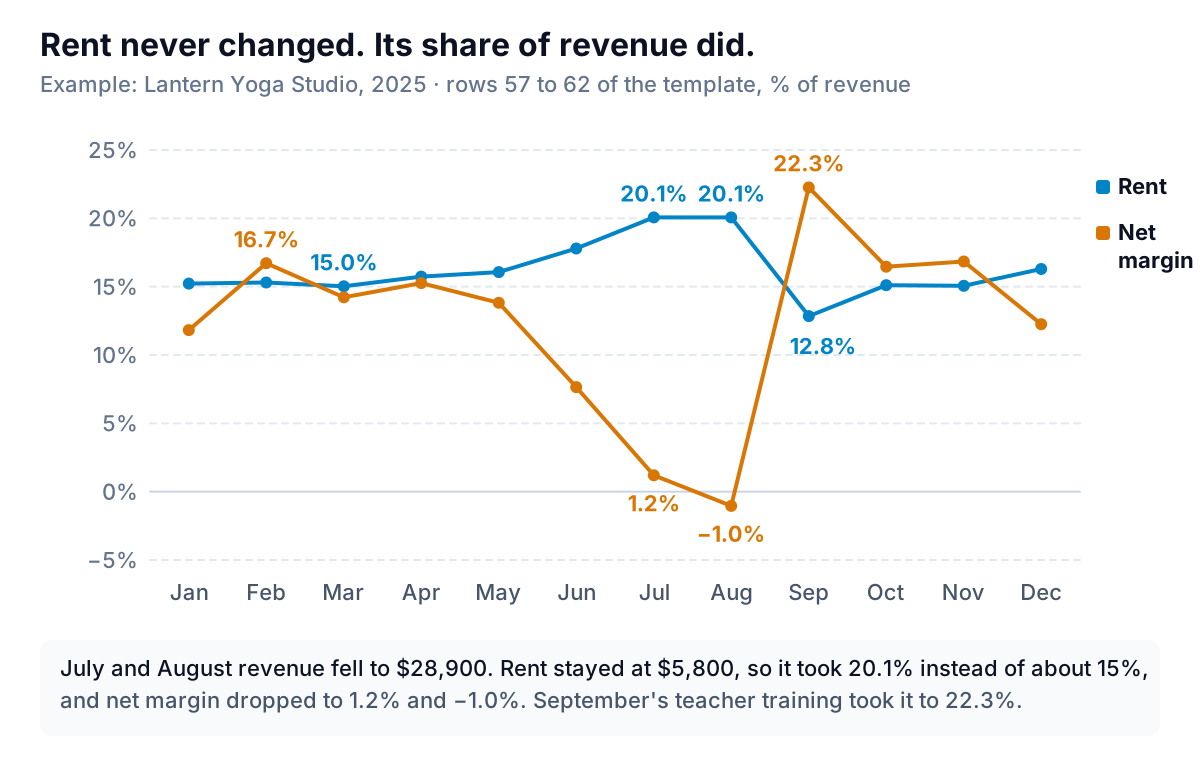
The monthly view shows three things the year total hides:
- Summer is a fixed-cost problem, not a teaching problem. Revenue fell from about $38,000 a month in spring to $28,900 in July and August. Instructor pay fell with it, because teachers are paid per class, so gross margin held at 57–58%. Rent and wages didn't move, and net margin dropped to 1.2% and −1.0%. Cutting classes would barely help. A summer offer to keep members from pausing, or a cheaper summer timetable for front-desk staff, would.
- One event can make a month. September's teacher training brought in $9,000 and lifted net margin to 22.3%. It's a once-a-year event, so don't read September as the new normal; the monthly average in column P ($4,725 of net profit) is a better guide for planning.
- The year's cushion is uneven. Year-to-date profit was $29,436 at the end of June and $29,482 at the end of August: two months of standing still. If you plan any spending around summer, look at row 47 first.
When you have two years in the template, copy the tab, put last year beside this year, and compare the same months. Our guide to budget vs actual reports explains how to decide which differences are worth chasing.
What this template can't do
- It reports profit, not cash. A month can show a profit and still leave less in the bank, after loan principal, owner draws or equipment purchases. For the timing of money in and out, use a cash flow forecast template.
- It doesn't show what the business owns or owes. That's the balance sheet's job; our balance sheet template pairs with this one, and the net profit here is the figure that feeds its equity section. Our guide to the balance sheet vs income statement shows how the two connect.
- It doesn't calculate income tax. Net profit is before tax. What you owe depends on how the business is set up and on your own situation, so ask your accountant what to set aside.
- It holds one year. For a second, copy the tab.
- It's only as good as your books. Reconcile your bank and card accounts before copying a month in. A missing deposit or a duplicated bill flows straight through to net profit, and the checks can't catch figures that are wrong at the source.
Where Parity helps
The slow part of keeping this template up to date is the monthly copy and paste, and keeping the account grouping the same every time. Parity can do that part. Connect QuickBooks Online, or upload a Profit and Loss export as a CSV or Excel file (Parity doesn't read PDFs), and it builds a dashboard with the headline numbers and their trends, charts, what explains them and a table of what needs attention. Every number is checked against queries on the full dataset before you see it. Ask for "each expense line as a percentage of revenue by month" or "net margin by month against last year", refine it by chat, and export the tables to Excel if you still want them in the template. Next month, update it with the newer file.
Connect your books or upload a Profit and Loss export, and see every line as a share of revenue, month by month, checked against your data. Build a report from your data free
Or start with the spreadsheet. Download the profit and loss statement template (.xlsx), look at how the example's August and September differ in rows 57 to 62, then fill in your own last twelve months and see which month surprises you.