Every January, the owner of Thornbury Bookshop, an example business we'll use throughout this guide, asks two questions. Did we make money last year? And if we did, why is there less in the bank than there was twelve months ago? In 2025 the answers were "yes, $22,800" and "because $8,500 more went out than came in". Both are true, and they come from two different reports.
That's the whole difference between the balance sheet vs income statement, in one shop. The income statement answers the first question. The balance sheet, read at the start and end of the year, answers the second. This guide shows the same bookshop both ways, where the two statements connect, and which one to open for which decision.
Balance sheet vs income statement: the short answer
An income statement (also called a profit and loss statement, or P&L) shows what the business earned and spent over a period, ending in net income. A balance sheet shows what the business owns, what it owes and what's left for the owners on one date. The SEC's beginners' guide to financial statements describes the income statement as covering a specific time period, and the balance sheet as resting on one equation: assets = liabilities + shareholders' equity.
| Income statement | Balance sheet | |
|---|---|---|
| Question it answers | Did we make a profit? | What do we own and owe right now? |
| Time | A period: a month, quarter or year | A single date, such as 31 December |
| Sections | Revenue, cost of goods sold, expenses | Assets, liabilities, equity |
| Bottom line | Net income (or loss) | Assets = liabilities + equity, always |
| Starts each period at | Zero | Last period's closing balances |
| Ratios it feeds | Gross, operating and net margin | Working capital, current ratio, debt to equity |
The row people miss is the fifth one. An income statement resets: January's revenue starts from nothing. A balance sheet never resets. It carries every past year forward, which is why it can tell you what last year's profit turned into.
One bookshop, shown both ways
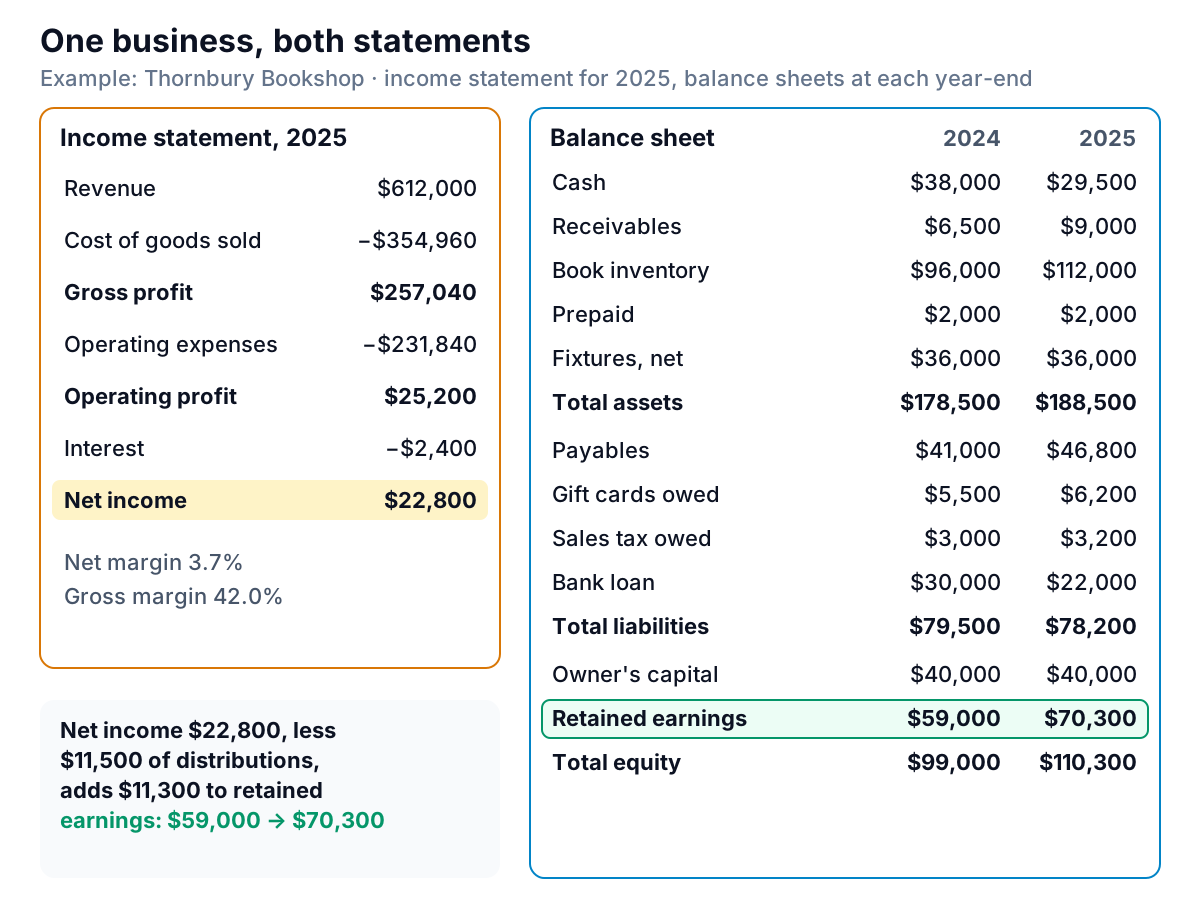
Here are Thornbury's 2025 income statement and its balance sheets at the end of 2024 and 2025. The shop is an S corporation in this example: the owner is paid a salary through payroll (inside operating expenses) and also took $11,500 in distributions during the year.
What the income statement says
The shop sold $612,000 of books, cards, gifts and event tickets. The books it sold cost $354,960, leaving gross profit of $257,040, a 42.0% gross margin. Wages, rent, card fees and the rest came to $231,840, so operating profit was $25,200. After $2,400 of interest on its bank loan, net income was $22,800, a 3.7% net margin. For a deeper read of each line, see our guide to the profit and loss statement.
What it doesn't say: how much stock is on the shelves, how much the shop owes publishers, or how much cash is left.
What the balance sheets say
At the end of 2025, Thornbury owned $188,500: $29,500 in cash, $9,000 owed by schools and libraries, $112,000 of books on the shelves at cost, $2,000 prepaid and $36,000 of shelving and fixtures after depreciation. It owed $78,200: $46,800 to publishers and distributors, $6,200 in unredeemed gift cards, $3,200 of sales tax and $22,000 on the bank loan. The rest, $110,300, is equity: $40,000 the owner put in and $70,300 of profit kept in the business over the years.
Compare the two dates and the year's story appears. Inventory is up $16,000. Cash is down $8,500. The loan is $8,000 smaller. None of that is visible on the income statement.
How the two statements connect
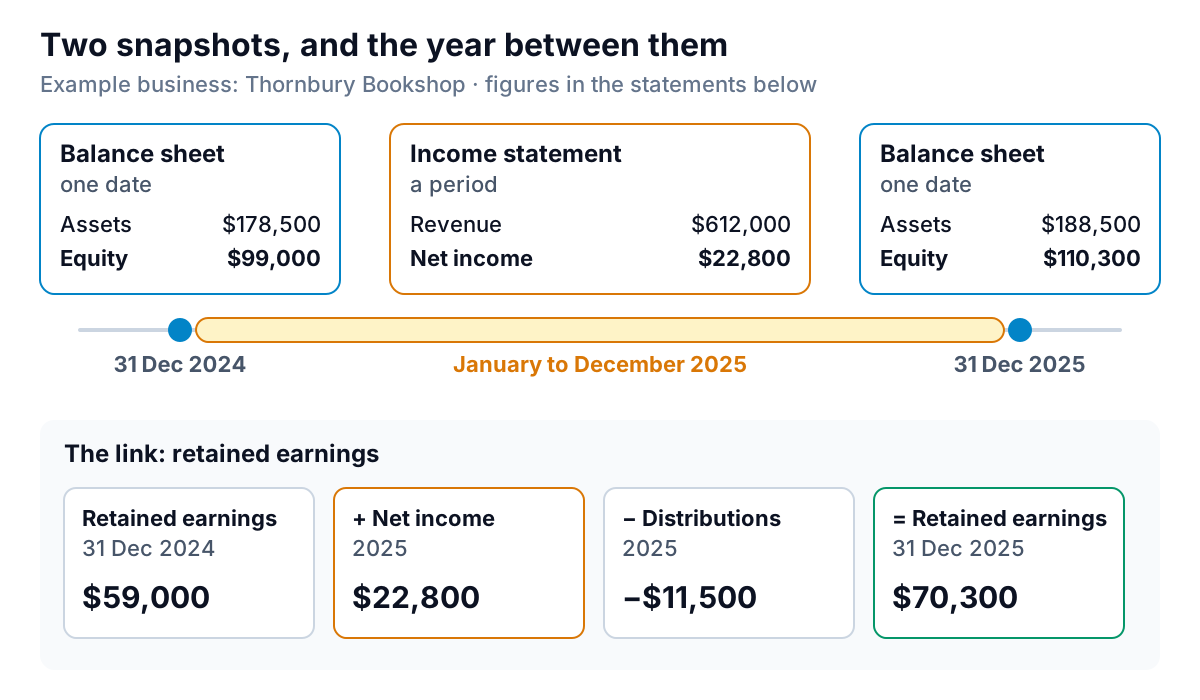
The main link is retained earnings. Each year's net income flows from the income statement into equity on the balance sheet, less whatever the owners take out:
Retained earnings at the start + net income − distributions = retained earnings at the end
For Thornbury: $59,000 + $22,800 − $11,500 = $70,300. That's why the balance sheet still balances after a year of trading. The profit the income statement reports has to land somewhere, and it lands in equity. In QuickBooks Online, Intuit explains that the Retained Earnings account is a rollover of all previous fiscal years' net profit or loss, moved there automatically at the start of a new year. During the year, Intuit notes, the equity total on the Balance Sheet report includes net income for the fiscal year to date.
Four more links run between the statements, and each one explains a common surprise:
- Depreciation. Thornbury bought $6,000 of shelving in 2025. The balance sheet records it as an asset. Only the year's depreciation, $6,000 on all its fixtures, reaches the income statement, and it comes off the asset's value on the balance sheet at the same time.
- Inventory and cost of goods sold. Books the shop buys go onto the balance sheet as inventory. Only the books it sells move to the income statement as cost of goods sold. Thornbury bought $16,000 more books than it sold, so its inventory rose and its profit didn't fall.
- Loans. Interest is an expense on the income statement ($2,400). Repaying principal ($8,000) only shrinks the loan on the balance sheet.
- Revenue not yet collected. On the accrual basis, a school's invoice counts as revenue when it's issued and sits in receivables until it's paid. The IRS explains the cash and accrual methods in Publication 538. On the cash basis this link mostly disappears.
Why profit and cash disagree
Put the two balance sheets next to each other and you can walk from the income statement's profit to the change in cash, one line at a time:
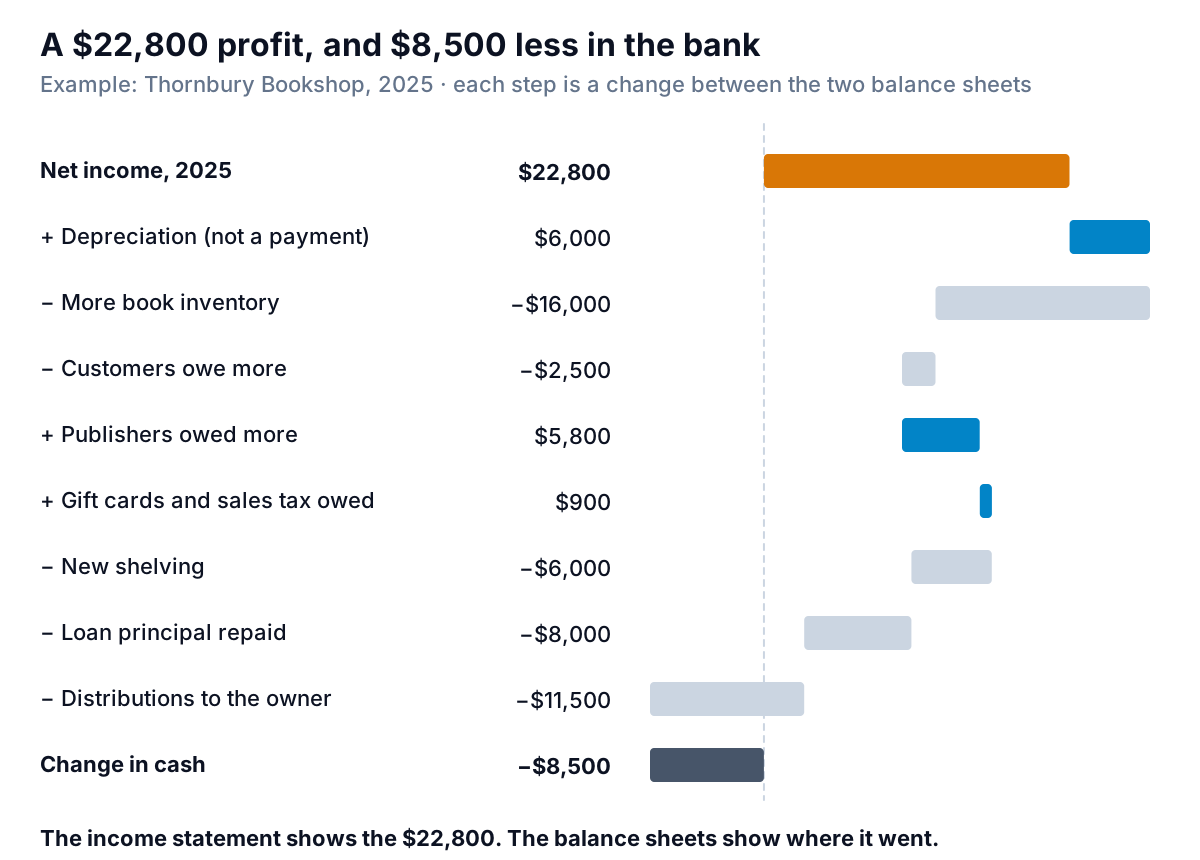
- Start with net income: $22,800.
- Add back depreciation: +$6,000. It was an expense, but no money left the shop for it this year.
- Working capital: more books on the shelves (−$16,000) and more owed by customers (−$2,500) used cash; owing publishers more (+$5,800) and holding more gift card and sales tax money (+$900) kept cash in.
- Investment: the new shelving (−$6,000).
- Financing and the owner: loan principal (−$8,000) and distributions (−$11,500).
Total: −$8,500, exactly the fall in the cash line from $38,000 to $29,500. That's a simplified cash flow statement, the third financial statement, built from the other two. The decision it points to is clear: the shop's profit is fine, but $16,000 went into stock. If that was a deliberate bet on a strong autumn list, good. If it's slow-moving titles, it's cash sitting on a shelf.
This walk is also why a profitable business can run short of money, and why a cash flow forecast is worth having alongside both statements.
Which statement to read for which decision
In practice, balance sheet vs income statement is less a choice than a question of which one to open first. For most decisions you'll end up with both.
| Decision | Start with | Why |
|---|---|---|
| Should we raise prices or change suppliers? | Income statement | Gross margin shows what each sale leaves after its cost |
| Can we afford another hire? | Income statement, then cash | Operating profit must cover the salary; cash must cover the months before it pays off |
| Can we pay publishers on time this quarter? | Balance sheet | Cash and receivables against payables due |
| Are we carrying too much stock? | Both | Inventory on the balance sheet against cost of goods sold on the income statement |
| Should we take on a loan? | Both | The income statement shows whether profit covers the interest; the balance sheet shows what you already owe |
| How much can the owner take out? | Both | Net income is the ceiling over time; cash on the balance sheet is the limit today |
A good rhythm for a small business: read the income statement every month, against the same month last year. Read the balance sheet at least every quarter, next to the one from the quarter before, and look at what moved. The SBA calls the balance sheet a snapshot of your business financials, and a snapshot is most useful next to an earlier one.
Getting both statements from your books
In QuickBooks Online, both live under Reports, then Standard reports: Profit and Loss for the income statement and Balance Sheet for the balance sheet, with a Balance Sheet Comparison report for two dates, as Intuit's Balance Sheet help page describes. Our guide to the QuickBooks balance sheet covers that report in detail. In Xero, the Balance Sheet report shows your financial position at a selected date, and the US version of the profit and loss is called the Income Statement (Profit and Loss) report.
A quick test that the two agree: run the profit and loss from the start of your fiscal year to today, and check that its net income matches the net income line in the equity section of today's balance sheet. If they differ, the usual reasons are different dates or different accounting methods (cash on one, accrual on the other).
If you keep your books in a spreadsheet, our profit and loss statement template and balance sheet template are built to pair up: the P&L's net income is the figure that goes into the balance sheet's equity section, and the balance sheet has a check cell and a retained earnings carry-forward check to tell you when something doesn't tie.
Reading both statements together is where most of the effort goes: lining up dates, working out the changes, and walking profit to cash. Parity can take that on. Connect QuickBooks Online, or upload Profit and Loss and Balance Sheet exports as CSV or Excel files (Parity doesn't read PDFs), and it builds a dashboard with the headline numbers and their trends, charts, what explains them and a table of what needs attention. Every number is checked against queries on the full dataset before you see it. Ask "why did cash fall when we made a profit?" or "show inventory against cost of goods sold by quarter", and when your accountant or a partner needs the year summarised, ask Parity to write the report from the same data.
Connect QuickBooks Online or upload your statements, and get a checked dashboard that shows what you earned and where it went. Build a report from your data free
The short version of balance sheet vs income statement to keep: the income statement tells you whether the year worked; the balance sheet tells you what the year left behind. Thornbury's owner needed both to see that a good year had quietly turned $16,000 of cash into books. Ask your accountant to walk you through your own pair once, and you'll read them differently from then on.