The owner of Eastbrook Auto Repair, an example business we made up for this guide, needed two balance sheets for an equipment loan: one at the last year-end and one at the end of September. She copied the numbers out of her accounting software into a spreadsheet, and the totals were $173,000 apart. Nothing was missing. She had typed accumulated depreciation as a negative number in a row that already subtracted it.
A balance sheet template should catch that before a lender does. This one puts two dates side by side, works out every subtotal, and has a check cell that must read $0 in both columns. If it doesn't, the size of the difference tells you where to look. It also checks that retained earnings carry forward correctly from one year to the next, and works out four common ratios.
Download the balance sheet template (.xlsx). It opens in Excel, in Google Sheets and in Numbers, and has no macros. The repair shop is filled in as an example, and an empty copy has the same formulas.
What's in the balance sheet template
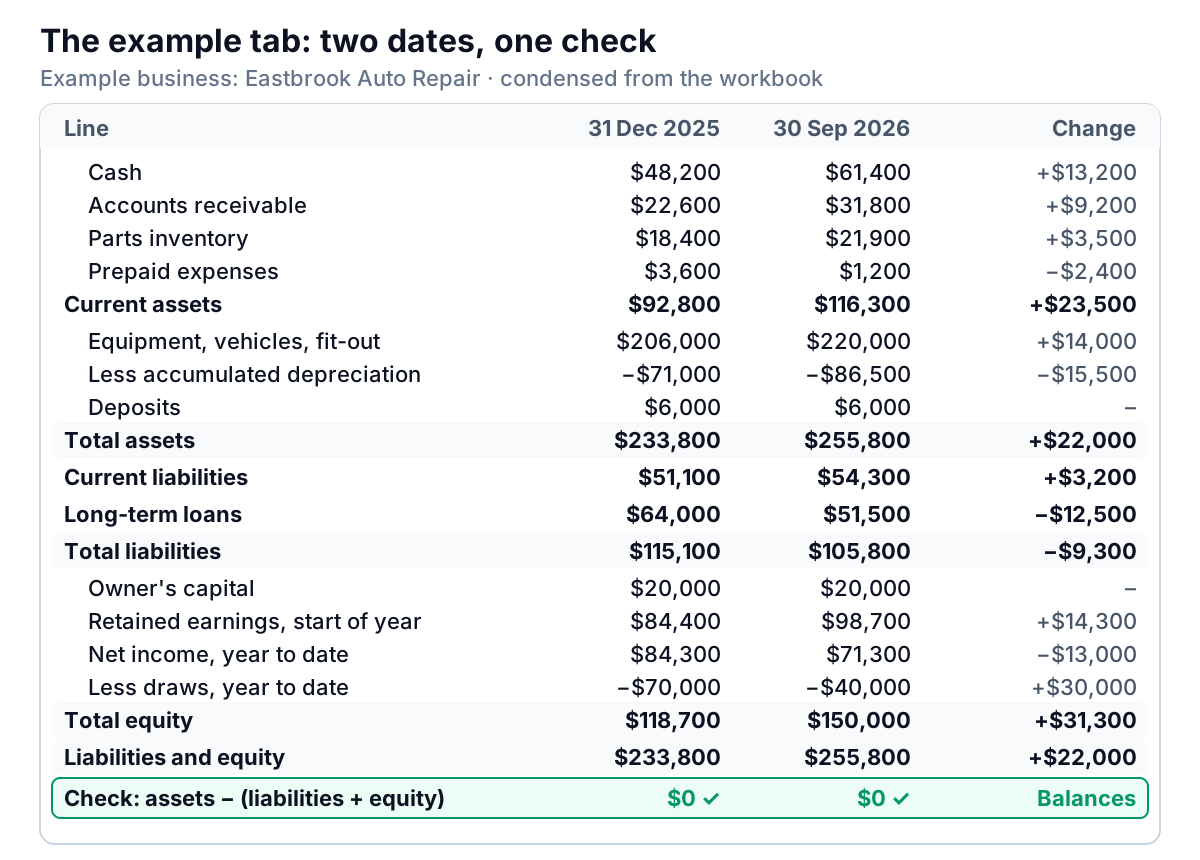
Three tabs: How to use, the filled-in Example balance sheet, and Your balance sheet. Amber cells are inputs; everything else is a formula. Column B is the earlier date, column C the later one, D and E the change in dollars and percent, and F says where to find each number.
The rows follow the equation every balance sheet rests on, which the SEC's beginners' guide to financial statements puts as assets = liabilities + shareholders' equity:
| Rows | Section | Lines |
|---|---|---|
| 11–16 | Current assets | Cash, accounts receivable, inventory, prepaid expenses, other; total |
| 18–22 | Fixed assets | Equipment, vehicles and leasehold improvements at cost, less accumulated depreciation; net total |
| 23–24 | Other assets and total assets | Deposits and long-term items; total assets |
| 28–34 | Current liabilities | Accounts payable, credit cards, sales tax, payroll liabilities, customer deposits, loan principal due within 12 months; total |
| 36–39 | Long-term liabilities | Loans due after 12 months, including money owed to the owner; total liabilities |
| 42–47 | Equity | Owner's capital, retained earnings at the start of the year, net income and draws for the year to date; total equity; liabilities and equity |
| 50–52 | Checks | The difference (must be $0), a status, and the retained earnings carry-forward |
| 55–58 | Key ratios | Working capital, current ratio, quick ratio, debt to equity |
Filling it in, section by section
Every figure comes from your accounting system's Balance Sheet report for the date at the top of the column. In QuickBooks Online, Intuit's help page on the Balance Sheet report says to go to Reports, then Standard reports, and open Balance Sheet, or Balance Sheet Comparison for two periods. Our guide to the QuickBooks balance sheet walks through that report line by line. Put the two dates in B8 and C8 first; usually your last year-end and the latest month-end.
Assets
- Cash (row 11): every bank and cash account, reconciled to the statement for that date. An unreconciled cash figure is the most common reason a balance sheet looks right and isn't.
- Accounts receivable (row 12): invoices sent and not yet paid. Eastbrook's are fleet accounts and insurance jobs.
- Inventory (row 13): stock at what you paid for it, from a count or your parts system.
- Prepaid expenses (row 14): bills paid ahead, such as an annual insurance premium, that haven't been used up yet.
- Fixed assets (rows 18–20) at cost, with accumulated depreciation in row 21 as a positive number. The formula in row 22 subtracts it:
=C18+C19+C20-C21.
Liabilities
The split that matters is current (due within 12 months) and long-term. A loan sits in both places: the principal due in the next year goes in row 33, the rest in row 36. Eastbrook owes $59,500 on its equipment loan at 30 September, so $18,000 is current and $41,500 long-term. Money you've lent the business goes in row 37 as a loan, not in equity, if that's how your accountant has recorded it.
Equity
Most accounting software shows equity before the year is closed as several lines, and the template mirrors that:
- Owner's capital (row 42): money the owners have put in.
- Retained earnings at the start of the year (row 43): profit kept from all earlier years. Intuit describes its retained earnings account as the total of income and expenses from all previous years, which QuickBooks Online moves there automatically when a new fiscal year starts.
- Net income, year to date (row 44): the bottom line of your profit and loss statement from the start of the year to the column's date. Intuit notes that the balance sheet's equity total includes net income for the fiscal year to date.
- Draws or distributions, year to date (row 45): what the owners took out, as a positive number. Row 46 subtracts it.
Equity accounts vary with how the business is set up (sole proprietor, partnership, LLC or corporation), and some software keeps draws as a running total until your bookkeeper closes them. Rename the lines to match your report, keep each one in the equity block, and ask your accountant if you're unsure which lines you should have.
The balance sheet template's check cell: what to do when it isn't $0
Row 50 subtracts liabilities and equity from total assets: =C24-C47. Row 51 turns that into a status, =IF(ROUND(C50,0)=0,"Balances ✓","Doesn't balance"), rounded to the nearest dollar so that cents don't trip it. On the empty tab both totals are zero, so it reads "Balances ✓" until you start typing, and then it keeps checking.
If your books are double-entry (QuickBooks, Xero and similar), the report you're copying from always balances. So a difference in the template means a copying error, and its size usually says which kind:
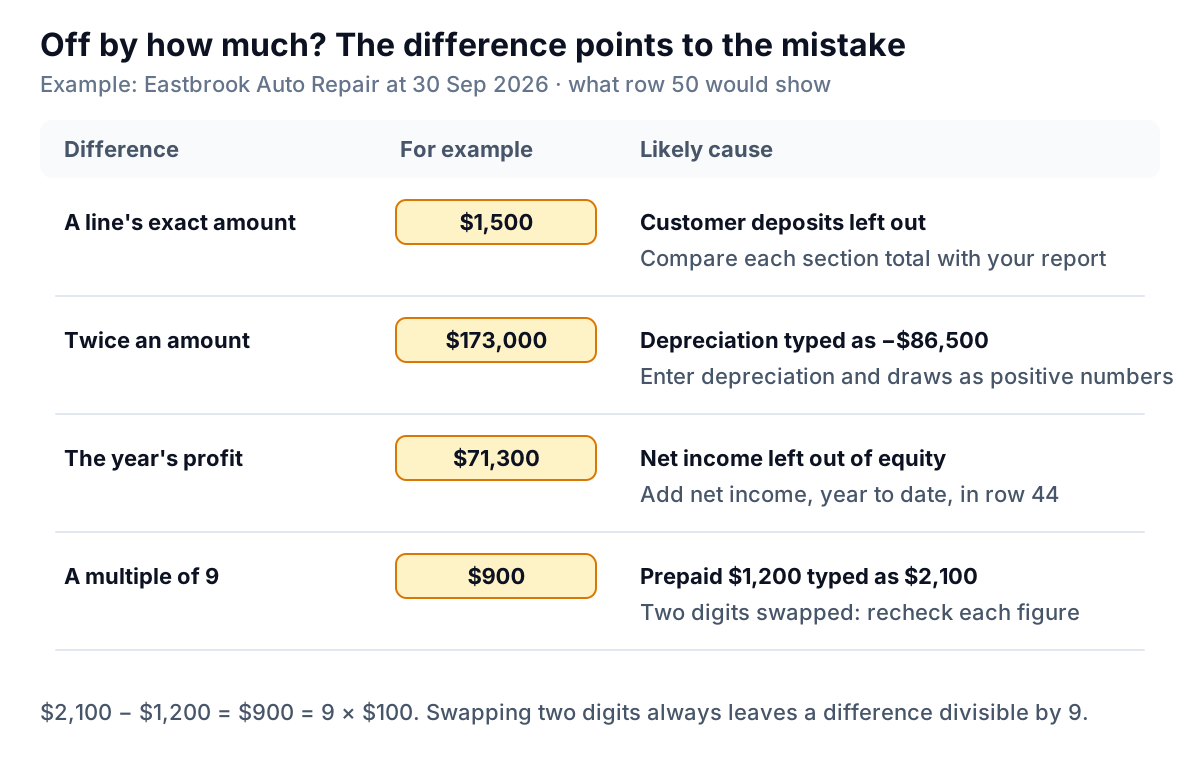
- Off by a line's exact amount: a line was missed. Compare each section total with the report.
- Off by twice an amount: a sign is wrong. Depreciation or draws typed as negative are the usual suspects.
- Off by the year's profit: net income is missing from equity, or it's in twice (once in retained earnings and again in net income).
- Off by a multiple of 9: two digits were swapped. The difference between a number and its transposed twin is always divisible by 9.
Never fix a difference by typing a balancing figure into retained earnings or "other". The check would pass and the balance sheet would be wrong.
Reading two dates side by side
A single balance sheet is a snapshot. Two of them show what the business did with the months in between. Eastbrook's change column says:
- Total assets rose $22,000, mostly cash (+$13,200) and receivables (+$9,200), plus a $14,000 alignment machine paid for in cash, partly offset by $15,500 of depreciation.
- Total liabilities fell $9,300, because $12,500 of loan principal was repaid.
- Total equity rose $31,300: $71,300 of profit so far this year, less $40,000 of distributions.
The carry-forward check
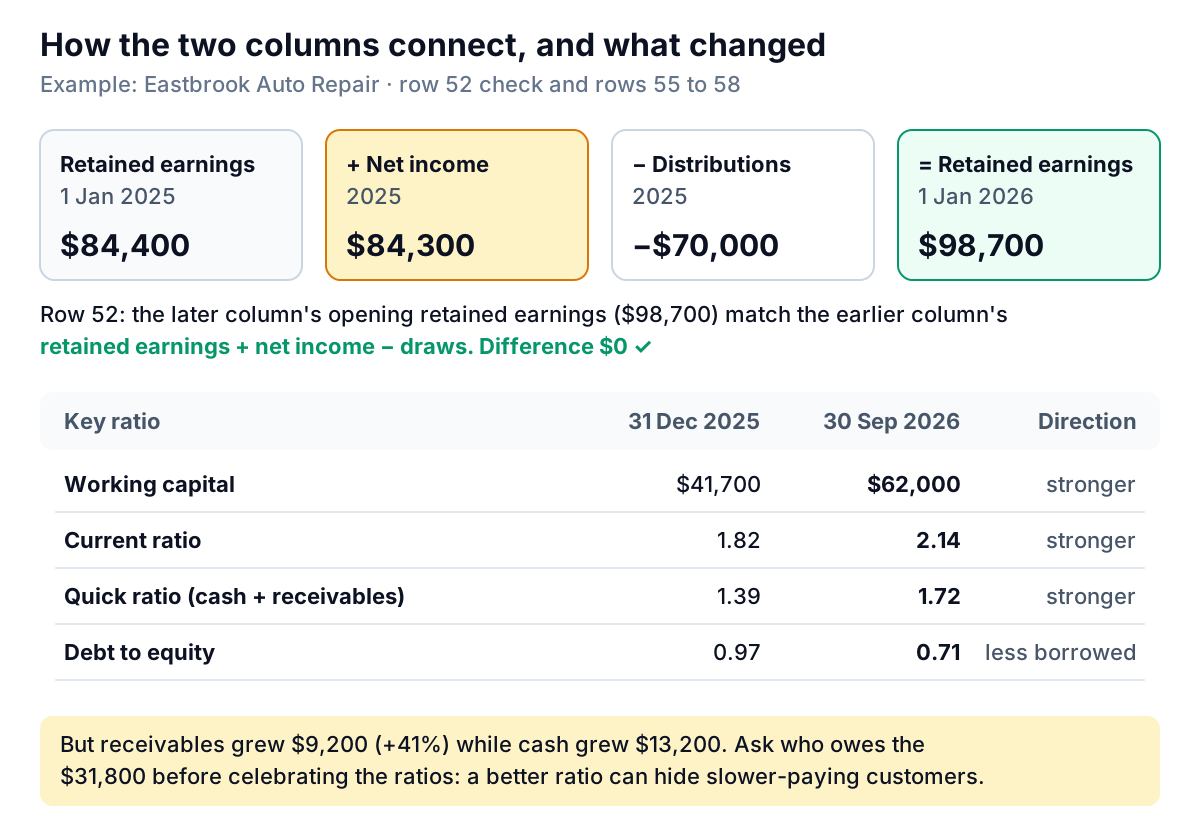
When the earlier column is your last year-end and the later one falls in the next year, the later column's opening retained earnings should equal the earlier column's retained earnings plus its net income minus its draws. Row 52 does that sum: =C43-(B43+B44-B45). For Eastbrook, $84,400 + $84,300 − $70,000 = $98,700, which matches. If yours doesn't, something was posted to a closed year after the fact, or draws weren't closed into retained earnings. That's a question for your bookkeeper, not something to adjust in the template. If your two dates fall in the same year, ignore row 52.
The ratios
- Working capital (row 55): current assets minus current liabilities. Eastbrook's rose from $41,700 to $62,000.
- Current ratio (row 56): current assets ÷ current liabilities, from 1.82 to 2.14.
- Quick ratio (row 57): cash plus receivables ÷ current liabilities, leaving out inventory and prepaids, from 1.39 to 1.72.
- Debt to equity (row 58): total liabilities ÷ total equity, from 0.97 to 0.71.
What counts as a good ratio depends on the business and on whoever is asking, so the template shows the numbers and leaves the judgment to you and your lender. Read them alongside the lines underneath. Eastbrook's ratios improved partly because receivables grew 41%. If that's slower-paying fleet customers rather than more work, the better ratio is hiding a collections problem; an accounts receivable aging report will tell you which.
When you'll need a balance sheet
- Borrowing. Each lender sets its own list of documents, so ask which statements and which dates it wants. A last year-end and a recent month-end side by side, as in this template, is a practical starting point, and it puts your profit and loss statement's net income in context.
- Selling or bringing in a partner. A buyer will look at what the business owns and owes, not only at what it earns.
- Tax returns, for some business types. For example, the 2025 Form 1120-S for S corporations includes Schedule L, "Balance Sheets per Books", which the form itself says a corporation doesn't need to complete if its total receipts for the year and its total assets at year-end were both under $250,000. Your accountant prepares those schedules from your books; this template is for your own use and isn't a tax form.
- Running the business. The SBA calls the balance sheet a snapshot of your business financials. Looking at it quarterly, next to the profit and loss statement, shows where the profit went.
What this template can't do
- It can't make your books balance. It checks whether the numbers you copied add up. A real balance sheet comes from double-entry books.
- It doesn't explain cash. The change column hints at where cash went, but it isn't a cash flow statement. Our guide to the balance sheet vs income statement shows how to trace a year's profit into the change in cash.
- It doesn't value the business. Assets are at cost less depreciation, not at what they'd sell for.
- It holds two dates. For a trend over several quarters, copy the tab or add columns, and keep each one's check cell.
- Equity lines differ by business type. Rename them to match your books, and ask your accountant if you're unsure.
The net income in row 44 comes from your profit and loss statement. If you don't have one laid out by month, our profit and loss statement template pairs with this one, and the guide to reading a profit and loss statement explains each line.
Where Parity helps
Copying balances by hand is where the $173,000 mistakes come from. Parity can take the balance sheet straight from your books instead. Connect QuickBooks Online, or upload a Balance Sheet export as a CSV or Excel file (Parity doesn't read PDFs), and it builds a dashboard with the headline numbers and their trends, charts, what explains them and a table of what needs attention. Every number is checked against queries on the full dataset before you see it. Ask for "working capital and the current ratio by quarter" or "which balances changed most since year-end", and when the bank wants a summary, ask Parity to write the report from the same data and export it to PDF.
Connect QuickBooks Online or upload a Balance Sheet export, and get a checked dashboard of what you own, what you owe and how your ratios are changing. Build a report from your data free
Or start with the spreadsheet. Download the balance sheet template (.xlsx), type one of the example's figures with the wrong sign to see the check cell react, then fill in your last year-end and your latest month-end.