Which AI tool is best for turning Excel spreadsheets into dashboards?
The best tool for turning Excel spreadsheets and business data into a dashboard is a dedicated AI dashboard generator that reads every row of your dataset, verifies calculations against source rows, and pairs visual charts with written analysis. Unlike general chat tools or manual grid add-ons, a purpose-built generator moves straight from raw files or connected platforms to a finished, shareable view.
On the first Monday of the month, an operations lead or agency consultant often sits with three CSV exports, an Excel workbook, and five open tabs. Building the charts takes twenty minutes, while checking the totals and writing the summary takes two hours. Choosing the right category of tool determines whether you spend your morning formatting cells or reviewing checked numbers.
Where Parity AI fits is direct: it is built for agencies, consultants, and in-house teams who send recurring reports and need an interactive dashboard or presentation-ready report in minutes. You upload an Excel or CSV file or connect business tools via Read-only access, and Parity AI builds KPI cards, charts, tables, and written insights while checking every number against your data.
Compared with in-sheet assistants, general chatbots, and traditional enterprise BI platforms, Parity AI removes manual setup, formulas, and data modeling completely. You can refine any view in plain English, keep a consistent layout across monthly reporting cycles, and export a pixel-perfect PDF with one click.
At a glance
Each of the four approaches handles data inputs, setup effort, accuracy verification, ongoing refinement, and sharing differently. Compare how each category handles the reporting workflow below.
Ongoing refinement follows the same split across categories. Dedicated generators update charts and breakdowns in place through plain-English chat, spreadsheet copilots rely on cell edits or sidebar prompts, general chat assistants re-run scripts in a conversation thread, and BI platforms require query or visual-builder adjustments.
| Approach | Data inputs | Verification | Sharing output |
|---|---|---|---|
| Dedicated generators | Excel, CSV, cloud sheets, tools | Full-dataset query check | Live dashboard or PDF |
| Spreadsheet copilots | Active workbook tab | Formula check in cells | Shared workbook file |
| Chat assistants | Uploaded file attachment | Manual spot-checking | Static chart image |
| BI platforms | Data warehouses, SQL | Governed semantic layer | Portal viewer seats |
Dedicated AI dashboard generators: from raw files and business tools to live views
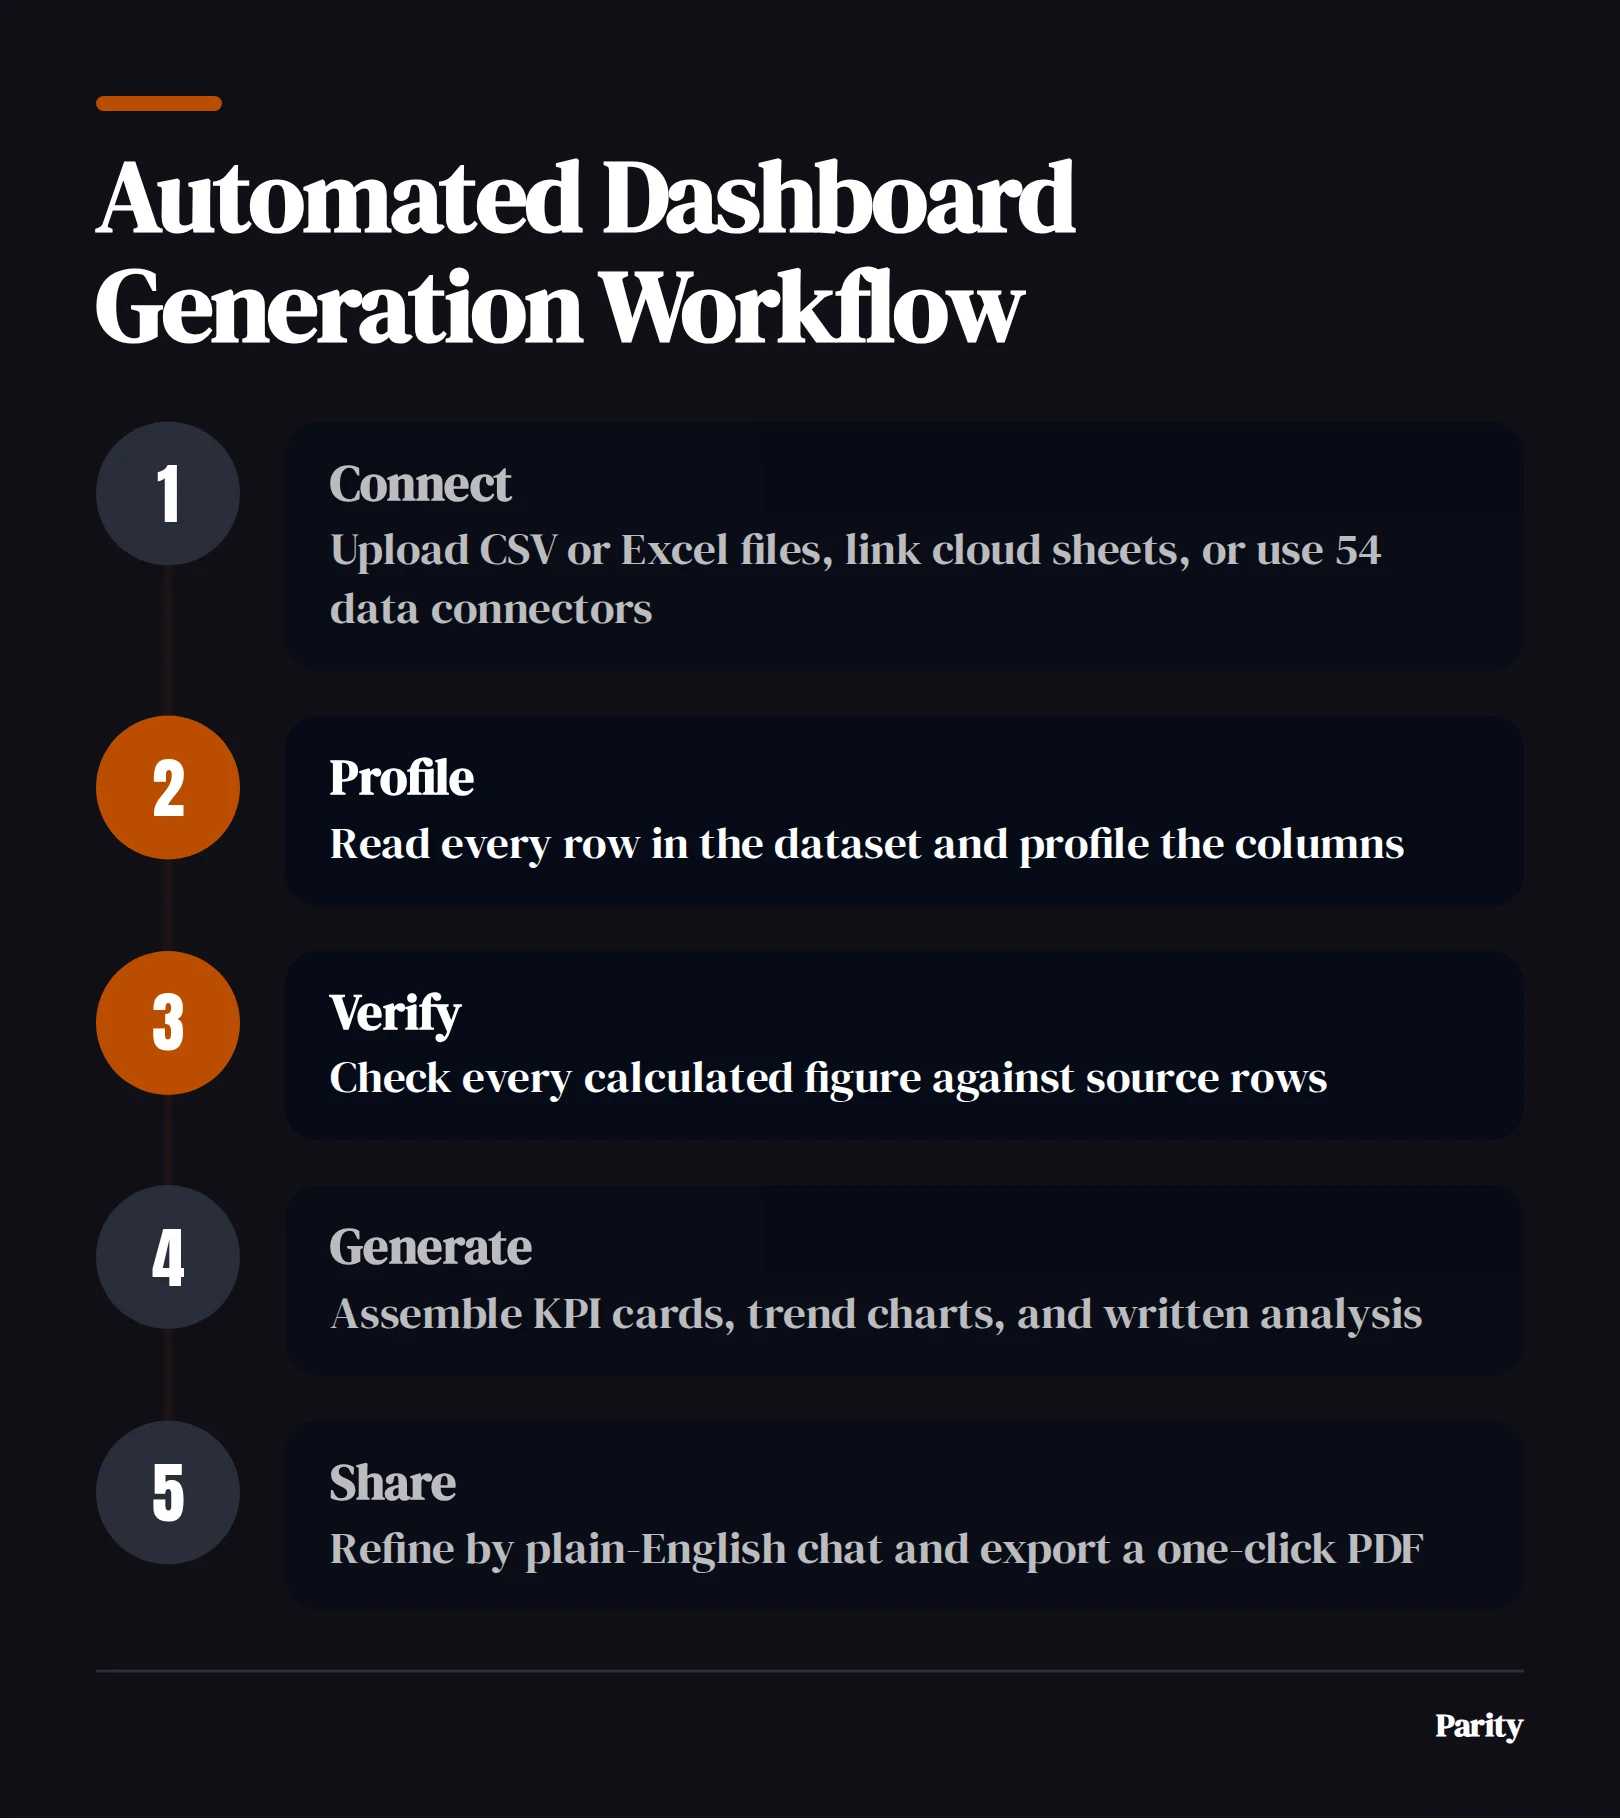
Dedicated generators are built specifically to bridge the gap between raw operational rows and a presentation-ready view. Instead of asking you to drag fields onto a canvas or write cell expressions, they read the entire file or connected source, profile the columns, and assemble the dashboard layout automatically.
In Parity AI, this process works across both local files and live cloud connections. You can upload CSV, .xlsx, or .xls files, link cloud sheets from Google Sheets, Google Drive, Excel on OneDrive, or Airtable, or use 54 supported data connectors including QuickBooks, Stripe, Shopify, Meta Ads, HubSpot, and Google Analytics.
The defining advantage of a dedicated generator is how it treats accuracy and narrative:
- Every row counted: The software reads all rows in the dataset rather than guessing from a tiny preview sample.
- Written analysis included: Headline KPI cards and trend charts appear alongside written insights explaining what moved.
- Conversational refinement: You can add charts, change breakdowns, or re-summarize by chatting in plain English.
- Presentation-ready output: When stakeholders need a static pack, you export a pixel-perfect PDF with one click.
Built-in spreadsheet copilots: staying inside your workbook
Built-in spreadsheet copilots live inside desktop and cloud spreadsheet programs. They are designed to help users who already work inside a grid draft cell calculations, insert pivot tables, or place a quick bar chart on an adjacent tab. Building and formatting workbook charts still centers on selecting data ranges, picking chart types, and adjusting layout elements inside the sheet.
Spreadsheet charts depend directly on how rows and columns are arranged in the underlying cells. If your source export has merged headers, subtotals mixed with line items, or multi-tab splits, an in-sheet assistant requires you to clean the grid before it can plot anything cleanly.
Spreadsheet copilots fit best when:
- Your data lives in one clean table: You only need a single chart next to your working calculations.
- Your audience wants a workbook: The recipient expects an
.xlsxfile they can filter or edit themselves. - You do not need cross-tool reporting: You are not blending accounting, commerce, or ad metrics with the sheet.
General AI chat assistants: fast ad hoc charts from uploaded CSVs
General conversational assistants allow you to attach a CSV or Excel file to a chat thread and ask questions about the numbers. Under the hood, most general chatbots write and run a quick script to summarize columns or render a static chart image inside the conversation window.
While useful for one-off exploration, general chat threads introduce real risks for recurring business reporting. Without strict grounding and validation controls, conversational models can produce unverified outputs or misstate totals. If a chat assistant misinterprets a date column, drops rows with missing values, or drafts an inaccurate narrative takeaway, you often cannot click the headline number to see which rows were counted.
Watch out: General chat assistants rarely save a repeatable layout. When next month's Excel export arrives, prompting the same chatbot often yields a completely different set of chart styles, color palettes, and summary headings.
Teams comparing options for recurring reporting generally keep general chatbots for rough brainstorming rather than client deliverables or board packs.
BI platforms with AI assistants: governed views for dedicated data teams
Traditional business intelligence platforms have added natural-language chat panes on top of their enterprise reporting suites. These systems are powerful when a company already maintains a centralized cloud data warehouse, defined table relationships, and dedicated analysts.
However, traditional BI tools expect governed data setups first. Preparing a report typically involves importing tables, shaping queries, defining table relationships, and dragging fields onto a report canvas before publishing. When a consultant or finance manager simply wants to drop in a fresh client Excel file and send a polished summary five minutes later, setting up schemas and viewer seats adds unnecessary friction.
Traditional BI platforms make sense when:
- You have a dedicated data engineering team: Schemas and pipelines are already maintained in a warehouse.
- You need complex role-based permissions: Hundreds of internal viewers query the same governed warehouse tables daily.
- Setup time is not the bottleneck: Weeks of initial configuration are acceptable for a multi-year internal portal.
Where Parity AI fits: who it is for, what it does, and how it compares
Parity AI is built for agencies, consultants, and in-house marketing, sales, finance, and operations teams who need to turn raw spreadsheets or business tool data into accurate dashboards and automated client reports without manual setup. There are no templates to configure, no formulas to debug, and no chart wizards.
How Parity AI turns data into verified dashboards and reports
When you connect a tool or upload a spreadsheet, Parity AI reads every row in the dataset rather than sampling. It builds an interactive dashboard in minutes complete with KPI cards, trend charts, tables, and written analysis, and it suggests what to look at next. If you need a formal document, its AI report generator produces a complete report with an executive summary, charts, tables, and written analysis that exports to a pixel-perfect PDF in one click.
How Parity AI compares on verification, privacy, and repeatability
- Every number checked against source data: Every reported figure is verified before you see it, and you can click any headline figure to inspect the underlying query and the exact rows counted behind it.
- Read-only connections and strict privacy: Parity AI connects to business tools in Read-only mode so it never alters your systems, transmits files over an encrypted connection, protects saved dashboards and reports under your account, and never trains AI models on customer data.
- Consistent monthly format: You can re-run a report on new period data to keep the same layout across reporting cycles, then tweak any section with plain-English prompts before exporting.
How to choose the right tool and verify every number before you share it
Before you send an automated dashboard or report to an executive or paying client, run a quick verification test on your own spreadsheet. Even well-structured exports can trip up tools that sample rows or guess column types.
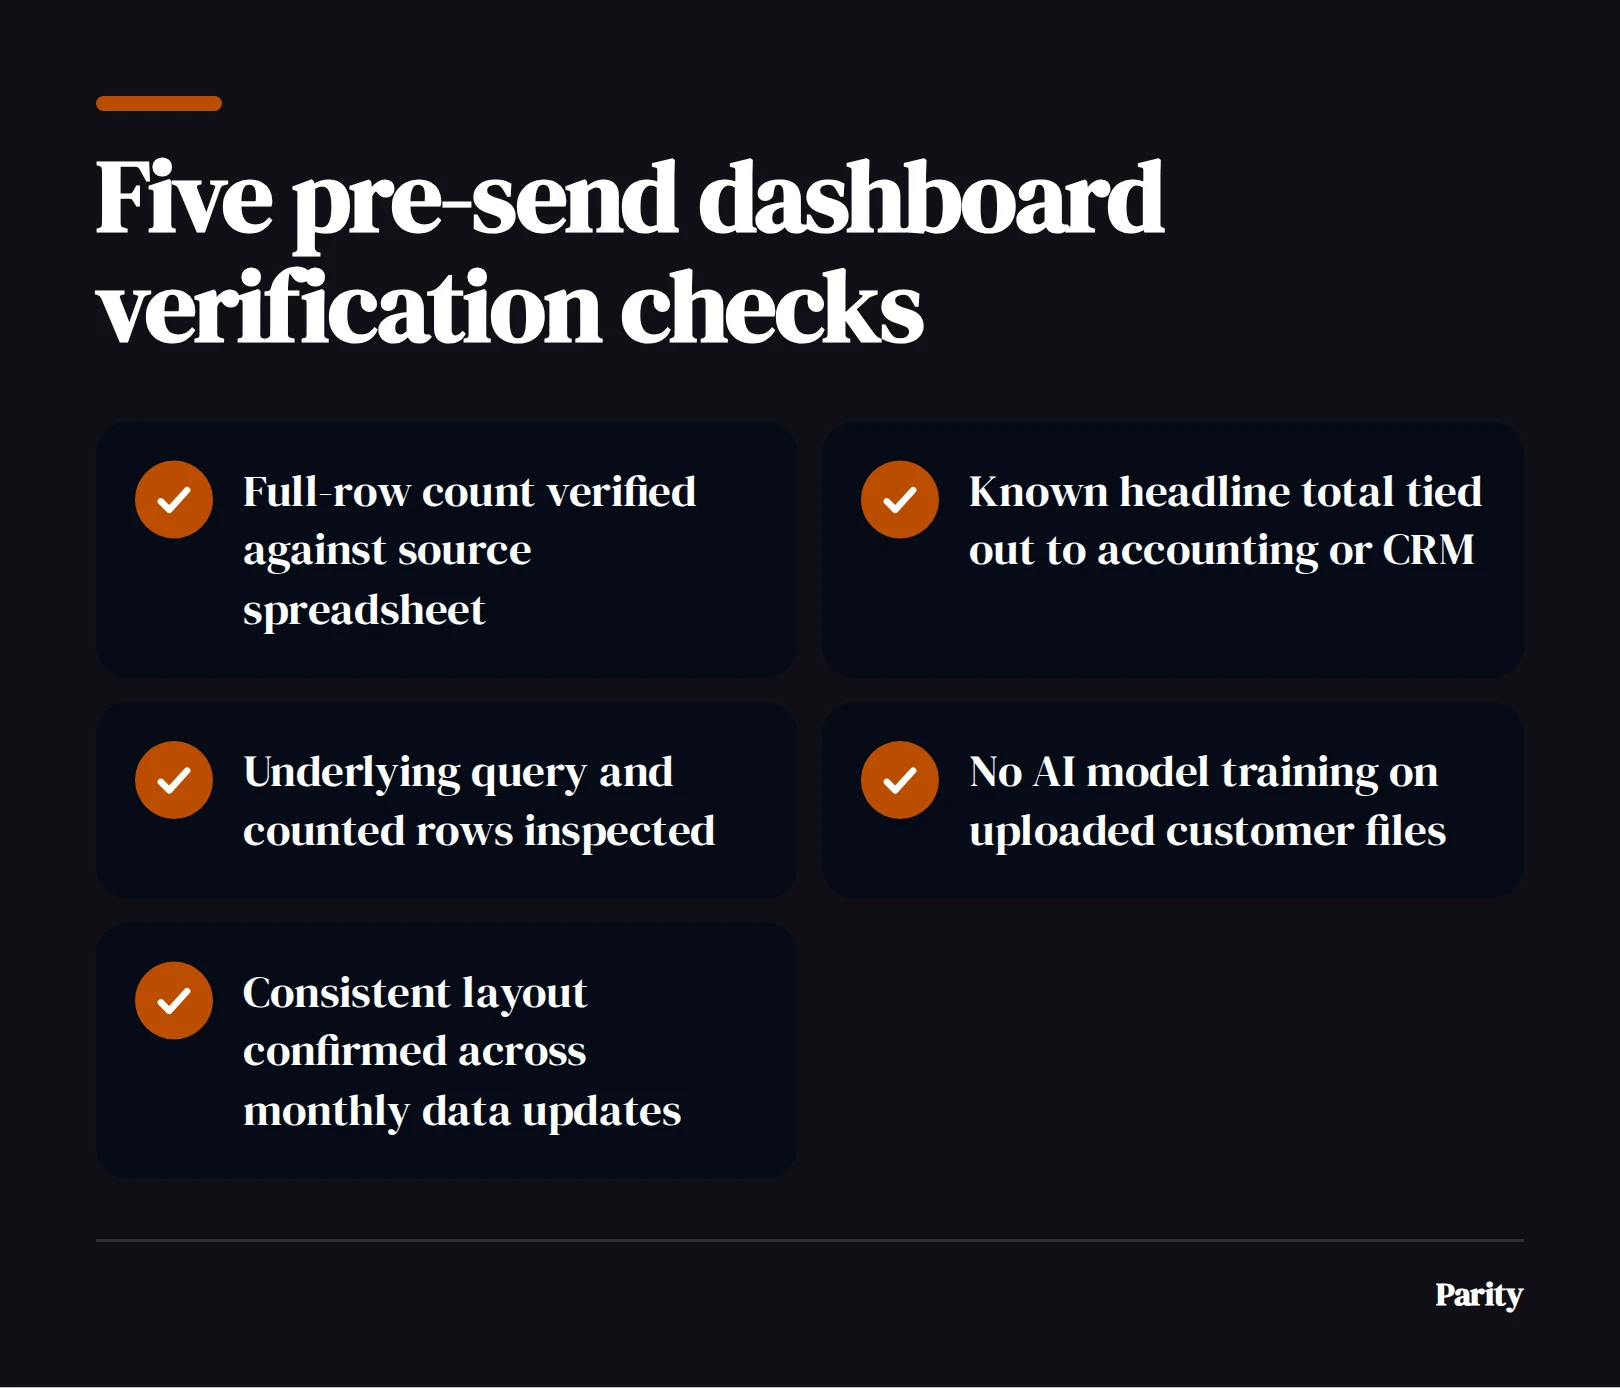
Follow these five steps to audit any dashboard tool on your first upload:
- Check the total row count: Confirm the tool processed every row in your CSV or Excel tab rather than truncating after a preview limit.
- Tie out one known headline metric: Compare a sum like total revenue or overdue invoices against your accounting system or spreadsheet status bar.
- Inspect the underlying query: Click a KPI card to verify which filter, date range, and source rows produced that exact figure.
- Confirm data privacy terms: Ensure your uploaded files are encrypted, isolated to your account, and never used to train models.
- Test a second period update: Upload a new month's file to confirm you can keep a consistent layout across reporting cycles.
Which to choose
Match the tool category to who reads your numbers and how often you update them:
- Agencies, consultants, and in-house teams sending recurring reports: Choose Parity AI to turn Excel files, CSVs, or 54 connected business tools into checked interactive dashboards and one-click PDF reports in minutes.
- Analysts working inside a single workbook: Use a built-in spreadsheet copilot when your stakeholders want an
.xlsxfile back and your data sits in one clean tab. - Individuals exploring a one-off public dataset: Use a general chat assistant when you only need a quick exploratory chart and plan to double-check the math by hand.
- Enterprises querying a central data warehouse: Use a traditional BI platform when a dedicated data engineering team already maintains your schemas and viewer permissions.
Upload an Excel or CSV file or connect your business tools to get a verified dashboard and presentation-ready report in minutes. Connect your data