In the same week of August, the owner of Driftwood Surf School, an example business we'll use in this guide, was given three conversion rates for July. Her analytics said 2.25%. Her booking software's dashboard implied about 2.5%. The freelancer who runs her ads said 3%. She assumed two of them were wrong. None of them were. Each used the same conversion rate formula with a different bottom half.
This guide sets out the formula, the four versions a small business actually meets, and which one answers which question. It works through a single month of real-looking numbers, then covers the traps: mixing units, channel mix, timing, tracking and noise. It ends with how to set the number up so next month's figure means the same thing as this month's.
The conversion rate formula
Every version has the same shape:
Conversion rate = number who did the thing ÷ number who had the chance × 100
The rule that keeps it honest: the top and bottom must count the same kind of thing. Sessions over sessions. People over people. Enquiries over enquiries. Most bad conversion rates come from applying the conversion rate formula without that rule, usually by dividing orders by sessions or customers by visits.
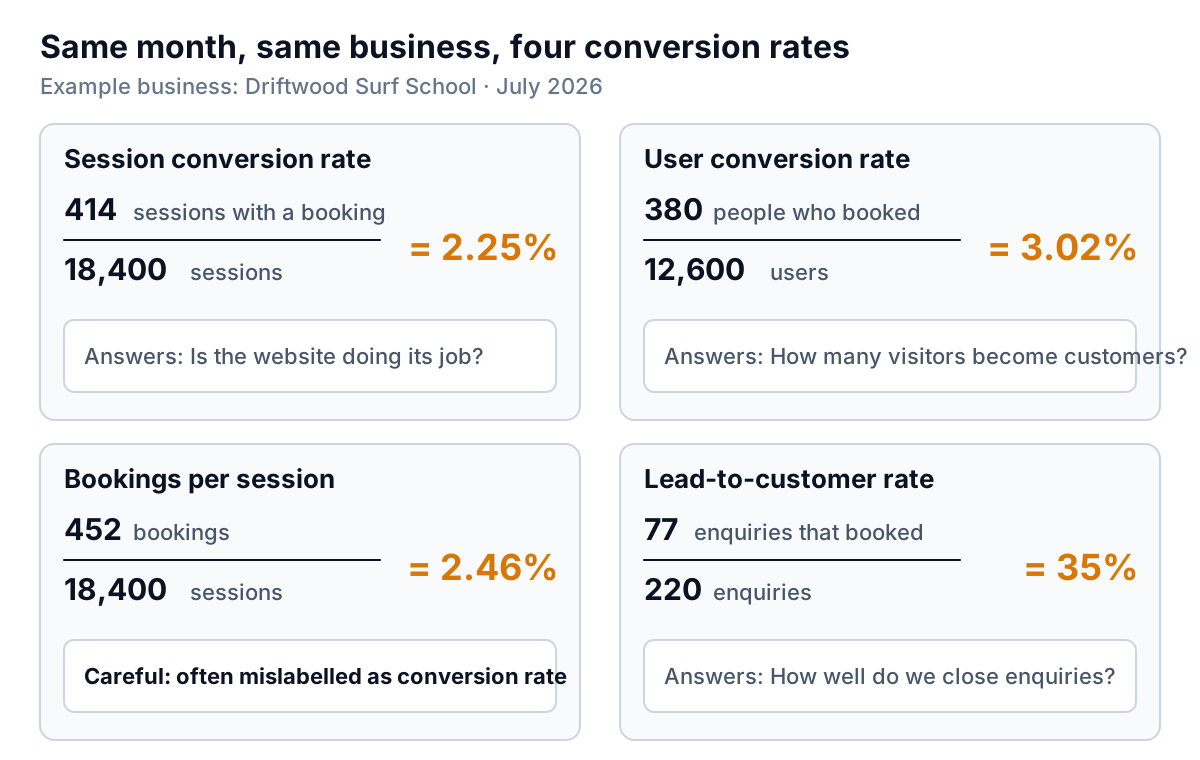
Here are Driftwood's July numbers, run four ways.
1. Session conversion rate
Sessions that included a booking, divided by all sessions: 414 ÷ 18,400 = 2.25%. A session is one visit. This is the standard measure of how well a website turns visits into sales, and it's what most tools report. Shopify's analytics, for example, defines conversion rate as sessions that completed checkout divided by sessions. Google Analytics 4 calls its version session key event rate: the share of sessions in which a key event, such as a booking you've marked as important, happened.
2. User conversion rate
People who booked, divided by people who visited: 380 ÷ 12,600 = 3.02%. Many people visit more than once before booking a surf lesson: they check the price, then the weather, then come back. Counting people rather than visits gives a higher rate, and for a considered purchase it's often the more realistic picture. This is probably the 3% the ads freelancer quoted.
3. Bookings per session (the common mistake)
Total bookings divided by sessions: 452 ÷ 18,400 = 2.46%. Some people booked twice in one visit (a lesson for themselves, then one for a friend), so bookings exceed sessions with a booking. The result isn't a conversion rate, because the top and bottom count different things. It's a useful activity measure, and it's roughly what Driftwood's booking dashboard was showing. Just don't compare it with a session conversion rate.
The same trap exists inside analytics tools. GA4 lets you choose whether a key event is counted once per event or once per session; Google recommends once per event, and events created in GA4 usually default to it. If your booking event can fire twice in a visit, your key event count will be higher than the number of sessions that converted.
4. Lead-to-customer rate
Enquiries that became paying customers, divided by all enquiries: 77 ÷ 220 = 35%. Driftwood gets enquiries for group bookings, private lessons and school trips by phone, email and a website form. This rate has nothing to do with the website. It measures how well the business follows up and closes. For many service businesses it's the conversion rate that matters most.
Break the rate into steps
A single conversion rate tells you how well things went, not where they went wrong. Split the journey into steps and calculate a rate for each, using the count from the step before as the denominator.
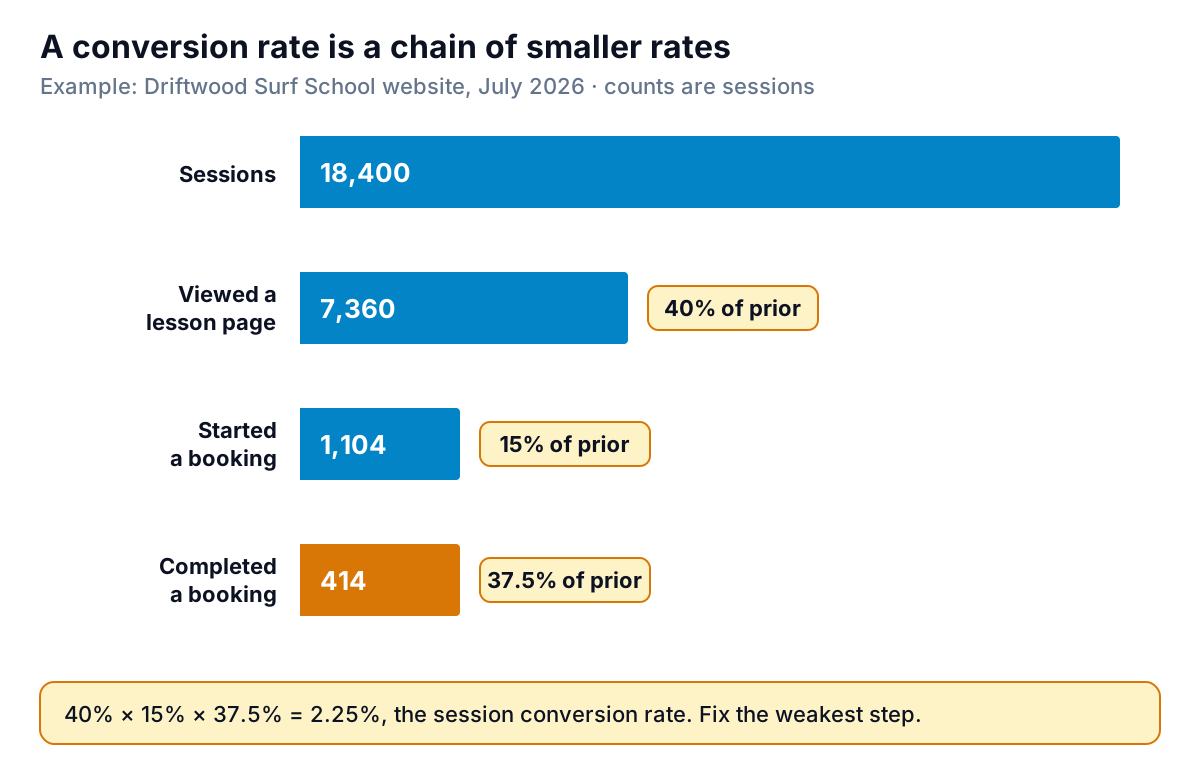
Multiply the step rates together and you get the overall rate: 40% × 15% × 37.5% = 2.25%. Now there's something to act on. Only 15% of people who looked at a lesson page started a booking. That points at the lesson page itself: is the price clear, are the dates visible, does it say what's included? Of those who started, 37.5% finished, which suggests the booking form loses people too. Both are worth testing. The homepage, which gets 40% of visitors to a lesson page, is less urgent.
A rough guide to where to look:
- Few visitors reach the product or service page: navigation, or the wrong visitors. Check where the traffic comes from.
- Many reach it, few start: price, availability, trust (reviews, photos), or unclear information.
- Many start, few finish: form length, surprise costs at the end, payment problems, mobile layout.
When every channel improves and the total falls
In July, a reel on Driftwood's Instagram account was shared widely. Sessions jumped from 11,000 in June to 18,400 in July. The session conversion rate fell from 2.6% to 2.25%, and the owner's first thought was that the new booking page had made things worse.
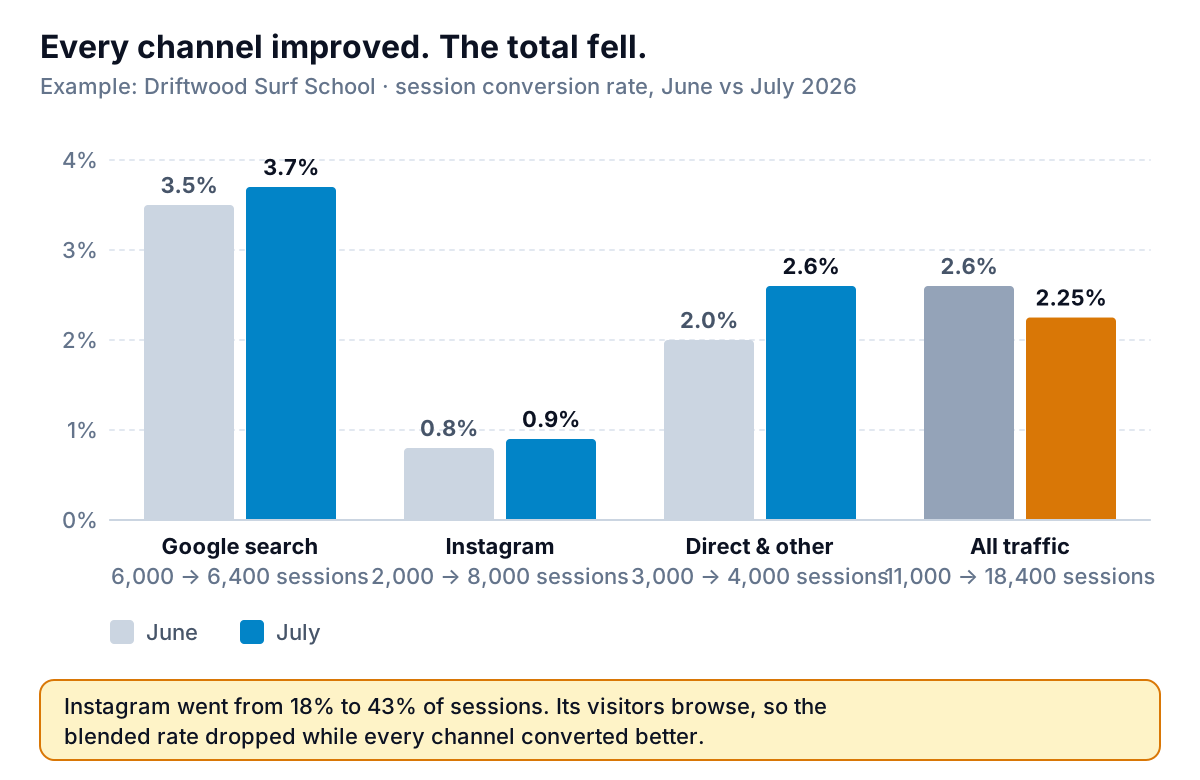
Split by channel, the picture reverses. Google search improved from 3.5% to 3.7%. Instagram improved from 0.8% to 0.9%. Direct and other traffic improved from 2.0% to 2.6%. The total fell only because the mix changed: a lot more visitors came from the channel where people browse rather than book. Total bookings actually rose from 286 sessions with a booking in June to 414 in July.
The rule: before you react to a change in conversion rate, split it by channel (and by device, if mobile and desktop behave differently). If the channel rates hold steady and the mix moved, nothing is broken. You just got a different crowd.
Other traps in the conversion rate formula
- Timing. A group enquiry in late June may book in July. If you divide July's bookings by July's enquiries, the rate swings with the calendar. Count conversions against the month the enquiry or visit arrived, and give recent months time to mature before you judge them.
- Junk in the denominator. Bot traffic, your own visits and staff checking the booking page all inflate sessions and pull the rate down. Filter internal traffic in your analytics tool, and be suspicious of sudden traffic spikes from places you don't serve.
- Broken tracking. If the booking confirmation page changes and the tracking tag stops firing, conversions drop to near zero overnight. A sharp fall to almost nothing is almost always tracking, not customers. Compare analytics bookings with the booking system's own count every month.
- Small numbers. Counts bounce around by chance. A rough rule from the statistics of counts: random variation is about plus or minus 2 × √(conversions). Driftwood's 414 bookings could easily have been anywhere from about 373 to 455 on the same traffic, which is 2.0% to 2.5%. A move from 2.25% to 2.4% next month means nothing on its own. A business with 30 conversions a month should compare quarters, not months.
- The wrong "conversion". A newsletter sign-up, a click on the phone number and a paid booking are all conversions in some tool. Only one of them is money. Keep one headline conversion rate for paid customers, and track the others as steps.
What's a good conversion rate?
You'll find plenty of published benchmarks, and they're hard to use. They mix session and user rates, ecommerce and lead generation, and businesses of every size and price point. A surf lesson at $96 and a $9 phone case shouldn't convert at the same rate, and nobody should expect a bespoke kitchen to convert online at all. We don't quote a benchmark here because we haven't found one that's both current and defined tightly enough to compare with your own number.
Compare against yourself instead:
- Same month last year, for seasonal businesses. July against July, not July against February.
- A rolling three-month average, to smooth out noise.
- Channel against channel, using the same formula for each.
And look at the number the conversion rate feeds into. Revenue per session is conversion rate × average order value. Driftwood's July bookings averaged $96, so revenue per session was 452 × $96 ÷ 18,400 = $2.36 (here using all bookings, because revenue counts every booking). If a change to the booking page lowers the conversion rate but raises the average booking, say by selling lesson packs, revenue per session can still go up. That's the better test of whether a change worked.
Setting it up so the number stays comparable
A conversion rate is only useful over time if it's calculated the same way every month. Write down four things and keep them fixed:
- The conversion: a paid booking, an order, a signed quote. One event.
- The denominator: sessions, users or leads, and which tool counts them.
- The counting rule: once per session or every occurrence.
- The period rule: conversions counted against the month of the visit or enquiry, or the month of the sale.
A simple monthly sheet for a business like Driftwood needs only a handful of columns, one row per month and channel:
| Column | Where it comes from | July, all channels |
|---|---|---|
| Sessions | Analytics tool | 18,400 |
| Sessions with a paid booking | Analytics tool (key event) | 414 |
| Bookings and booking value | Booking system or till | 452 · $43,392 |
| Enquiries and enquiries won | CRM or enquiry log | 220 · 77 |
| Session conversion rate | Calculated | 2.25% |
| Revenue per session | Calculated | $2.36 |
In a spreadsheet the conversion rate formula itself is one cell: with conversions in B2 and the denominator in C2, =B2/C2 formatted as a percentage. The work is in the inputs. Export sessions and sessions with a booking by channel from your analytics tool, bookings and booking value from your booking system or till, and enquiries and their outcomes from your CRM or enquiry log. Then compare them every month. Our guides to the sales dashboard and the KPI dashboard cover where conversion rates sit among your other numbers, and the ecommerce dashboard guide covers the online store version.
Parity can do the joining. Connect Shopify, Stripe, Square or HubSpot directly, or upload CSV or Excel exports from your analytics and booking tools, and it builds a dashboard with the headline numbers and their trends, charts, what explains the changes and a table of what needs attention. Every figure is checked against queries on the full dataset before you see it. You can ask for exactly the definition you wrote down ("session conversion rate by channel, sessions with a paid booking over all sessions, June vs July") and refine it by chat.
Bring your traffic, bookings and enquiries together, split by channel, with every number checked. Build a report from your data free
When someone hands you a conversion rate, ask two questions before you react: divided by what, and split by what? Driftwood's owner asked them about July and found that the drop had nothing to do with her new booking page: her Instagram audience was simply large and curious. The step worth fixing first was the lesson page. That's a much better August plan than tearing up the booking form.