On the last evening of December, the owner of Bramble Hot Sauce Co., an example business we'll follow through this guide, stood in a rented kitchen with a clipboard and counted 1,200 finished bottles, a shelf of empty glass and a few drums of vinegar. That count took her two hours. It also set her profit for the year more than any sale she made in the previous twelve months.
That's because the cost of goods sold formula is a subtraction. You add up everything you could have sold, then take away what's still on the shelf. Whatever you write down for the shelf flows straight into gross profit, and from there into your tax return. This guide works through the formula with Bramble's books, shows which costs belong in it, and covers the mistakes that make the number wrong.
The cost of goods sold formula
In its short form:
Cost of goods sold = beginning inventory + purchases − ending inventory
Beginning inventory is what you had on hand at the start of the period, valued at cost. Purchases are what you bought to sell, or bought to make into something you sell. Ending inventory is what's left at the end, also at cost. The difference is the cost of the goods that actually left the building.
If you make what you sell, the short form leaves things out. The IRS version on Schedule C, lines 35 to 42 (explained in Publication 334) has five inputs, not two:
| Schedule C line | What goes there |
|---|---|
| 35 Inventory at beginning of year | Last year's closing inventory. If it's different, you have to explain why. |
| 36 Purchases less items withdrawn for personal use | Merchandise bought for sale, or raw materials and parts for making the product, net of returns to suppliers and anything you took home |
| 37 Cost of labor | Wages for people who make the product. Not what you pay yourself. |
| 38 Materials and supplies | Supplies used up in making the goods |
| 39 Other costs | Freight-in, containers that are part of the product, and production overhead |
| 40 Add lines 35 through 39 | Cost of goods available for sale |
| 41 Inventory at end of year | The year-end count, at cost |
| 42 Cost of goods sold | Line 40 minus line 41 |
A reseller, such as a shop that buys finished goods, mostly uses lines 35, 36 and 41. Publication 334 says labor is usually part of cost of goods sold only in manufacturing or mining, and that small merchandisers usually don't have labor costs that belong there. A maker like Bramble uses every line.
A worked example: one year at Bramble Hot Sauce
Bramble cooks sauce in a commercial kitchen rented by the hour, bottles it, and sells it online, at two farmers markets and wholesale to a handful of shops. Net sales for 2025 were $136,000. Here's how its cost of goods sold builds up.
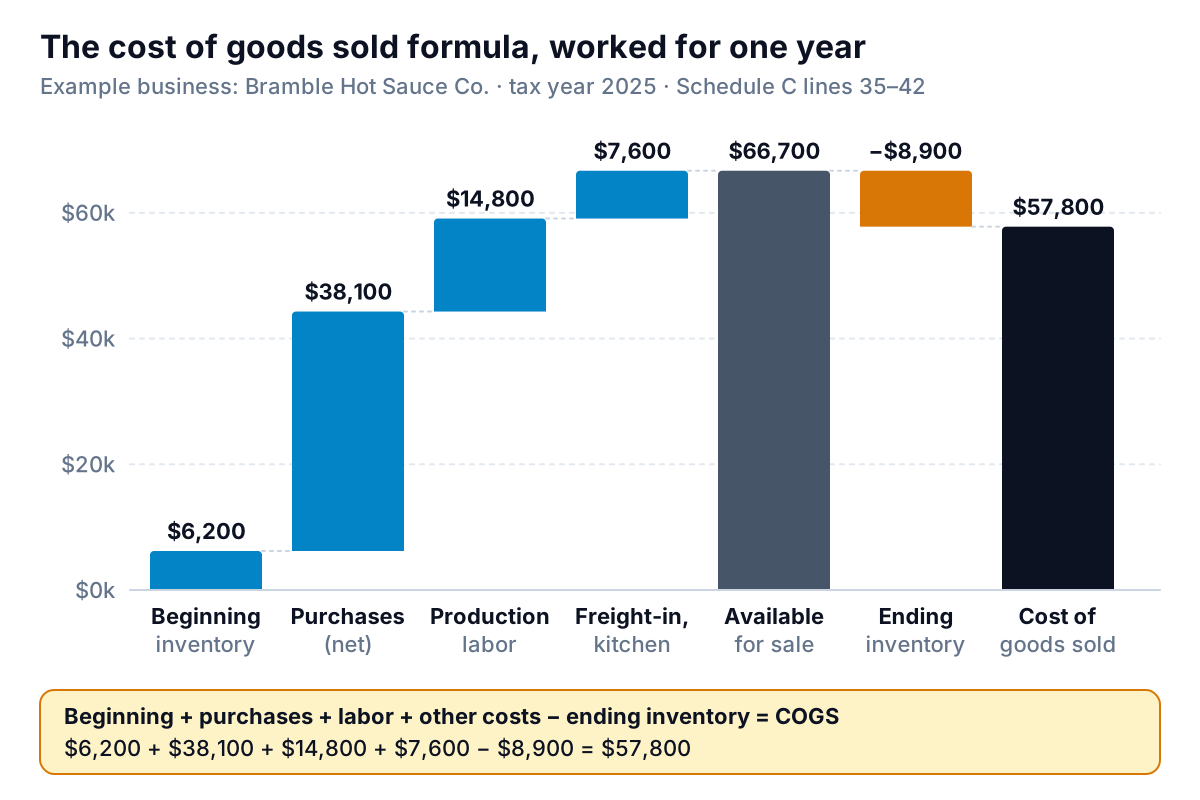
- Beginning inventory, $6,200. Last year's closing count: finished bottles plus ingredients and packaging on hand on January 1.
- Purchases, $38,100. Peppers, vinegar and spices ($19,600), bottles, caps and shipping cases ($13,300) and labels ($5,500), less $300 of bottles the owner gave to family over the holidays. Personal-use items come out of purchases; they weren't sold.
- Labor, $14,800. Wages for the part-time cook who works the production days. The owner's own draw doesn't go here.
- Other costs, $7,600. Freight on incoming supplies ($1,600) and the kitchen hours booked for production ($6,000).
- Available for sale: $66,700.
- Ending inventory, $8,900. 1,200 finished bottles at $3.10 each ($3,720) plus $5,180 of ingredients and packaging not yet used.
- Cost of goods sold: $66,700 − $8,900 = $57,800.
From there, gross profit is $136,000 − $57,800 = $78,200, and gross margin is $78,200 ÷ $136,000 = 57.5%. That margin is the number Bramble uses to set wholesale prices, so the ending count matters for pricing as well as tax.
What counts as cost of goods sold, and what doesn't
The question that trips people up isn't the arithmetic. It's which costs go in. A useful test: would this cost exist if you made and bought nothing to sell this year? If it would, it's probably an operating expense, not cost of goods sold.
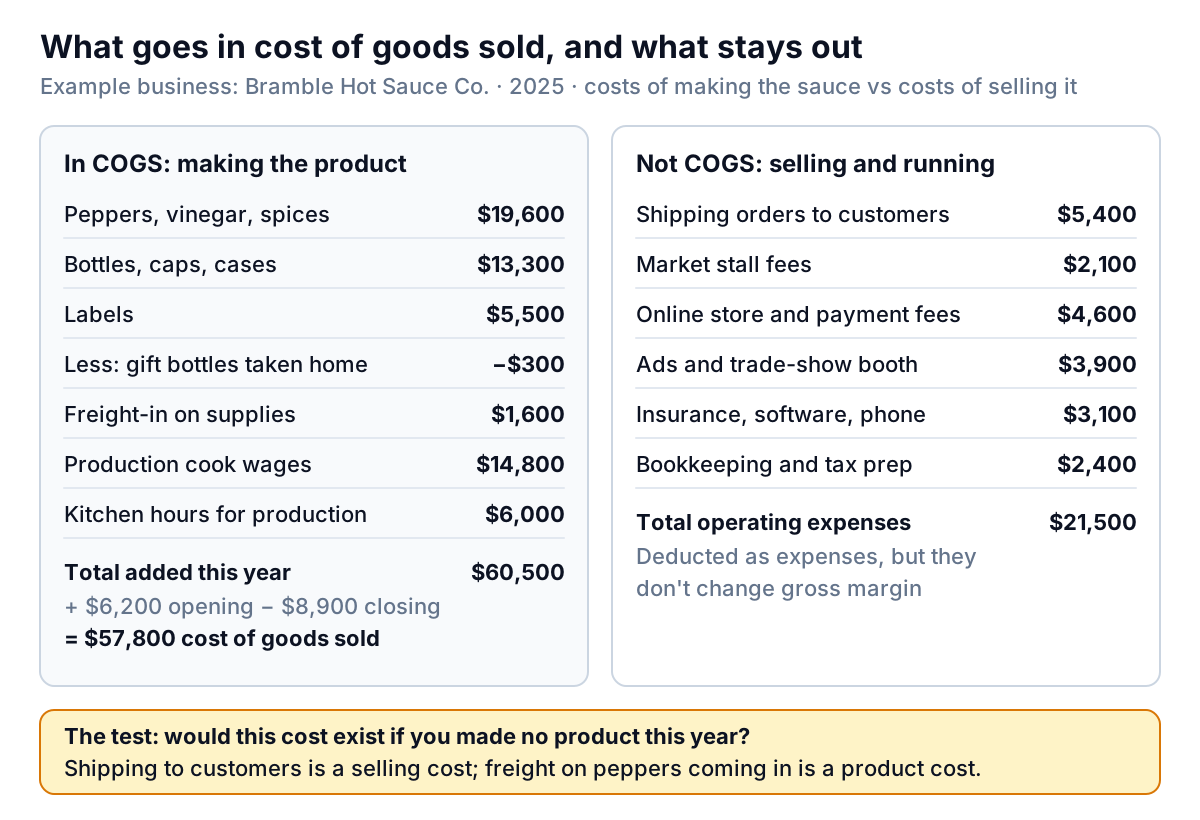
Some pairs that look alike but go on different sides:
- Freight in vs freight out. Publication 334 lists freight-in on raw materials and merchandise as part of cost of goods sold. Shipping orders to your customers is a selling cost.
- Bottles vs mailer boxes. Containers that are an integral part of the product (the bottle the sauce lives in) are cost of goods sold, per the same publication. Packaging that isn't part of the product, like the box you mail it in, is a shipping or selling expense.
- Production wages vs everyone else's. The cook's hours on production days count. The person who packs online orders or staffs the market stall is selling.
- Production overhead vs general overhead. Publication 334 says overhead such as rent, power and insurance that's a direct and necessary expense of the manufacturing operation goes in. The bookkeeper and the website don't.
Ending inventory is where the cost of goods sold formula goes wrong
Every dollar of error in the ending count changes cost of goods sold by a dollar, in the opposite direction. Overstate inventory, and cost of goods sold falls and profit rises. Understate it, and the reverse happens. The most common way to overstate it is to value the count at selling price.
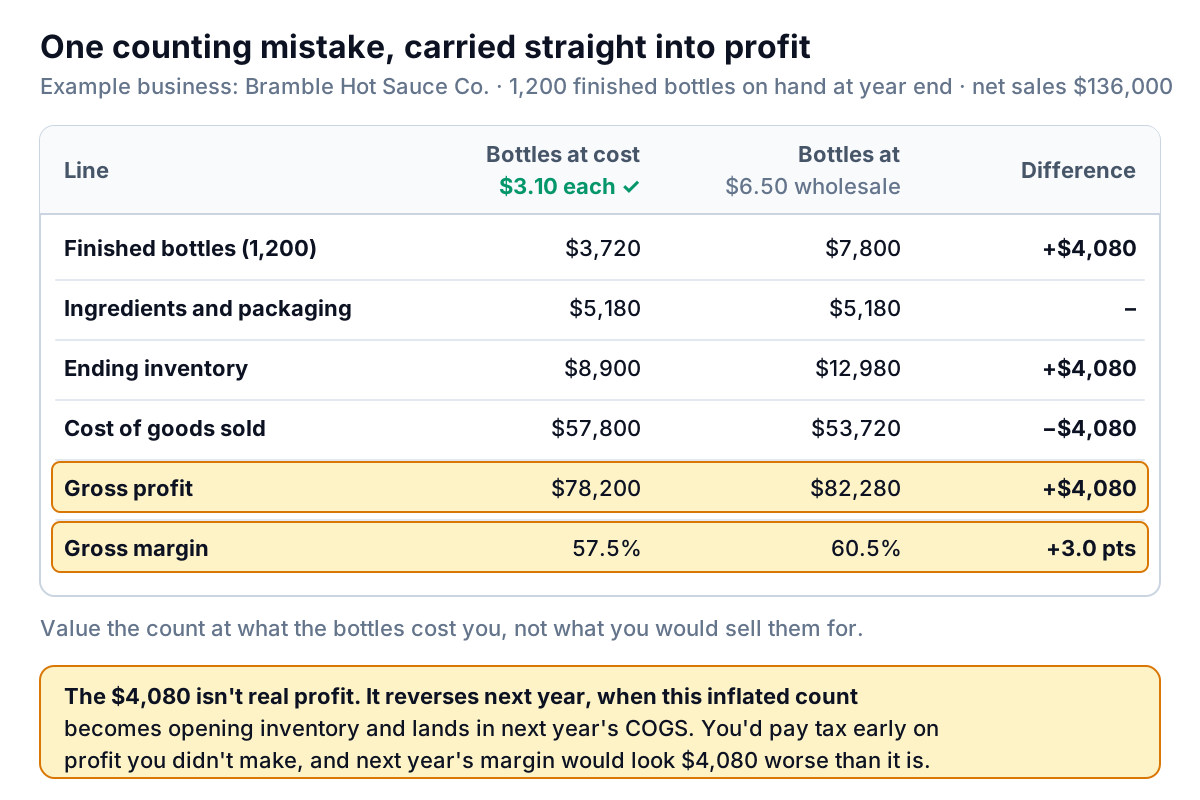
If Bramble's owner had multiplied the 1,200 bottles by the $6.50 wholesale price, ending inventory would be $12,980, cost of goods sold $53,720, and gross margin 60.5% instead of 57.5%. The error also doesn't stay put. That inflated count becomes next year's beginning inventory, so next year's cost of goods sold is $4,080 too high and the margin looks worse than it is. Two years of misleading numbers from one evening with a clipboard.
The fix is to know your cost per unit. Bramble's comes from its most recent batch: ingredients $1.05, bottle and cap $0.85, label $0.25, freight-in $0.10, production labor $0.65 and kitchen time $0.20, a total of $3.10 a bottle. When ingredient prices change, the cost of the next batch changes, which raises the question of which cost applies to the bottles still on the shelf.
FIFO, average cost and why software picks for you
When identical items were bought at different prices, you need a rule for which cost goes to the ones you sold. The Schedule C instructions say inventory can be valued at cost, at the lower of cost or market, or by another method the IRS approves. The common cost rules are first in, first out (FIFO), where the oldest costs go out first, and weighted average cost, where every unit carries the running average.
Your accounting software usually decides this when you turn on inventory tracking. QuickBooks Online offers FIFO or moving average cost, and Intuit warns that the choice can't be changed later; if you create inventory items before choosing, it defaults to FIFO. Xero's tracked inventory uses average cost to work out cost of goods sold and the value of what's left. Talk to your accountant before you pick, because changing an inventory method for tax generally means filing Form 3115.
Getting the inputs from QuickBooks, Xero or a spreadsheet
How you get each number depends on how you track inventory.
If your software tracks inventory items (QuickBooks Online inventory or Xero tracked items), it posts cost of goods sold every time you record a sale, using the FIFO or average cost. You still need a physical count at least once a year, then an inventory adjustment for the difference between what the software thinks is there and what is. If the adjustment is large, find out why before you file: unrecorded spoilage, samples handed out, or purchases entered as expenses.
If you don't track items in software, your purchases probably sit in an expense or "cost of goods sold" account, and the books never show inventory changes. That's the periodic method, and the formula is how you finish the job:
- Pull the year's totals for each purchase, freight-in and production wage account from your profit and loss report. Our QuickBooks reports guide shows where these live.
- Take beginning inventory from last year's balance sheet or tax return. It should equal last year's ending count.
- Count everything on the last day of the period. Write down quantities first and costs afterwards, so nobody rounds a count to make it look right.
- Price the count at cost, using recent supplier invoices or your batch costing.
- Run the formula, then post one adjusting entry so the balance sheet shows the new inventory figure.
In a spreadsheet, keep one row per item with columns for quantity, unit cost and extended value (quantity × unit cost), and a summary cell that applies the formula: =Beginning + Purchases + Labor + Other − SUM(EndingValues). Keep last year's sheet. It's your beginning inventory.
Monthly cost of goods sold without a monthly count
Counting every month is the accurate route, and plenty of small producers don't have the hours. A common shortcut is to estimate monthly cost of goods sold from your gross margin (Bramble would use 57.5%), then true it up when you do count. Be careful with that shortcut: the estimate hides exactly the problems you'd want to see, like a jump in pepper prices. If you go that way, count at least quarterly, and look at the size of each true-up. A true-up that's always in the same direction means your assumed margin is wrong.
The tax side, briefly (and hedged)
This is general information, not tax advice. The rules depend on your business and change with inflation each year, so check with your accountant.
- Small business taxpayers can choose not to keep an inventory. The 2025 Schedule C instructions define a small business taxpayer as one with average annual gross receipts of $31 million or less over the three prior tax years that isn't a tax shelter. Such a business can treat inventory as non-incidental materials and supplies, deducted in the year they're first used or consumed, or follow the treatment in its financial accounting books.
- The threshold moves. For tax years beginning in 2026, Revenue Procedure 2025-32 sets the gross receipts test at $32 million.
- Opening must match closing. Schedule C asks you to explain any difference between this year's beginning inventory and last year's ending inventory.
- Changing methods takes paperwork. Switching how you account for inventory generally means filing Form 3115, according to the same instructions.
Even if you take the simpler tax route, keep counting for your own sake. Without a count, you know what you spent on ingredients, not what the sauce you sold cost you, and your margin is a guess.
When cost of goods sold moves
Look at cost of goods sold as a percentage of net sales, not in dollars. Dollars rise whenever you sell more. The percentage only moves when something about cost or price changes. When it jumps, check these in order:
- The count. Was ending inventory valued at cost, and did it include everything? A missed pallet of bottles shows up as a cost spike.
- Purchase timing. Under the periodic method, a big order of glass in December raises purchases. That's fine if it's also in the ending count. If it isn't, cost of goods sold is overstated.
- Input prices. Compare unit costs on the last few supplier invoices with the batch costing you use.
- Mix. If wholesale grew faster than direct sales, the cost percentage rises even though nothing got more expensive, because wholesale prices are lower.
- Shrinkage. Broken bottles, spoiled batches and samples come out of inventory without a sale. Record them so they don't hide in the count.
A monthly view makes these patterns obvious. Plot cost of goods sold as a percentage of sales by month, with purchases on the same chart, and a spike from a December glass order is easy to tell apart from a real cost increase. Our inventory dashboard guide covers the stock side of that view, and the financial dashboard guide shows where gross margin sits among the other numbers.
Parity can build that view for you. Connect QuickBooks Online, Shopify or Square, or upload a CSV or Excel export from any other tool, and it builds a dashboard with headline numbers and their trends, charts, what explains them, and a table of what needs attention. Every number is checked against queries on the full dataset before you see it. Ask it in chat to show cost of goods sold as a percentage of sales by month, and update it with next month's file.
Turn your sales and purchases into a checked dashboard that shows when cost of goods sold moves and what drove it. Build a report from your data free
Whatever tool you use, the cost of goods sold formula stays the same: start with what you had, add what you bought and made, and subtract an honest count at cost. Get the count right and the rest of the formula is arithmetic.