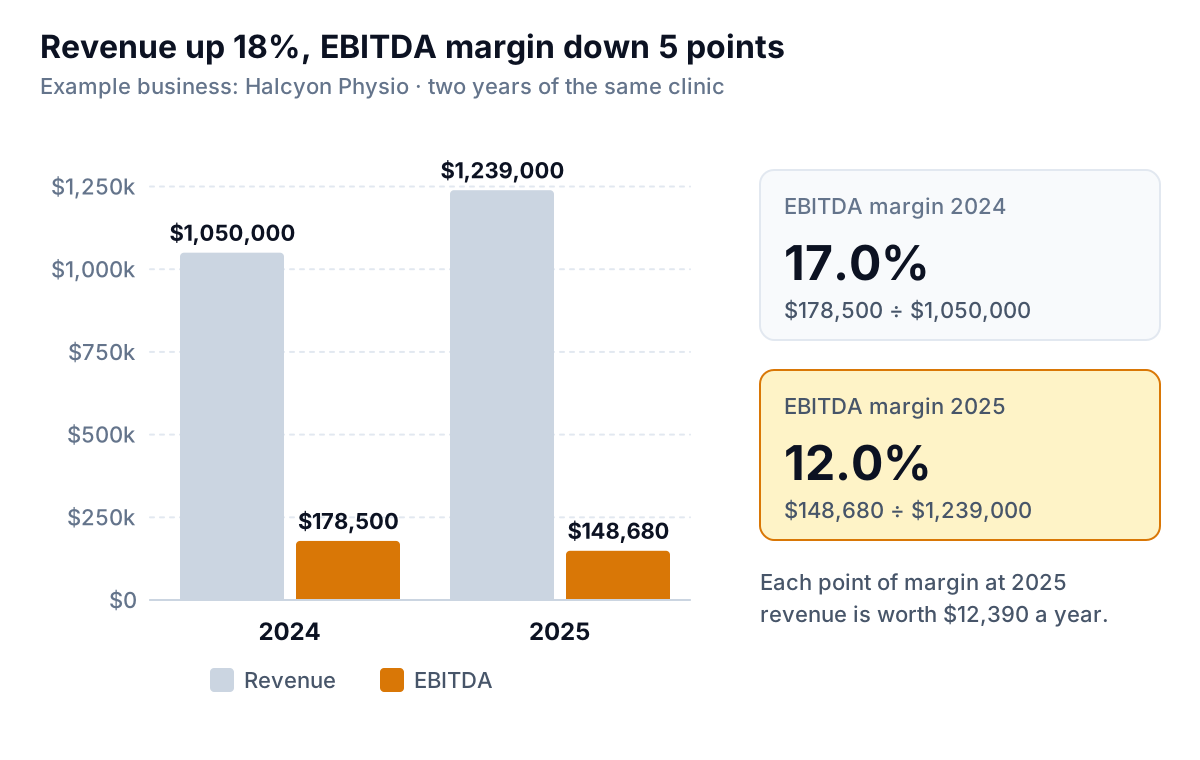
Halcyon Physio, an example clinic we'll follow through this guide, had its best year ever in 2025. Visits rose from 10,000 to 11,800, revenue grew 18% to $1,239,000, and two new physiotherapists joined. Yet the clinic kept less money than the year before: EBITDA fell from $178,500 to $148,680, and the EBITDA margin dropped from 17.0% to 12.0%.
The owner's first guess was that rent had gone up. Rent did go up, but it explains half a point of the five. This guide shows how to calculate EBITDA margin, how to find the line that actually moved it, how to compare it fairly, and which levers bring it back.
The EBITDA margin formula
EBITDA margin is EBITDA divided by revenue, shown as a percentage. It tells you how many cents of each dollar of revenue are left after running the business, before interest, income tax, depreciation and amortization.
EBITDA margin = EBITDA ÷ revenue × 100
And EBITDA itself is net income with interest, taxes, depreciation and amortization added back, or operating income with depreciation and amortization added back. If that's new, start with our guide to what EBITDA is and how to calculate it.
For Halcyon in 2025: $148,680 ÷ $1,239,000 = 12.0%. Twelve cents of every dollar patients and insurers paid was left over after clinician pay, front desk, rent, software, marketing, supplies and insurance. In 2024 it was 17 cents.
Here are both years laid out with every cost as a share of revenue. This is the table you need to explain any change in margin, and it takes ten minutes to build from two P&L reports.
| Example: Halcyon Physio | 2024 | % of revenue | 2025 | % of revenue |
|---|---|---|---|---|
| Revenue (visits × average fee) | $1,050,000 | 100% | $1,239,000 | 100% |
| Clinician pay | $504,000 | 48.0% | $644,280 | 52.0% |
| Front desk and admin | $105,000 | 10.0% | $130,000 | 10.5% |
| Rent | $96,000 | 9.1% | $120,000 | 9.7% |
| Practice software and billing | $42,000 | 4.0% | $49,560 | 4.0% |
| Marketing | $31,500 | 3.0% | $49,560 | 4.0% |
| Clinical supplies | $21,000 | 2.0% | $24,780 | 2.0% |
| Insurance and other | $72,000 | 6.9% | $72,140 | 5.8% |
| EBITDA | $178,500 | 17.0% | $148,680 | 12.0% |
Below EBITDA, Halcyon also had $31,000 of depreciation on treatment tables and equipment and $9,000 of loan interest. As an LLC taxed as a pass-through, it pays no income tax at the business level, so net income was $108,680, a net margin of 8.8%. That's the number the owner takes home before personal tax. The EBITDA margin is the one that tells you how well the clinic runs.
Finding what moved the margin
When a margin changes, don't stare at the dollar columns. Dollars rise with growth whether or not anything is wrong. Compare each cost as a percentage of revenue across the two years. A line whose share went up is eating margin; a line whose share went down is giving it back. The changes add up exactly to the change in margin.
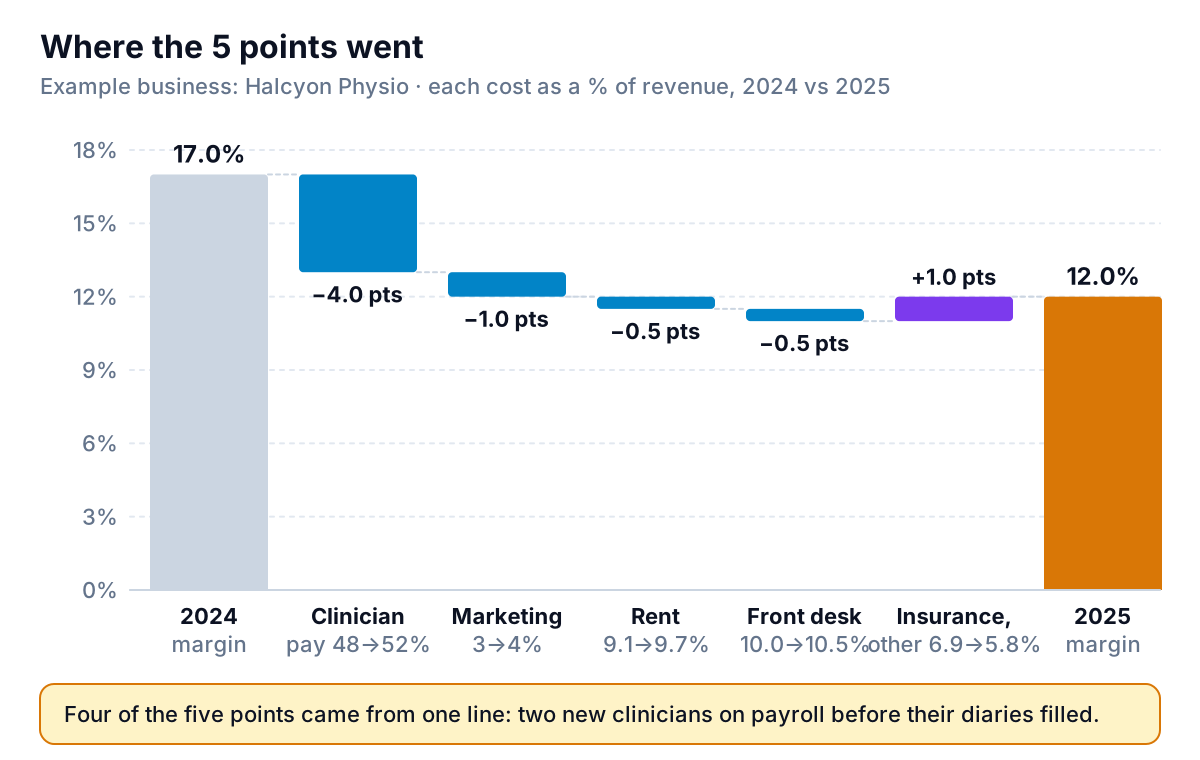
Halcyon's answer is clear. Clinician pay went from 48% to 52% of revenue, which is four of the five points. The owner hired one physio in March and another in July, ahead of demand, and both spent months with half-empty diaries while drawing full salaries. Marketing took another point, spent to fill those diaries. Rent and front desk took half a point each, and insurance and other costs gave a point back because they barely grew.
Each point of margin is worth $12,390 a year at Halcyon's 2025 revenue. The diary problem alone cost about $50,000.
Comparing EBITDA margins fairly
With yourself: use twelve months, not one
A single month's margin swings with holidays, a big annual bill, payroll timing and how many working days the month had. Halcyon's monthly EBITDA margin ran from 15.5% in February to 5.5% in August, in a year that averaged 12.0%.
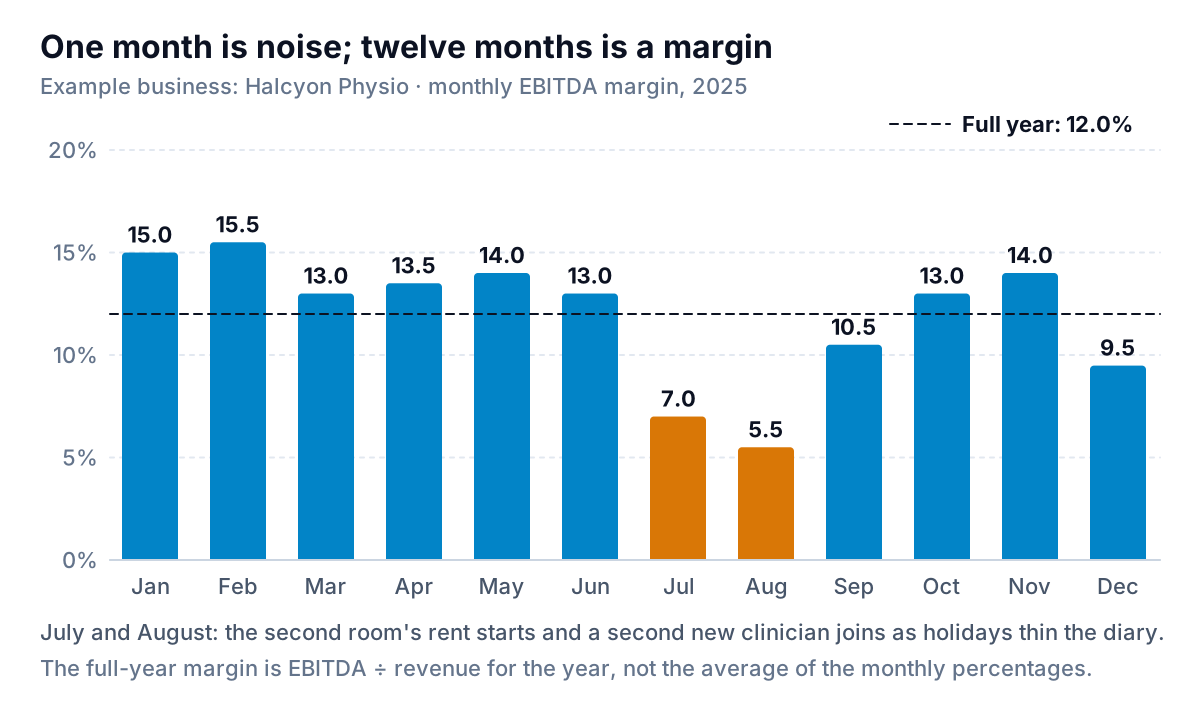
So track a trailing twelve-month margin: total EBITDA for the last twelve months divided by total revenue for the same twelve months, updated every month. It moves slowly, which is the point. If it falls for three months in a row, something real has changed. Note that the full-year margin is twelve months of EBITDA divided by twelve months of revenue, not the average of twelve monthly percentages; the two drift apart when revenue is uneven.
With other businesses: carefully
Published EBITDA margins mostly come from public companies. Aswath Damodaran at NYU Stern publishes margins by industry for US-listed firms; his January 2026 data puts EBITDA/sales at 16.6% for the whole market, 15.8% for hospitals and healthcare facilities and 3.9% for healthcare support services. Those are large companies with different cost structures, so they show how widely margins vary between industries, not what a ten-room clinic should earn.
If you do compare with a peer, or a buyer compares you, three differences distort EBITDA margins more than anything else:
- Owner pay. An owner who takes a modest salary and the rest as distributions shows a higher EBITDA margin than one who pays themselves a full market salary. Put a market-rate salary in before comparing.
- Owning vs renting. A clinic that owns its building has no rent; its building cost shows up as depreciation and interest, which EBITDA leaves out. Its margin will look several points better than a tenant's for that reason alone.
- Revenue mix. Cash-pay patients, insurance plans and workers' compensation pay different rates for similar visits. Two clinics with identical costs can have very different margins because of who pays.
Reported vs adjusted EBITDA margin
Adjusted EBITDA adds back costs the owner argues won't recur. Halcyon paid $14,000 in recruiter fees to hire its two new physios. Add that back and EBITDA becomes $162,680, an adjusted margin of 13.1% instead of 12.0%.
Is that fair? Only if the clinic genuinely won't recruit again. A growing clinic will, so a careful buyer or lender would leave it in. Public companies have to label any figure that departs from the standard calculation and reconcile it to net income; the SEC's staff say measures calculated differently should not be called EBITDA. You aren't bound by those rules, but follow the spirit: show the reported margin first, list each adjustment with its amount and reason, and never present only the adjusted number.
What moves an EBITDA margin, and how much
A service business has three levers: how full the capacity you pay for is, what each unit of work earns, and what the fixed costs are. Here is what each would do for Halcyon, starting from 2025's 12.0%.
| Lever (example figures) | Change to EBITDA | New EBITDA margin |
|---|---|---|
| New physios fill 1,200 more visits a year at $105, with no new hires (software and supplies rise 6% of the extra revenue) | +$118,440 | 19.6% |
| Average fee rises from $105 to $110 on the same 11,800 visits | +$55,460 | 15.7% |
| Marketing back to 3% of revenue once diaries are full | +$12,390 | 13.0% |
The first row is why a clinic's margin is so sensitive to utilisation. Clinician pay is the biggest cost, and it's mostly fixed once someone is on payroll. Each extra visit by a salaried physio drops almost all of its fee to EBITDA. The same arithmetic runs in reverse when a diary empties, which is what happened in 2025.
Price is the second lever, and often the hardest. Insurance and workers' compensation rates are usually set by contract, so for many clinics only cash-pay fees and package prices are in the owner's control. Check your payer contracts, and talk to your accountant or a practice management adviser before changing fees.
Turn those levers into a monthly routine:
- Track booked hours as a share of available hours for each clinician, every week. It is the early warning for the margin.
- Hire when existing clinicians are consistently full, not when revenue is up.
- Give each new fixed cost (a room, a hire, a campaign) a margin target and a date. If the trailing twelve-month margin isn't back by then, revisit it.
A budget vs actual review each month catches cost lines drifting before they show up in the annual margin.
Mistakes that make the margin lie
- Celebrating revenue growth on its own. Halcyon's 18% growth hid a five-point margin fall. Put revenue and EBITDA margin side by side on the same page, every month.
- Counting money you haven't earned yet. If patients prepay for a package of ten sessions, the revenue belongs to the months the sessions happen. Booking it all when the cash arrives inflates one month's margin and starves the next.
- Leaving out owner pay because it's "drawings". If you work in the clinic full time and take no salary, your EBITDA margin includes your unpaid labour. Fine for your own records, misleading for anyone comparing.
- Calling a margin "good" from a rule of thumb. Margins differ by industry, size and ownership, so a figure from an article tells you little. Your own trailing twelve-month trend, and the cost lines behind it, tell you a lot.
Getting the numbers every month
Everything above comes from your profit and loss statement. In QuickBooks Online, the Profit and Loss Comparison report puts this year next to last year, and ticking % of income under Customize > Rows/Columns shows each line as a share of revenue. In Xero or a spreadsheet, export the P&L by month, add up the last twelve months, and divide each line by revenue. Add back depreciation, amortization and interest, which are often under "Other expenses", and check whether your accountant books depreciation monthly or only at year end.
Parity builds the monthly view for you. Connect QuickBooks Online, or upload a P&L export from Xero or any other accounting tool, and it builds a dashboard with EBITDA margin and its trend, charts of each cost as a share of revenue, what explains the change, and a table of the lines that need attention. Every number is checked against queries on the full dataset before you see it. Refine it by chat ("show trailing twelve months", "add back the recruiter fees as a separate adjusted line"), update it with next month's export, and share a read-only link with your accountant. When you need the quarterly write-up for a partner or lender, ask it to write the report from the same data; our monthly report template shows what a good one covers.
Upload your P&L and get a checked dashboard of your EBITDA margin, cost lines as a share of revenue and the trend. Build a report from your data free
An EBITDA margin on its own is just a percentage. Put it next to last year's, break the gap into cost lines, and it tells you exactly which decision to look at again. For Halcyon, that decision wasn't the lease. It was hiring two physios before the diaries were ready for them.