Bluebell Ice Cream, an example shop we'll follow in this guide, sells more in a single July week than in the whole of January. Its owner once set a sales target the simple way: last year's total plus 8%, divided by twelve. By March she was "behind" by thousands of dollars and worried. By August she was "ahead" and hiring. Neither feeling was true. The plan simply didn't have the shape of the business.
This guide shows how to create a sales forecast that does: built from your own monthly history, shaped by your seasons, cross-checked from the bottom up, and compared with actual sales every month so you know when to change it. It uses Bluebell's numbers throughout, and every step works in Excel or Google Sheets.
What a small business sales forecast is for
A sales forecast is your best estimate of what you'll sell each month over the next year. It isn't a target, and it isn't a wish. Everything else in your planning hangs off it: how much stock to order, how many staff to roster, when cash will be tight, whether you can afford the new freezer in April or should wait until June. If you're building a cash flow forecast, the sales forecast is its first line.
Before you work out how to create a sales forecast for your own business, make three choices:
- Period: monthly for the next 12 months suits most small businesses. The SBA's business plan guidance asks for quarterly or even monthly projections for the first year.
- Level of detail: one line per revenue stream that behaves differently. Bluebell has one main stream, shop sales, so this guide forecasts that. If you also do wholesale or events, give each its own line.
- Match your books: use the same revenue lines as your accounting software, so you can compare forecast with actual later without re-sorting anything. That's one of the SBA's tips on sales forecasting, along with reviewing the forecast against actuals every month.
How to create a sales forecast in seven steps
Step 1: Gather at least two years of monthly sales
Pull monthly revenue for the last two or three full years. A profit and loss report with a column per month from QuickBooks or Xero gives you this, as does a monthly sales summary from your till or ecommerce platform. Our QuickBooks reports guide covers which report to use. Lay it out with months in rows and years in columns.
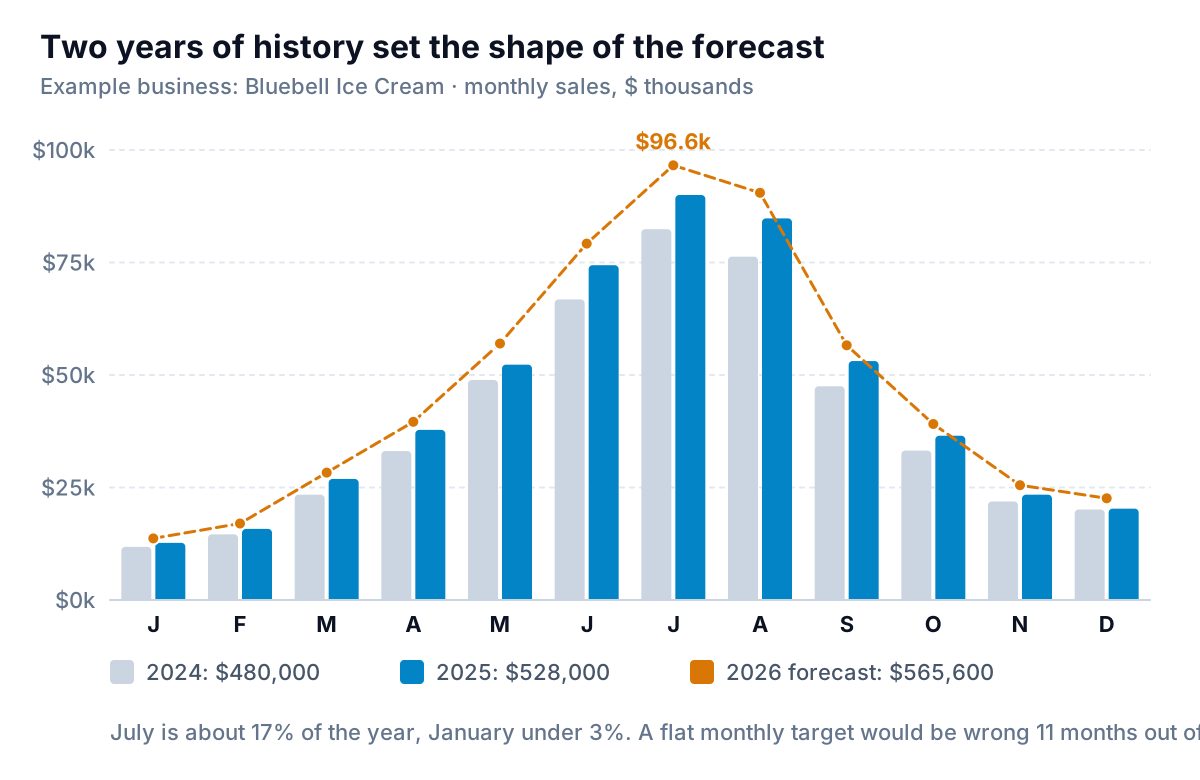
Bluebell's history: $480,000 in 2024 and $528,000 in 2025, up 10%.
Step 2: Take out anything that won't repeat
Look for one-off spikes and gaps: a big one-time order, a month you were closed for a refit, a price change partway through the year. Adjust them to what a normal month would have looked like, and write down what you changed. Bluebell's history is clean, apart from knowing that its 2025 growth came from two sources: prices went up about 6% in March 2025, and customer numbers grew about 4%.
Step 3: Work out the seasonal pattern
For each year, divide each month's sales by that year's total. That's the month's share of the year. Average the shares across years, then multiply by 12 to get a seasonal index, where 1.00 means an average month.
| Month | 2024 | 2025 | Average share | Index |
|---|---|---|---|---|
| Jan | $11,800 | $12,700 | 2.4% | 0.29 |
| Feb | $14,600 | $15,800 | 3.0% | 0.36 |
| Mar | $23,400 | $26,900 | 5.0% | 0.60 |
| Apr | $33,100 | $37,800 | 7.0% | 0.84 |
| May | $48,900 | $52,300 | 10.1% | 1.21 |
| Jun | $66,800 | $74,400 | 14.0% | 1.68 |
| Jul | $82,400 | $90,000 | 17.1% | 2.05 |
| Aug | $76,300 | $84,800 | 16.0% | 1.92 |
| Sep | $47,500 | $53,100 | 10.0% | 1.20 |
| Oct | $33,200 | $36,500 | 6.9% | 0.83 |
| Nov | $21,900 | $23,400 | 4.5% | 0.54 |
| Dec | $20,100 | $20,300 | 4.0% | 0.48 |
| Total | $480,000 | $528,000 | 100% | 12.00 |
With 2024 sales in B2:B13 and 2025 in C2:C13, the index in E2 is =AVERAGE(B2/SUM(B$2:B$13),C2/SUM(C$2:C$13))*12, filled down. July's index of 2.05 means July sells about twice an average month. January sells less than a third.
Using shares rather than raw dollars matters. If you average the dollar amounts, growth between the years gets mixed into the seasonal pattern.
Step 4: Set the annual number from its drivers
Don't pick a growth rate out of the air. Split it into price and volume, because you control them differently:
- Price: Bluebell plans a 4% price rise for 2026 to cover dairy and wage costs.
- Volume: last year's 4% growth in customer numbers came partly from a new housing estate nearby. The owner expects that effect to fade, so she assumes 3%.
The base case is $528,000 × 1.04 × 1.03 = $565,594, call it $565,600. That's 7.1% growth, less than last year's 10%, because last year included a bigger price rise.
Step 5: Spread the year by the index
Each month's forecast is the annual figure ÷ 12 × that month's index. For July: $565,600 ÷ 12 = $47,133, × 2.05 = $96,623, rounded to $96,600. In the sheet: =$H$1/12*E2, where H1 holds the annual forecast. Bluebell's 12 rounded months add up to $565,700, $100 more than the annual figure because of rounding. That doesn't matter, but check that your months add back to roughly your annual figure, because a mistake in the index usually shows up here first.
Step 6: Check the big months from the bottom up
Everything so far has worked from the year down. Now check the months that matter most, here June to August, from the customer up: how many transactions, at what average spend.
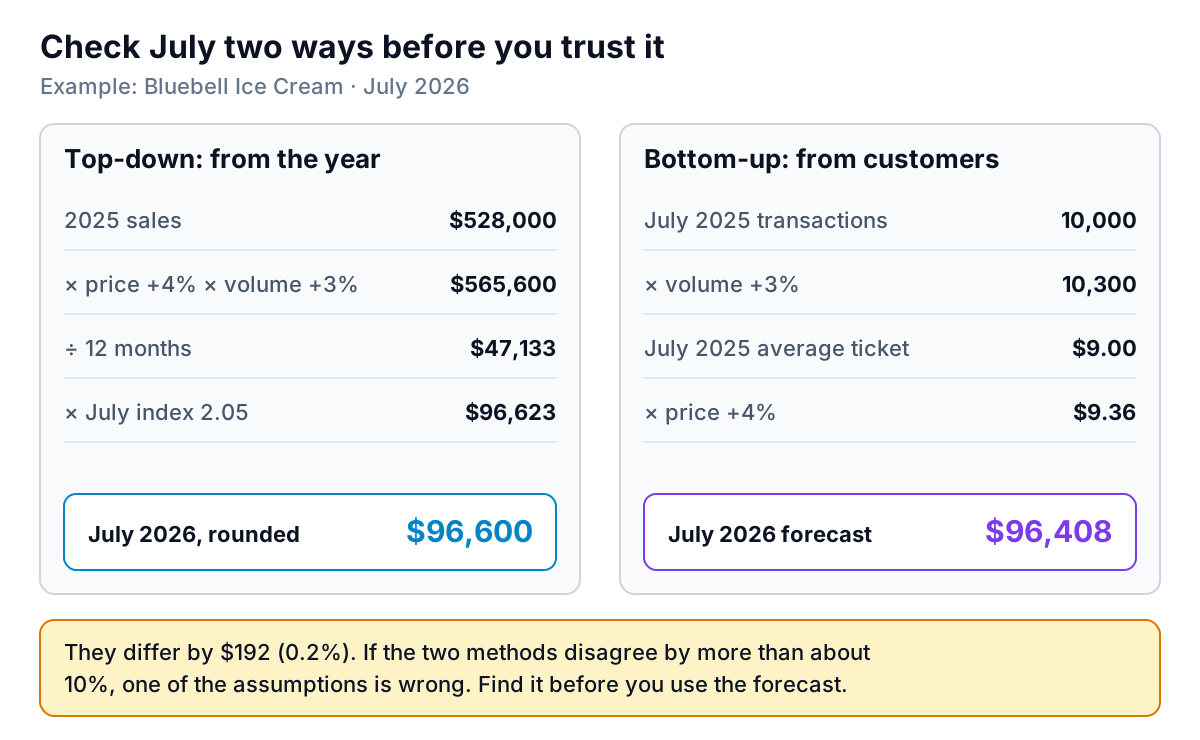
Last July, Bluebell's till recorded 10,000 transactions at an average of $9.00. With 3% more transactions and a 4% higher ticket, that's 10,300 × $9.36 = $96,408. The top-down figure is $96,600. They agree within 0.2%, which is what you'd expect, since both use the same assumptions. The bottom-up version earns its place by making you ask physical questions. Can the shop serve 10,300 people in July, about 330 a day, and many more on hot Saturdays? Is there enough freezer space for the stock that implies? Are there enough staff on the roster?
The phrase "top-down" is also used for a different method: estimate the size of the local market, then assume a share of it. That's useful for a new business with no history, but for an existing shop your own sales history beats any market estimate. If you're starting from scratch, build the bottom-up version first (opening hours × customers per hour × average spend) and treat it as a range rather than a single number.
Step 7: Add a low and a high case
One number gives a false sense of certainty. Ice cream sales depend on the weather more than on anything the owner does. So Bluebell keeps the 4% price rise in all three cases and varies volume:
| Case | Volume assumption | 2026 sales | What it's for |
|---|---|---|---|
| Low | −5% (cool, wet summer) | $521,664 | Cash planning: can we still pay everything? |
| Base | +3% | $565,594 | Stock orders, rosters, the budget |
| High | +8% (long hot summer) | $593,050 | Capacity: staff, freezer space, supplier limits |
Plan spending on the base case, make sure the low case doesn't run you out of cash, and make sure the high case doesn't run you out of stock.
Letting Excel find the pattern
Excel can build a statistical forecast for you. Select your dates and sales, then go to Data > Forecast Sheet. Microsoft's guide to creating a forecast in Excel says it detects seasonality automatically, draws a 95% confidence interval by default, needs dates at consistent intervals, and can fill gaps if up to 30% of points are missing. It's available in Excel for Microsoft 365, Excel 2024 and Excel 2021.
It's a good second opinion. Its limit is that it knows only your history. It can't know about next year's price rise, the new café opening down the road, or the fact that 2025's growth came from a housing estate that's now finished. Use it to check your seasonal shape, then apply your own judgement on the annual number.
Check the forecast against actual sales every month
A forecast you never compare with reality is just a guess with formatting. Once a month, after your books are closed, add the actual figure next to the forecast and calculate two variances: the month, and the year to date.
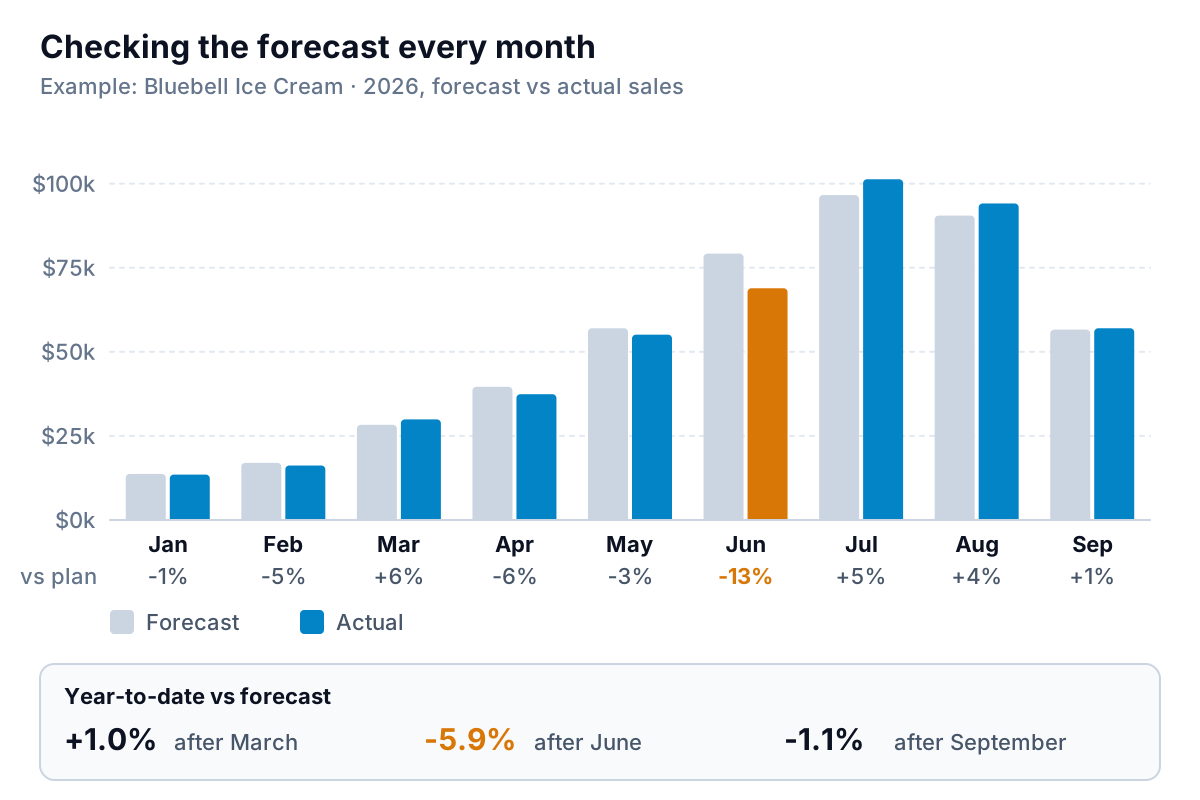
June 2026 was cold and wet, and sales came in 13% under forecast. After June, Bluebell was 5.9% behind for the year. The tempting response is to cut the rest of the year's forecast by 6%, cancel a stock order and trim the summer roster. The owner didn't, because the cause was weather, and weather doesn't carry over. July and August beat the forecast by 5% and 4%. By the end of September the year-to-date gap was 1.1%.
Some simple rules for when to change a forecast:
- Explain every month that misses by more than 10%. Write the reason next to it: weather, a closure, a big one-off order, a price change.
- Don't change the forecast for causes that reverse. Weather, timing (Easter in March one year and April the next) and one-off events wash out.
- Do change it for causes that persist. A competitor opening, losing a wholesale customer, a price rise that customers resisted. Re-forecast the remaining months from the new level.
- Re-forecast if the year-to-date gap stays beyond 5% for two months in a row, whatever the reason. At that point the original assumptions are no longer your best guess.
This monthly comparison is the same habit as a budget review, and it fits on the same page. Our budget vs actual guide shows the layout and how to read the variances.
Common mistakes when you create a sales forecast
- Dividing the year by 12. Fine for a business with no seasons. For most businesses it guarantees a false alarm every quarter.
- One year of history. A single year can't tell a seasonal pattern from one unusual month. Use two years at least, three if you have them.
- Growth as a single number. "Plus 10%" hides whether you're expecting more customers or higher prices. They need different plans.
- Forecasting gross when you account net. If your books record sales after discounts and refunds, forecast the same way, or the monthly comparison won't line up.
- Never updating it. The forecast you made in January is a starting point. By September you know a lot more.
Keeping it current without the spreadsheet chores
Once you know how to create a sales forecast this way, the work that remains is the monthly refresh: paste in the latest actuals, recalculate the variances and look at the chart. Parity can do that part. Connect QuickBooks Online, Square, Shopify or Stripe, or upload your sales history as a CSV or Excel file, and ask for what you need, for example "monthly sales for the last two years with a seasonal index, and 2026 forecast vs actual with year-to-date variance". It builds a dashboard with the headline numbers, charts and a table of the months that need attention, checks every number against queries on the full dataset, and updates when you add next month's file. You can export it to Excel to keep your own forecast columns alongside.
Bring in your sales history and get a checked month-by-month view of forecast, actual and year-to-date variance. Build a report from your data free
The point of a sales forecast isn't to be right. Bluebell's June was 13% wrong and nothing bad happened, because the owner had a low case, knew the cause, and didn't overreact. The point is to know, every month, how far reality has drifted from your plan and whether that drift is weather or something that will last.