Vantage IT Services, an example managed IT firm we'll use throughout this guide, closed 2025 with its best revenue per employee ever: $180,000 per full-time equivalent, up from $170,000 the year before. The owner was ready to tell the team it had been their most productive year. Then her accountant asked how much of that revenue was laptops and software licences bought from a distributor and sold on at a 15% markup.
Take those out and the same team produced 11% less per person than in 2024. The ratio hadn't lied, exactly. It had measured something the owner didn't mean to measure. This guide covers the formula, how to count employees so the number holds up, what the number can and can't tell a small firm, how to compare it with care, and what to do when it moves.
The revenue per employee formula
Revenue per employee = revenue for a period ÷ average number of full-time equivalent employees in that period
Use twelve months of revenue (a calendar year or the trailing twelve months), not a single month, so seasonal swings don't distort it. For the bottom half of the fraction, count full-time equivalents (FTEs) rather than people. Three part-timers and one full-timer are four people, but they may well be two FTEs.
For Vantage, the 2025 calculation is $2,205,000 of revenue ÷ 12.25 FTE = $180,000. Divide by the 14 people on the payroll at year end instead, and you get $157,500. Both are arithmetically right. Only one compares fairly with last year, and it's the FTE version.
Counting employees so the number means something
Most arguments about this metric are really arguments about the denominator. Here's how Vantage counted.
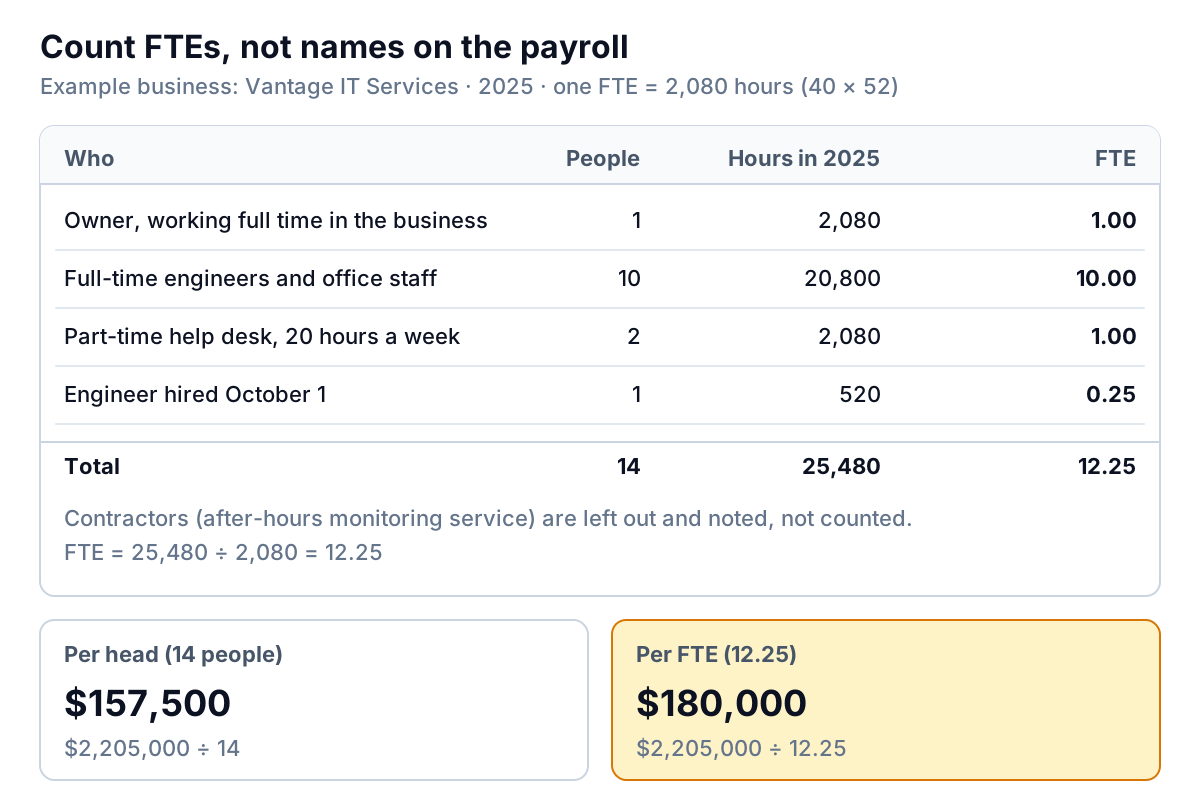
Decide these once, write them down, and use them every year:
- What one FTE is. Vantage uses 2,080 hours (40 hours × 52 weeks). If your full-time week is 37.5 hours, use 1,950. What matters is using the same base every year.
- Hours or headcount weighting. If you have hours from payroll, divide total hours by the FTE base. If you don't, weight each person by their usual schedule (a 20-hour-a-week role is 0.5) and by the part of the year they were employed (a hire on October 1 is 0.25).
- The owner. If you work full time in the business, count yourself. Leaving yourself out flatters the number, and it'll drop the day you hire someone to do your job.
- Contractors. Leave them out of the denominator, but note how much revenue depends on them. If you replace an employee with a contractor, the ratio rises with no real change in the business. Some firms also track a second version with contractor hours included as FTEs.
- Average, not year end. A team that grew from 10 to 14 during the year averaged about 12. Dividing a full year's revenue by the year-end headcount penalises you for hiring in December.
What revenue per employee tells a small firm, and what it hides
For a business where people are the product, such as IT services, agencies, accounting and trades, revenue per employee is a quick check on two things: whether your prices keep up with your payroll, and whether new hires are bringing in work or waiting for it. It's most useful as a trend in your own business, measured the same way every year.
It hides more than it shows when revenue includes things your team didn't really produce. For Vantage, that was resale.
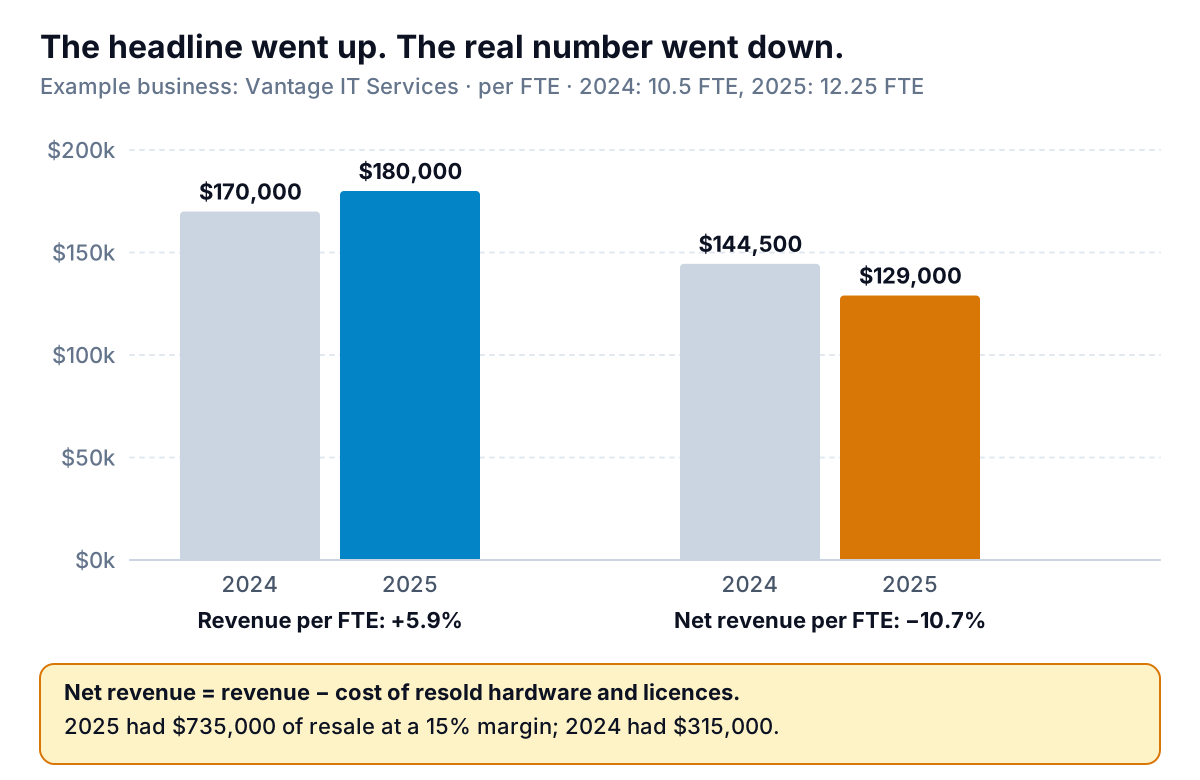
In 2025, Vantage resold $735,000 of hardware and licences, mostly a laptop refresh for one client, at a 15% margin. In 2024 it resold $315,000. The resale revenue needs very little staff time, so it lifts the ratio without saying anything about how productive the team was. The fix is a second version of the metric:
Net revenue per FTE = (revenue − cost of resold goods and pass-through costs) ÷ FTE
- 2024: ($1,785,000 − $267,750) ÷ 10.5 = $144,500
- 2025: ($2,205,000 − $624,750) ÷ 12.25 = $129,000
That's the number that fell 10.7%, and it's the one the owner should manage. It's the same idea as an agency excluding media spend, or a builder excluding subcontracted work it marks up and passes on.
Whether resale belongs in reported revenue in the first place is a separate, accounting question. Under ASC 606, a business that acts as an agent for another party's goods reports only its fee or commission as revenue, while one that acts as principal reports the full amount. Which side of that line your resale falls on depends on the facts, so ask your accountant. For a management metric, it's simplest to calculate both versions and watch the net one.
Comparing your number with other firms, carefully
The first thing most owners want to do is compare their number with "the industry". Be careful, for three reasons.
- Business models differ inside one industry. An IT firm that resells hardware and one that sells only managed services can share an industry code and have very different figures while being equally well run.
- Published figures count people differently. The US Census Bureau's Statistics of U.S. Businesses is one of the few public sources that has both receipts and employment by industry and firm size. Its employment figure is a headcount for the week of March 12, not FTEs, and receipts are only published for years ending in 2 and 7. Dividing one by the other gives a rough average across firms of every model, not a target.
- Public company figures are a different world. Rankings of large companies on this measure are dominated by scale, automation and outsourcing that a 12-person firm doesn't have.
The comparisons worth making are with yourself: this year against last, this quarter against the same quarter last year, and one service line against another. If you belong to a peer group or an industry association that publishes surveys of firms like yours, defined the same way, those are worth a look too. Check how they count employees and revenue before you compare.
Getting the inputs
Both halves of the formula are probably already in your systems.
- Revenue comes from your profit and loss report for the twelve months, in QuickBooks Online, Xero or whatever you use. If resale and services sit in separate income accounts, and resale costs in their own cost account, net revenue is a subtraction away. If they're mixed together, splitting them is worth doing before anything else. Our financial dashboard guide shows how to lay out income accounts so this split is visible every month.
- Hours come from your payroll provider's hours or earnings report for the same period. Use hours worked or hours paid consistently; hours paid includes holiday and sick time, which is usually what you want, because it reflects what each role costs.
- In a spreadsheet, keep one row per person with start date, end date, weekly hours and FTE for the period, then one cell for revenue, one for pass-through costs, and the two ratios. Update it each quarter.
When the number moves
Track the net version quarterly, annualized, so you see changes before the year is over.
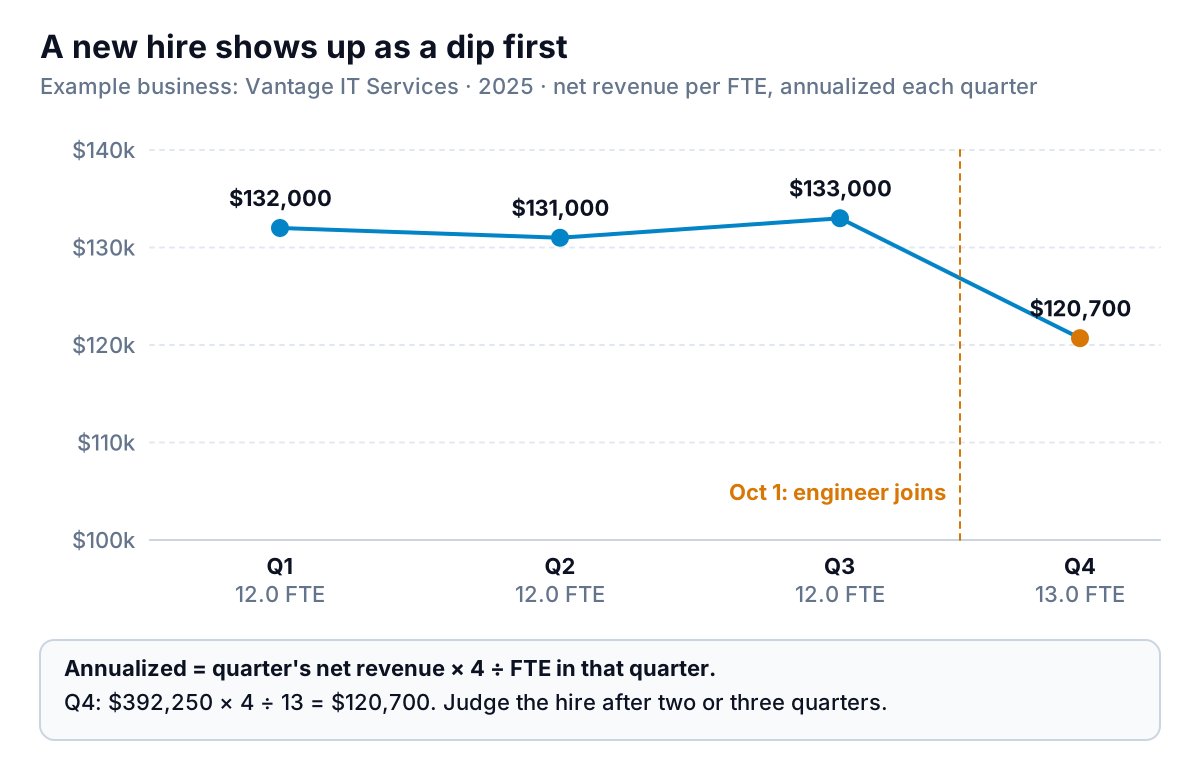
Here's how to read the common movements:
| What you see | Likely cause | What to do |
|---|---|---|
| Drop right after a hire | New person ramping up | Expected. Set a date, two or three quarters out, to check it has recovered |
| Slow decline over several quarters, no hires | Prices lagging wages, or more unbilled work | Review pricing and how much time goes to work you don't charge for |
| Headline rises, net version doesn't | More resale or pass-through revenue | Manage on the net version; check resale margins separately |
| Sharp rise with no change in prices | Team stretched, or work moved to contractors | Check overtime, response times and contractor spend before celebrating |
| Jump after one big project | One-off revenue | Look at trailing twelve months and the same quarter last year |
The last row matters more for small firms than big ones. At Vantage, resale was a third of the year's revenue, and most of it came from one client's laptop refresh. A single project can move the whole ratio, so read it next to a list of your largest jobs.
Turning it into decisions
The metric is most useful when it's tied to a hiring rule. Vantage's owner now uses one: before hiring, net revenue per FTE has to have been above $130,000 for two straight quarters, and the work queue has to justify another engineer. That threshold is her own, set from her margins and salaries, not an industry standard. Yours should come from the same place: what each FTE costs you fully loaded, and how much net revenue per FTE you need to cover that plus overheads and profit. A budget vs actual review is a good place to set that number and check it each quarter.
If you'd rather not rebuild the spreadsheet each quarter, Parity can do the dashboard. Connect QuickBooks Online, or upload a CSV or Excel export of your profit and loss and a staff hours list, and it builds headline numbers with their trends, charts, what explains them, and a table of what needs attention. Every number is checked against queries on the full dataset before you see it. Ask in chat for net revenue per FTE by quarter, with resale split out, and update it with next quarter's files. When a partner or investor wants the story, ask it to write the quarterly report from the same data. Our KPI dashboard guide covers what to put alongside it.
Turn your P&L and staff hours into a checked dashboard that shows revenue per FTE, with pass-through revenue split out. Build a report from your data free
The formula is one division. The work is in deciding what goes above and below the line, and sticking to it. Count FTEs, take out revenue your team didn't really earn, and compare yourself with last year. Then revenue per employee tells you what you actually wanted to know.