Charts like this, from your own numbers.
Connect a spreadsheet or the tools you run on, and Parity builds the dashboard and writes the report, with every number checked.
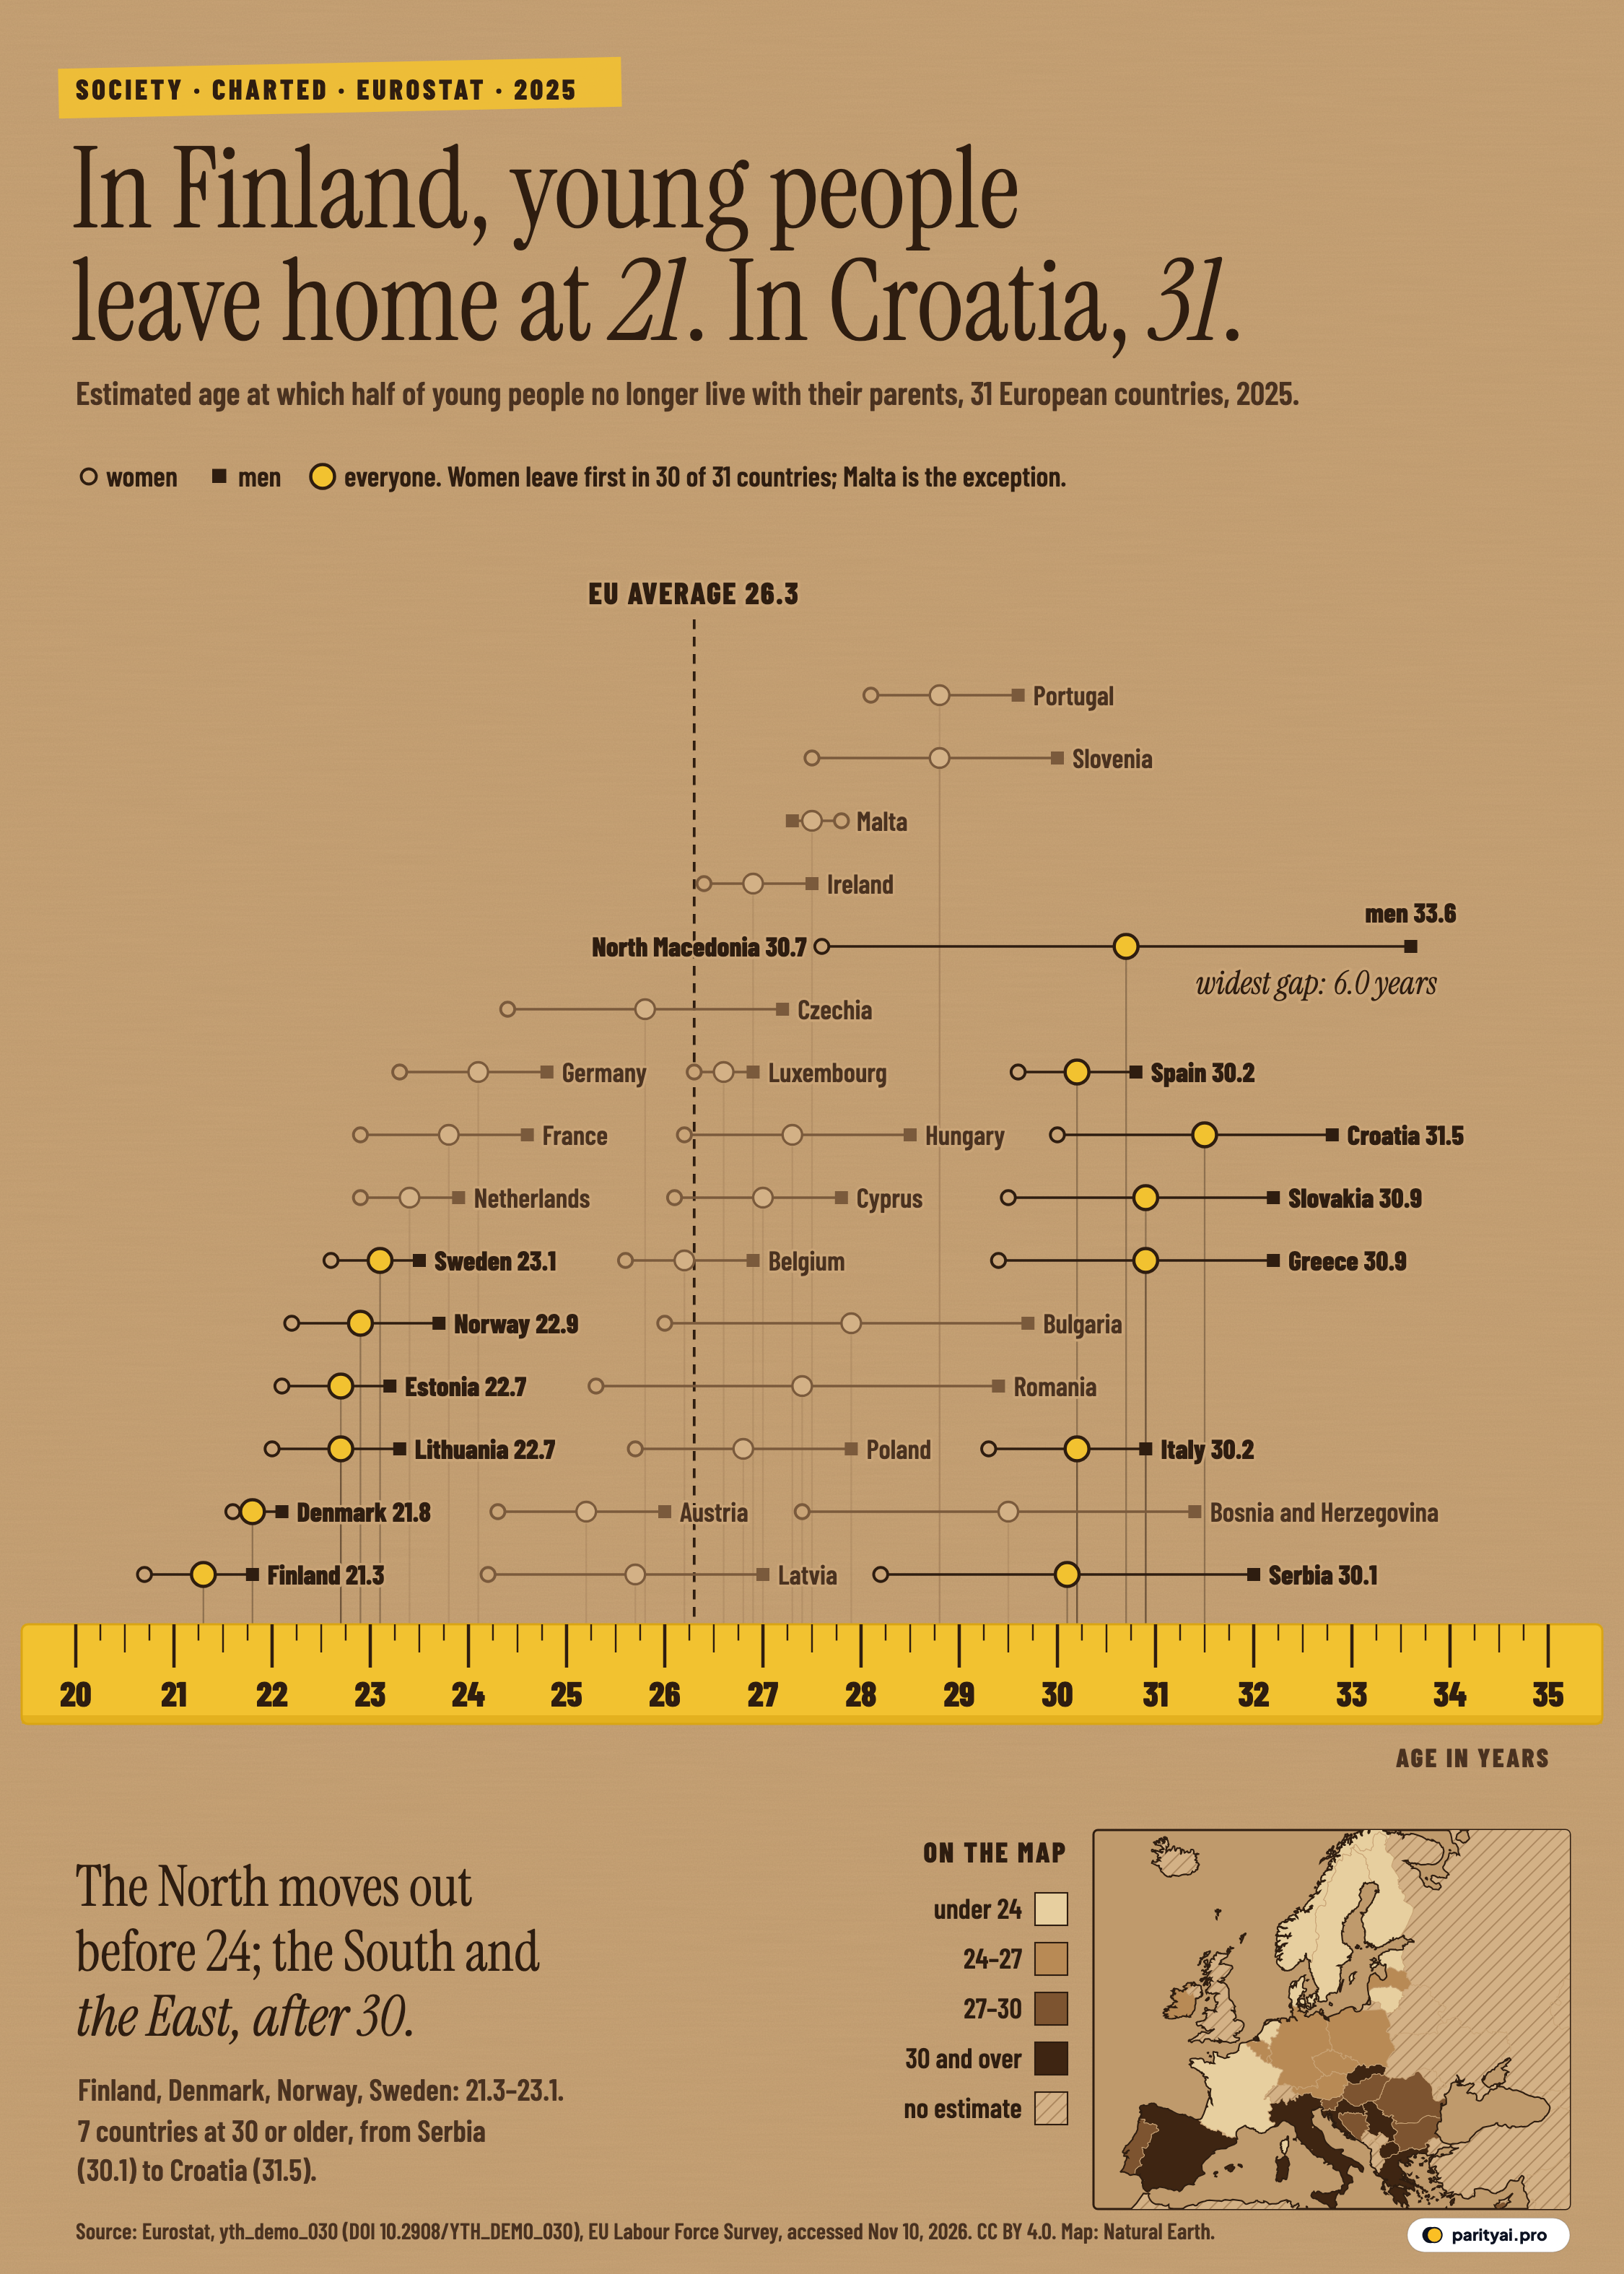
Try Parity freePull a tape measure out to 10.2 years and you have the distance between two European childhoods. At one end is Finland, where Eurostat estimates that young people had moved out of their parents' home by 21.3 in 2025. At the other is Croatia, where the same moment came at 31.5. Both countries are in the European Union, both are covered by the same survey, and both answer the same question. They are a decade apart.
The graphic above lays all 31 countries with a 2025 estimate along one ruler, from age 20 to 35. Each country is a small dumbbell. The open circle is the age at which women leave, the filled square is the age for men, and the larger dot between them is everyone together. Read any dot straight down to the yellow tape and you have the age. The countries are stacked only to stop them colliding; height means nothing. The dashed line is the EU-27 estimate, 26.3, and the small map in the corner shades each country by the same number so you can see where on the continent each end of the tape sits.
The figure comes from Eurostat's dataset yth_demo_030, built from the EU Labour Force Survey. Its own description is precise: it is "the age at which 50 % of the population no longer live in a household with their parent(s)". So "leaving home at 21" here means that by 21, half of Finns of that age have gone. It is a midpoint, not a rule.
The sections below walk the tape from left to right. Each heading is an age, and each section is about the countries that sit there.
| # | Country | Everyone | Women | Men | Men later by (years) |
|---|---|---|---|---|---|
| 1 | Finland | 20.7 | 21.8 | 1.1 | |
| 2 | Denmark | 21.6 | 22.1 | 0.5 | |
| 3 | Estonia | 22.1 | 23.2 | 1.1 | |
| 4 | Lithuania | 22.0 | 23.3 | 1.3 | |
| 5 | Norway | 22.2 | 23.7 | 1.5 | |
| 6 | Sweden | 22.6 | 23.5 | 0.9 | |
| 7 | Netherlands | 22.9 | 23.9 | 1.0 | |
| 8 | France | 22.9 | 24.6 | 1.7 | |
| 9 | Germany | 23.3 | 24.8 | 1.5 | |
| 10 | Austria | 24.3 | 26.0 | 1.7 | |
| 11 | Latvia | 24.2 | 27.0 | 2.8 | |
| 12 | Czechia | 24.4 | 27.2 | 2.8 | |
| 13 | Belgium | 25.6 | 26.9 | 1.3 | |
| 14 | Luxembourg | 26.3 | 26.9 | 0.6 | |
| 15 | Poland | 25.7 | 27.9 | 2.2 | |
| 16 | Ireland | 26.4 | 27.5 | 1.1 | |
| 17 | Cyprus | 26.1 | 27.8 | 1.7 | |
| 18 | Hungary | 26.2 | 28.5 | 2.3 | |
| 19 | Romania | 25.3 | 29.4 | 4.1 | |
| 20 | Malta | 27.8 | 27.3 | −0.5 | |
| 21 | Bulgaria | 26.0 | 29.7 | 3.7 | |
| 22 | Portugal | 28.1 | 29.6 | 1.5 | |
| 23 | Slovenia | 27.5 | 30.0 | 2.5 | |
| 24 | Bosnia and Herzegovina | 27.4 | 31.4 | 4.0 | |
| 25 | Serbia | 28.2 | 32.0 | 3.8 | |
| 26 | Italy | 29.3 | 30.9 | 1.6 | |
| 27 | Spain | 29.6 | 30.8 | 1.2 | |
| 28 | North Macedonia | 27.6 | 33.6 | 6.0 | |
| 29 | Greece | 29.4 | 32.2 | 2.8 | |
| 30 | Slovakia | 29.5 | 32.2 | 2.7 | |
| 31 | Croatia | 30.0 | 32.8 | 2.8 |
Estimated age at which half of young people no longer live with their parents (Eurostat, EU Labour Force Survey). EU-27 estimate: 26.3 (women 25.5, men 27.2). Highlighted: under 23 or 30 and over. Colour dot = the map's age band.
21
Two countries sit at the left edge of the tape on their own: Finland at 21.3 and Denmark at 21.8. Finnish women are the youngest movers on the whole chart, at 20.7; Finnish men follow at 21.8. Danish men and women are almost level, 22.1 against 21.6, a gap of 0.5 years, the narrowest of any country where men are the later group.
Eurostat's housing-conditions article shows how early this is. Among 20-to-24-year-olds, only 26.3% in Denmark and 22.3% in Finland lived with their parents or shared their household income. By 25 to 29 the shares fall to 5.4% in Denmark and 5.5% in Finland. A Eurofound report, as covered by Notes from Poland, put the share of 25-to-34-year-olds still at home in 2023 at 3% in both countries, the lowest in the EU.
Part of the setting is how support is paid. Finland's benefits agency Kela states that "your parents' income does not affect your student financial aid if you are 18 or over and live independently" (Kela), and for higher education that parents' income "cannot reduce the size of your study grant" (Kela). That does not prove why Finns leave early, but it shows a system built around the student as a separate household.
Leaving early is not the same as living easily. Eurostat notes that in countries where young people leave earlier, "such as Denmark, the Netherlands, Sweden, Germany and Finland", housing cost overburden among the young is higher. Moving out at 21 means paying rent at 21.
23
The next cluster is wider: Estonia and Lithuania at 22.7, Norway at 22.9, Sweden at 23.1 and the Netherlands at 23.4. Together with Finland and Denmark, that makes 8 countries below 24 once France (23.8) is added, and every Nordic country in the dataset sits in that group. The Nordic range runs from 21.3 to 23.1.
The interesting country here is Lithuania. It is the only country in this group that was not already there a few years ago. In 2021, Lithuanians left home at 25.2; by 2023 the figure was 24.1, and in 2025 it was 22.7. That is a fall of 2.5 years, and it came a little in every single year since 2021. Eurostat's 2025 article lists Estonia and Lithuania together among the four EU countries under 23.
Sweden moves the other way. Its estimate rose from 22.0 in 2021 to 23.1 in 2025, the largest increase on the chart (1.1 years). Norway also crept up, from 22.0 to 22.9. Both are still far below the EU line, but both drifted towards it.
Germany sits just past the 24 mark at 24.1, with men at 24.8 and women at 23.3.
26
The EU-27 estimate is 26.3: men 27.2, women 25.5. Around it sits the middle of the continent. Austria is at 25.2, Latvia 25.7, Czechia 25.8, Belgium 26.2, Luxembourg 26.6, Poland 26.8 and Ireland 26.9. Of the 31 countries, 13 are below the EU line and 18 above it. The EU figure is Eurostat's own estimate for the bloc as a whole, not an average of the dots, which is why it does not sit in the middle of them.
The EU number itself barely moves. Since the 2021 break in the series, it has gone from 26.6 to 26.3, and in every year since 2002 it has stayed between 26.1 and 26.8. Eurostat says the countries at both ends of the range "tend to remain stable over time". The middle is just as steady.
Poland is worth a closer look. Its estimate fell from 28.4 in 2021 to 26.8 in 2025, yet Eurofound found that 53% of Poles aged 25 to 34 still lived with their parents in 2023, behind only Croatia, Slovakia and Greece. The two figures measure different things: one is the age at which half of each age group has gone, the other is the share of a whole decade of adults still at home. A country can have a middle-of-the-road midpoint and a long tail of people who stay.
Ireland's estimate was 27.8 in 2021 and 26.9 in 2025. The longer story there is the 2010s: the share of Irish 25-to-34-year-olds living with their parents rose by "more than 6 percentage points" between 2010 and 2019, The Irish Times reported from Eurofound's work.
28
Past the EU line the dots begin to thicken. Cyprus is at 27.0, Hungary 27.3, Romania 27.4, Malta 27.5, Bulgaria 27.9, and Portugal and Slovenia both at 28.8.
Malta is the only country on the whole chart where the open circle sits to the right of the square. Maltese women leave home at 27.8 and men at 27.3, so women are the later group by 0.5 years. Everywhere else, in 30 of 31 countries, women go first.
Romania has the opposite shape. Its overall figure, 27.4, is close to the middle of this cluster, but it hides one of the longest dumbbells on the tape: women at 25.3, men at 29.4, a gap of 4.1 years, second only to North Macedonia. Romania also has the highest overcrowding rate among young people in the EU. Eurostat counts 60.4% of Romanians aged 15 to 29 living in overcrowded households, against 26.9% across the EU.
Bulgaria made the clearest move in this group. It sat at 30.0 in 2023 and dropped to 28.2 in 2024 and 27.9 in 2025. Portugal's record is harder to read. Its 2021 estimate, 33.3, stands far above the years either side (29.9 in 2020, 30.1 in 2022), so the 4.5-year fall since 2021 in the change table says more about that one figure than about a real shift. Look at the sparkline rather than the headline number.
| Country | 2021 | 2025 | Change (years) | 2021–2025 |
|---|---|---|---|---|
| Portugal | 33.3 | 28.8 | ▼ 4.5 | |
| Lithuania | 25.2 | 22.7 | ▼ 2.5 | |
| Bulgaria | 30.0 | 27.9 | ▼ 2.1 | |
| Croatia | 33.2 | 31.5 | ▼ 1.7 | |
| Poland | 28.4 | 26.8 | ▼ 1.6 | |
| Latvia | 26.6 | 25.7 | ▼ 0.9 | |
| Ireland | 27.8 | 26.9 | ▼ 0.9 | |
| Malta | 28.3 | 27.5 | ▼ 0.8 | |
| Slovenia | 29.6 | 28.8 | ▼ 0.8 | |
| Cyprus | 27.7 | 27.0 | ▼ 0.7 | |
| North Macedonia | 31.4 | 30.7 | ▼ 0.7 | |
| Romania | 28.0 | 27.4 | ▼ 0.6 | |
| Serbia | 30.6 | 30.1 | ▼ 0.5 | |
| Finland | 21.5 | 21.3 | ▼ 0.2 | |
| Luxembourg | 26.8 | 26.6 | ▼ 0.2 | |
| Austria | 25.3 | 25.2 | ▼ 0.1 | |
| Czechia | 25.9 | 25.8 | ▼ 0.1 | |
| Hungary | 27.4 | 27.3 | ▼ 0.1 | |
| Bosnia and Herzegovina | 29.6 | 29.5 | ▼ 0.1 | |
| Estonia | 22.7 | 22.7 | 0.0 | |
| Belgium | 26.2 | 26.2 | 0.0 | |
| Spain | 30.2 | 30.2 | 0.0 | |
| Slovakia | 30.9 | 30.9 | 0.0 | |
| Denmark | 21.7 | 21.8 | ▲ 0.1 | |
| Netherlands | 23.2 | 23.4 | ▲ 0.2 | |
| France | 23.6 | 23.8 | ▲ 0.2 | |
| Greece | 30.7 | 30.9 | ▲ 0.2 | |
| Germany | 23.8 | 24.1 | ▲ 0.3 | |
| Italy | 29.9 | 30.2 | ▲ 0.3 | |
| Norway | 22.0 | 22.9 | ▲ 0.9 | |
| Sweden | 22.0 | 23.1 | ▲ 1.1 |
Up (red) means young people leave later than in 2021. Earlier years are not compared because every series has a break in 2021.
30
Here the tape gets crowded. Bosnia and Herzegovina is just short at 29.5. Then come Serbia at 30.1, Italy and Spain at 30.2, North Macedonia at 30.7, and Greece and Slovakia at 30.9. With Croatia, that makes 7 countries where young people are 30 or older before half have left home.
Eurostat's 2025 article names the five EU members in this group: Croatia, Slovakia, Greece, Spain and Italy. The other two on the chart, Serbia and North Macedonia, are EU candidate countries that Eurostat also publishes figures for. The map shows where they are: Spain, Italy, Greece, Croatia and their Balkan neighbours are the darkest brown, with Slovakia as an island of dark brown further north.
Spain and Italy look alike from the ruler: both 30.2, both with narrow gaps (Spain 1.2 years, Italy 1.6). The Balkan countries do not. Serbia's women leave at 28.2 and its men at 32.0; Bosnia and Herzegovina's at 27.4 and 31.4. Greece and Slovakia sit in between, with gaps of 2.8 and 2.7 years.
The Eurofound figures for 2023 point the same way. In Slovakia 57% and in Greece 55% of 25-to-34-year-olds lived with their parents, according to the Notes from Poland report on that study.
31.5
Croatia is alone at the right-hand edge of the countries, at 31.5. Croatian women, at 30.0, are the oldest women on the chart, older than the men of most countries. Croatian men leave at 32.8.
Croatia has been at or near the top of this ranking for a long time. Its estimate was 33.2 in 2021 and 33.4 in 2022, before easing to 31.9 in 2023 and 31.5 now. Eurofound put the share of Croatians aged 25 to 34 living with their parents in 2023 at 64%, the highest in the EU. Eurostat's own explanation for gaps like this is cautious: it describes the spread between the two ends as "reflecting different practices regarding co-residence of generations in EU countries". It does not claim one cause, and neither should a single chart.
33.6
The furthest mark on the whole tape is not a country's average. It is North Macedonian men, at 33.6. North Macedonian women leave at 27.6, so the line between them stretches 6.0 years, the widest of any country. That single dumbbell crosses more of the ruler than the gap between Finland and Germany.
Gender gaps run through the whole chart. Across the EU, men leave 1.7 years later than women (27.2 against 25.5). In 13 countries the gap is two years or more; in 4 it is under one year. The widest are North Macedonia (6.0), Romania (4.1) and Bosnia and Herzegovina (4.0).
The gaps are not random. Across the 31 countries, the correlation between the overall age of leaving and the size of the gap is 0.54: where young people leave later, men tend to lag women by more. Eurostat made the same observation about its 2020 figures, writing that "the gender gap was more pronounced in countries where young people left the parental home later" (Eurostat). A correlation of that size leaves plenty of exceptions: Spain and Italy leave late with small gaps, while Czechia and Latvia sit near the middle with gaps of 2.8 and 2.8 years.
| Country | Gap (years) | Everyone |
|---|---|---|
| North Macedonia | 30.7 | |
| Romania | 27.4 | |
| Bosnia and Herzegovina | 29.5 | |
| Serbia | 30.1 | |
| Bulgaria | 27.9 | |
| Latvia | 25.7 | |
| Czechia | 25.8 | |
| Greece | 30.9 | |
| Croatia | 31.5 | |
| Slovakia | 30.9 | |
| Slovenia | 28.8 | |
| Hungary | 27.3 | |
| Poland | 26.8 | |
| France | 23.8 | |
| Austria | 25.2 | |
| Cyprus | 27.0 | |
| Italy | 30.2 | |
| Norway | 22.9 | |
| Germany | 24.1 | |
| Portugal | 28.8 | |
| Lithuania | 22.7 | |
| Belgium | 26.2 | |
| Spain | 30.2 | |
| Finland | 21.3 | |
| Estonia | 22.7 | |
| Ireland | 26.9 | |
| Netherlands | 23.4 | |
| Sweden | 23.1 | |
| Luxembourg | 26.6 | |
| Denmark | 21.8 | |
| Malta | 27.5 |
Malta (highlighted) is the only country where women leave later than men. Colour dot = the map's age band.
50%
A few things about this number are easy to miss.
It is a midpoint. Eurostat estimates the age at which half of young people no longer live with their parents, so a country at 30 still has many people who moved out at 20 and many who are home at 35. It says nothing about why people stay, whether they want to, or whether they come back.
It is a survey estimate. The Labour Force Survey samples households, and Eurostat rounds to one decimal. Differences of a few tenths, such as Estonia and Lithuania tied at 22.7, or Greece and Slovakia tied at 30.9, are not meaningful rankings.
It breaks in 2021. Eurostat flags a break in every country's series that year, so this story compares 2025 only with 2021 and later. Some earlier values look odd next to the current ones: Sweden's estimate was 17.5 in 2020, more than five years below its 2025 figure. Even after 2021, single years can jump, as Portugal's 2021 figure shows. Of the 31 countries, 25 changed by a year or less between 2021 and 2025.
It is incomplete. Türkiye has no 2025 figure; its 2024 estimate was 28.2 (men 29.9, women 26.6), which would put it among the late leavers. Montenegro was last reported for 2020, at 33.3. Both are in the downloadable data but not on the chart. The United Kingdom, last reported in 2018, is left out, and Switzerland and Iceland are not in the dataset.
Eurostat's earlier releases have also been revised. Its note on 2023 data gave Croatia 31.8 years; the current series shows 31.9 for that year. The release on 2020 data listed Luxembourg at 19.8; the series now shows 26.3. The chart uses the series as published in April 2026.
The tape again
Roll the tape back up and the pattern is plain. The left end belongs to the North and the Baltics, where barely one Dane or Finn in twenty aged 25 to 29 still lives with their parents. The right end belongs to the Mediterranean, Slovakia and the western Balkans, where more than half of 25-to-34-year-olds in Croatia, Slovakia and Greece were still at home in 2023. The EU's 26.3 is less a typical European than the balance point between those two ways of growing up.
And on every stretch of the tape except Malta's, the open circle comes first. Young women in Europe leave home before young men almost everywhere, and the later a country leaves home, the longer its young men tend to stay behind.
Sources and method
- Eurostat, Estimated average age of young people leaving the parental household by sex (yth_demo_030), DOI 10.2908/YTH_DEMO_030. Source: 10.2908/YTH_DEMO_030, accessed November 10, 2026 (data updated April 16, 2026). Reused under CC BY 4.0 per the Eurostat copyright notice; reshaped by ParityAI, and Eurostat is not responsible for this reuse.
- Eurostat, Statistics Explained: Young people – housing conditions
- Natural Earth country and land shapes via world-atlas
Eurostat estimates, from the EU Labour Force Survey, the age at which 50% of young people no longer live in a household with their parents; it calls this the estimated average age of leaving the parental household. Values are for 2025, rounded by Eurostat to one decimal. The chart shows the 27 EU members, Norway, Bosnia and Herzegovina, North Macedonia and Serbia (31 countries with 2025 values). Türkiye and Montenegro have no 2025 value and appear only in the CSV; the United Kingdom, last reported for 2018, is left out. Eurostat flags a break in every series in 2021, so changes are measured from 2021. The EU figure is Eurostat's own EU-27 estimate, not an average of the countries shown. Data were reshaped by ParityAI (one row per country, sex and year); Eurostat bears no responsibility for this reuse.
Charts like this, from your own numbers.
Connect a spreadsheet or the tools you run on, and Parity builds the dashboard and writes the report, with every number checked.
Try Parity free

