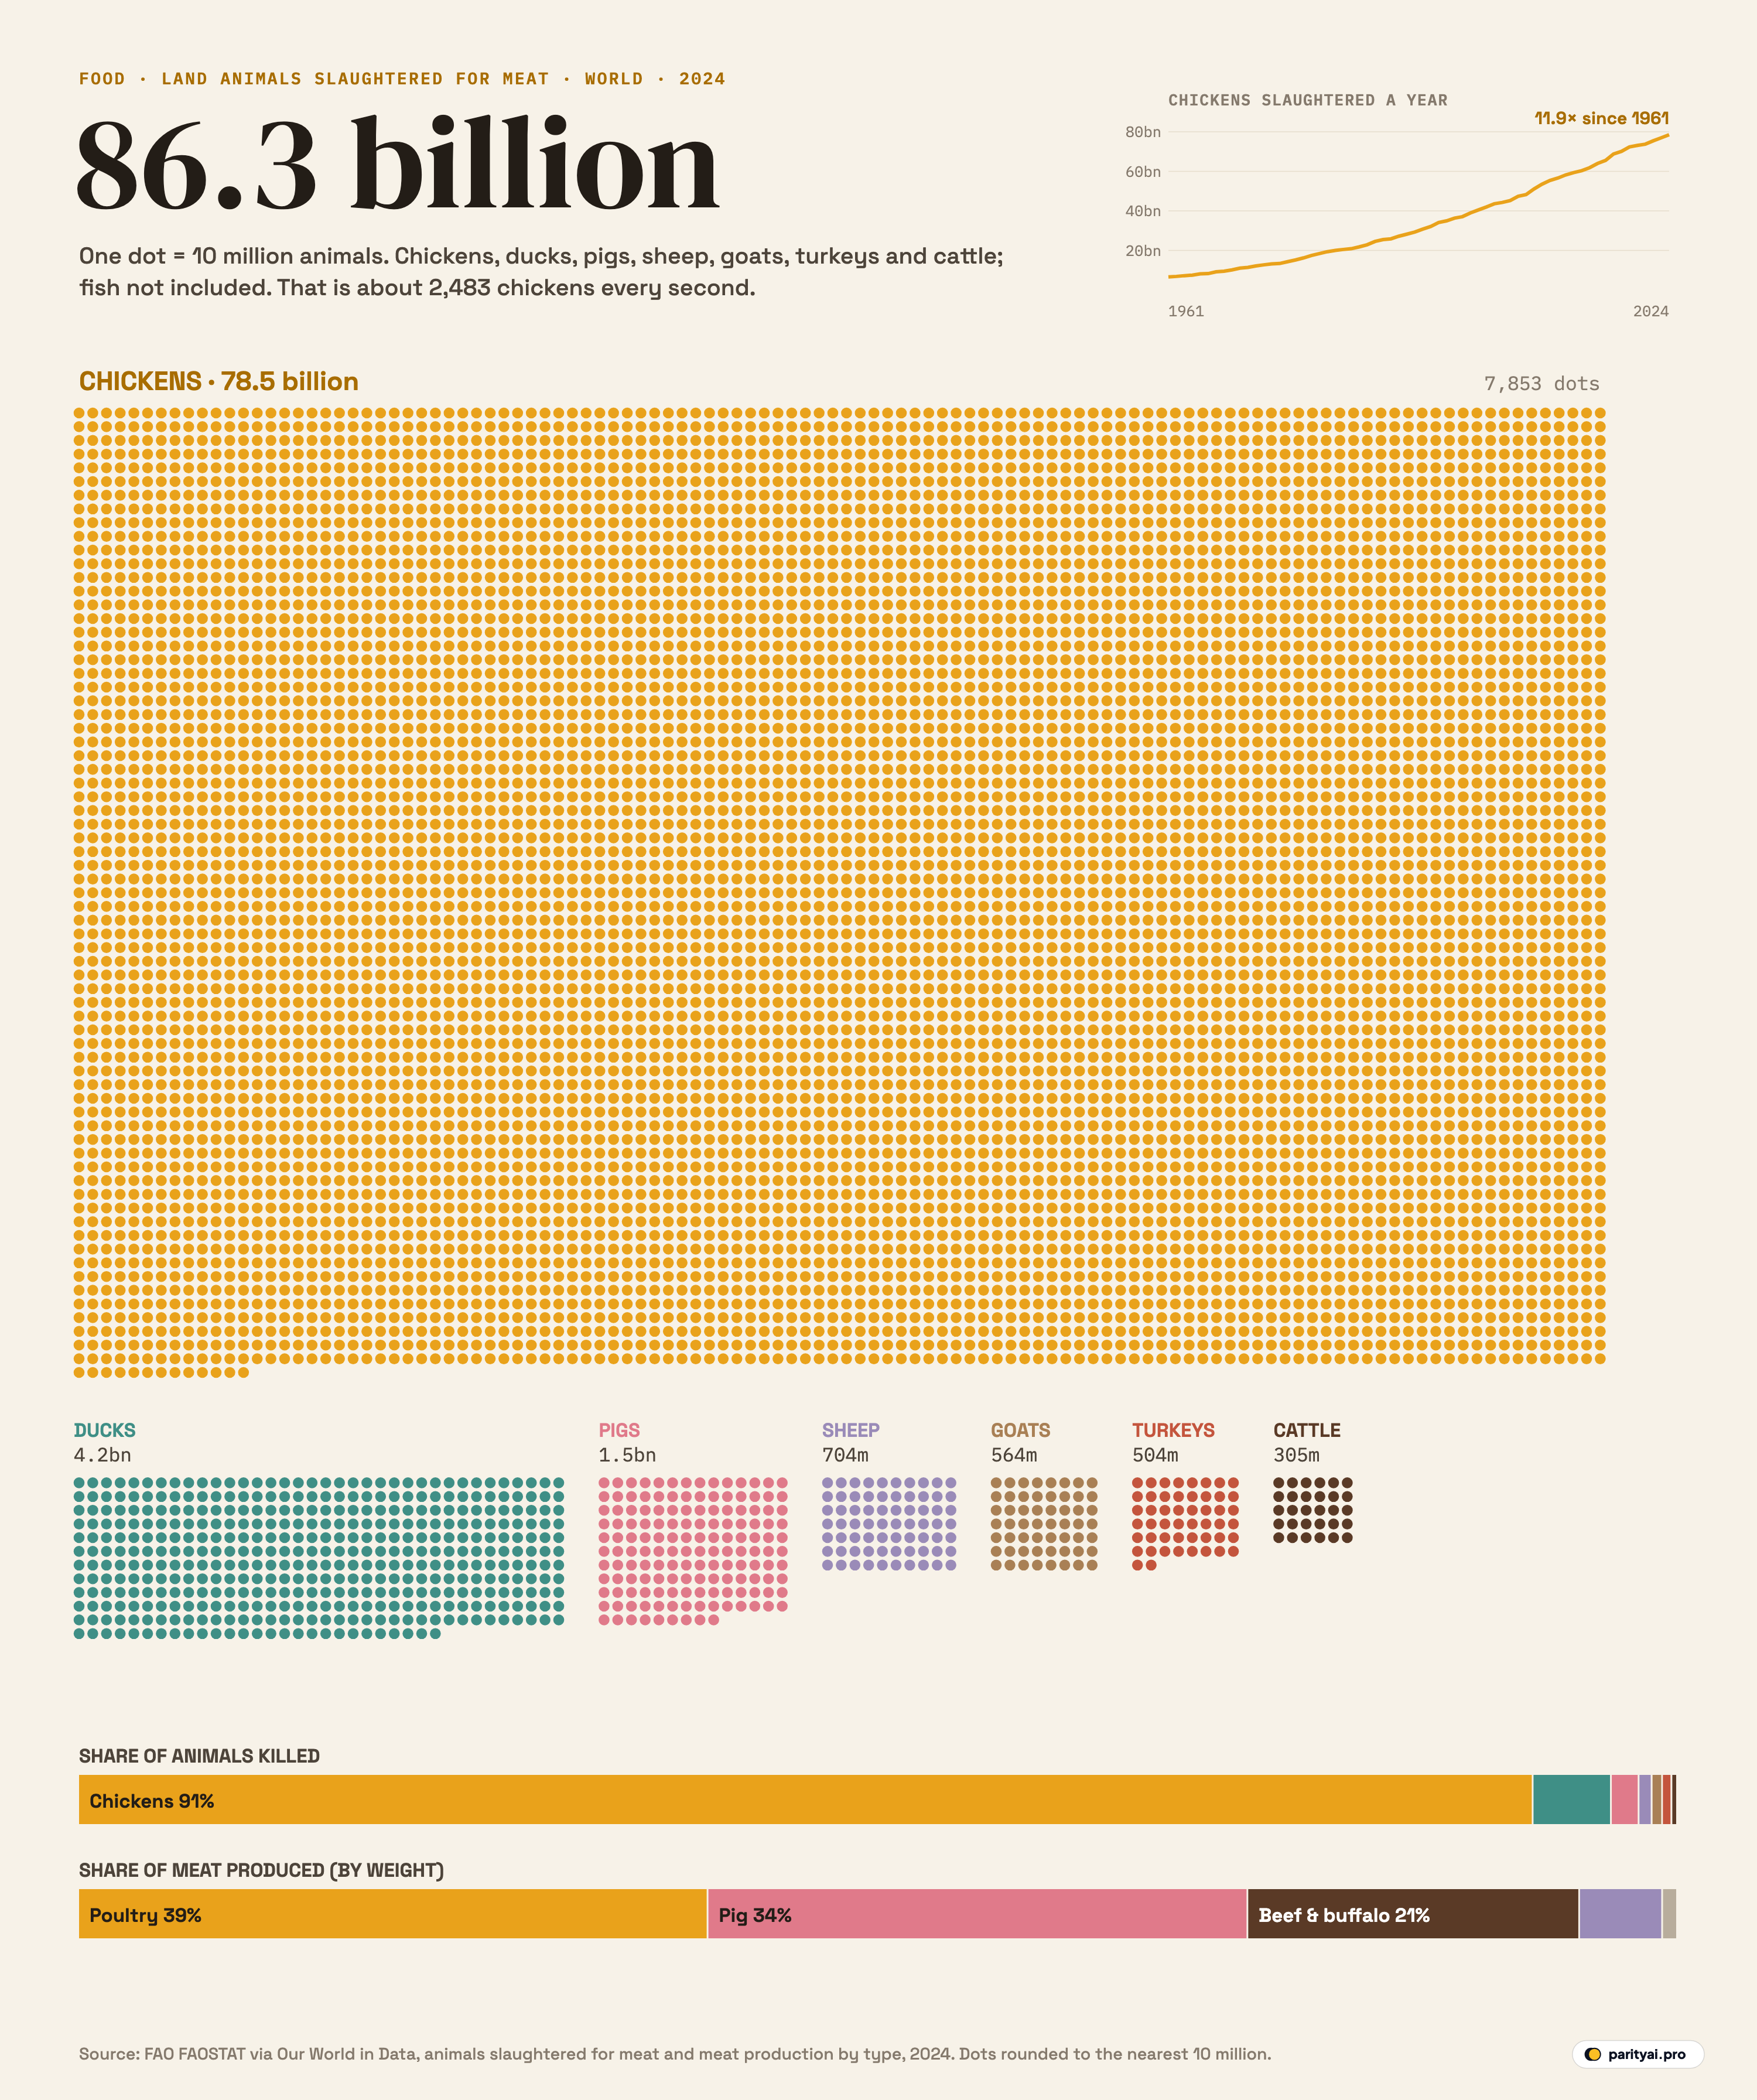
Try counting to 86 billion. At one number a second, without sleeping, it would take you about 2,700 years. That is how many land animals were slaughtered for meat around the world in 2024, according to the UN Food and Agriculture Organization's statistics compiled by Our World in Data: 86.3 billion of them, across seven species.
The chart above makes the number countable. Every dot is 10 million animals: 8,631 dots in all. The great yellow field that fills most of the page is chickens. Below it, in much smaller blocks, are ducks, pigs, sheep, goats, turkeys and cattle. The two bars at the bottom compare each species' share of the animals killed with its share of the meat produced.
The yellow field
78.5 billion chickens were slaughtered in 2024, 91% of all the land animals counted here. That works out to about 215 million a day, or 2,483 every second.
It is hard to overstate how much this has changed in one lifetime. In 1961, the first year of the FAO's data, the world slaughtered 6.6 billion chickens. The number had reached 40.5 billion by 2000 and has nearly doubled again since. Over the whole period it has grown 11.9 times, far faster than the human population, which has grown about 2.6 times. The small line chart in the corner traces that climb, and it has barely paused.
Why so many chickens
The answer is in the bars at the bottom of the chart. Chickens are 91% of the animals killed, but poultry, which includes chickens, ducks, turkeys and other birds, makes up only 39% of the meat by weight.
That is because a chicken yields very little meat. Dividing the world's poultry production by the number of birds slaughtered gives about 1.8 kilograms of meat per bird. The same calculation gives about 84 kilograms per pig. To produce the same weight of meat as one pig, you need around fifty chickens.
Modern broiler chickens are also bred to grow extraordinarily fast. Animal-welfare groups note that they reach slaughter weight in about six to seven weeks. That speed, along with cheap feed and industrial-scale housing, is what made chicken the cheapest meat in much of the world, and its cheapness is what drove the growth.
Seven blocks, very different sizes
The smaller blocks below the chickens are not small at all in ordinary terms.
- Ducks: 4.2 billion. The second-largest block, at 423 dots, most of them raised in Asia. Duck slaughter has grown 18.6 times since 1961, faster even than chicken.
- Pigs: 1.5 billion. 149 dots, or about 4.1 million pigs a day. Pork is still the second most-produced meat by weight, 34% of the total.
- Sheep: 704 million and goats: 564 million. Together, about 1.3 billion animals. India and China slaughter the most goats.
- Turkeys: 504 million. The United States alone accounts for about 196 million of them.
- Cattle: 305 million. The smallest block, just 30 dots, about 833,000 a day. Yet beef and buffalo meat make up 21% of the world's meat, because each animal is so large.
| Animal | Number | Share | 1961 | Growth | 1961–2024 |
|---|---|---|---|---|---|
| Chickens | 91% | 6.6 billion | 11.9× | ||
| Ducks | 5% | 227 million | 18.6× | ||
| Pigs | 2% | 376 million | 4.0× | ||
| Sheep | 1% | 331 million | 2.1× | ||
| Goats | 1% | 103 million | 5.5× | ||
| Turkeys | 1% | 142 million | 3.6× | ||
| Cattle | 0% | 173 million | 1.8× |
FAO via Our World in Data. Seven species with world totals; buffalo, geese, rabbits and others not included; fish excluded.
Per person, per day
Big totals are hard to feel, so it helps to scale them down. With about 8.2 billion people in the world in 2024, the 86.3 billion land animals slaughtered work out to roughly ten for every person on Earth, nine of them chickens.
Averages hide enormous differences, of course. Many people eat little or no meat, for reasons of religion, income or choice, while in some rich countries the average person eats the equivalent of more than twenty chickens a year. And the meat itself is unevenly shared: a single cow feeds far more people than a single chicken.
Scaled to a day, the numbers become almost mechanical. Every day in 2024, around 215 million chickens, 4.1 million pigs and 833,000 cattle were slaughtered. A city of a million people could be matched, in animals killed, roughly every six minutes.
Seven growth rates
The blocks on the chart are a snapshot of one year, but each species has its own history since 1961, and their growth rates could hardly be more different.
At the slow end, the number of cattle slaughtered has grown just 1.8 times, from 173 million to 305 million, and sheep 2.1 times. These are animals that need a lot of land and time to raise, and beef in particular has become expensive.
In the middle are turkeys (3.6 times), pigs (4.0 times) and goats (5.5 times). Pig numbers rose mostly with the growth of pork consumption in China, which went from a luxury to a daily staple as incomes rose.
At the fast end are the birds. Chickens grew 11.9 times and ducks 18.6 times. Both can be raised in large numbers in a small space, reach slaughter weight in weeks rather than months or years, and convert feed into meat efficiently. Those advantages are exactly why they dominate the chart.
How the world's plate has shifted
The meat bar tells a second story, about what kind of meat the world eats. In 1961, beef and buffalo made up 41% of all meat produced, pork 35% and poultry just 13%. By 2024, poultry had become the largest single meat, at 39%, with pork at 34% and beef down to 21%.
Total meat production grew 5.3 times over the same period, from about 70 million tonnes to about 371 million tonnes. Because chickens produce so little meat each, a shift towards chicken means a much larger rise in the number of animals than in the weight of meat. The world's meat output grew about fivefold; the number of chickens killed grew about twelvefold.
That shift has environmental benefits as well as costs. Chicken needs far less feed, land and water per kilogram than beef, and produces far fewer greenhouse gas emissions. But it also means that a given amount of meat requires many more animals, almost all of them raised in intensive indoor systems.
| Meat | Tonnes | Share of all meat |
|---|---|---|
| Poultry | 39% | |
| Pig | 34% | |
| Beef & buffalo | 21% | |
| Sheep & goat | 5% | |
| Other | 1% |
Where the animals are
China is the world's largest meat producer, and it dominates several of the blocks. It slaughtered about 703 million pigs in 2024, nearly half of the world total, and about 11.9 billion chickens, more than any other country, ahead of the United States at 9.6 billion and Brazil at 6.5 billion, according to the same FAO data. India and China account for most of the world's goats. The United States slaughters more turkeys than any other country.
China's pig numbers also show how fragile these systems can be. In 2018 and 2019, African swine fever, a disease that is harmless to people but kills almost every pig it infects, spread across the country. The FAO's count of pigs slaughtered in China fell by about 150 million between 2018 and 2019, and China's agriculture ministry reported its national herd down 41% in a year by September 2019. You can see the dip in the global pig line in the table. The herd took until 2021 to recover.
What the dots leave out
The chart counts only the seven land species with worldwide totals in the FAO data. It does not include buffalo, geese, rabbits, horses or camels, which together add hundreds of millions more.
It also leaves out fish, by far the largest group of animals that people eat. Fish are recorded in tonnes, not individuals, because nobody counts them one by one. Estimates suggest the numbers are vast: Our World in Data's farmed-fish series, based on work by the research group Fishcount, puts the number of farmed fish killed in 2022 at around 130 billion, with a wide range of uncertainty, and Fishcount estimates that 1.1 to 2.2 trillion wild fish are caught each year. If those were drawn at the same scale as the chart, the farmed fish alone would need a block larger than the chickens.
A few more caveats:
- Slaughter, not population. These are animals killed in a year, not the number alive at any one time. A chicken lives a few weeks; a cow can live for years.
- Reported figures. FAO data rely on national reporting, and backyard slaughter in many countries is estimated.
- Rounding. Each dot is rounded to the nearest 10 million animals.
The next decade
The growth is not over. The OECD and FAO's latest Agricultural Outlook projects that global meat output will rise by about 46 million tonnes by 2034, with poultry accounting for most of the increase. Most of the extra demand will come from middle-income countries, where rising incomes are buying more meat, and chicken is usually the first meat people can afford.
If that projection holds, the yellow field on this chart will keep getting bigger. Every additional million tonnes of chicken means roughly half a billion more birds.
Whether that is a problem depends on what you care about. For climate and land use, a shift from beef to chicken is mostly good news. For animal welfare, it means many more animals, most of them living short lives in crowded sheds. A chart that counts animals rather than tonnes makes the second point impossible to miss, which is why the yellow field looks the way it does.
Sources and method
- Our World in Data, Animals slaughtered for meat (based on FAO FAOSTAT). World totals 1961–2024, retrieved October 10, 2026
- Our World in Data, Global meat production by livestock type (based on FAO FAOSTAT)
Counts are the number of land animals slaughtered for meat worldwide in each year, as reported by the UN Food and Agriculture Organization (FAO) and compiled by Our World in Data. They include seven species with global totals in the data: chickens, ducks, pigs, sheep, goats, turkeys and cattle; buffalo, geese, rabbits, horses, camels and others are not counted, and fish and other aquatic animals are not included. Each dot represents 10 million animals, rounded to the nearest dot. Meat production is in tonnes of carcass weight; 'poultry' includes chickens, ducks, turkeys and other birds, and 'beef & buffalo' includes buffalo meat, so meat and animal categories do not match exactly.
Charts like this, from your own numbers.
Connect a spreadsheet or the tools you run on, and Parity builds the dashboard and writes the report, with every number checked.
Try Parity free