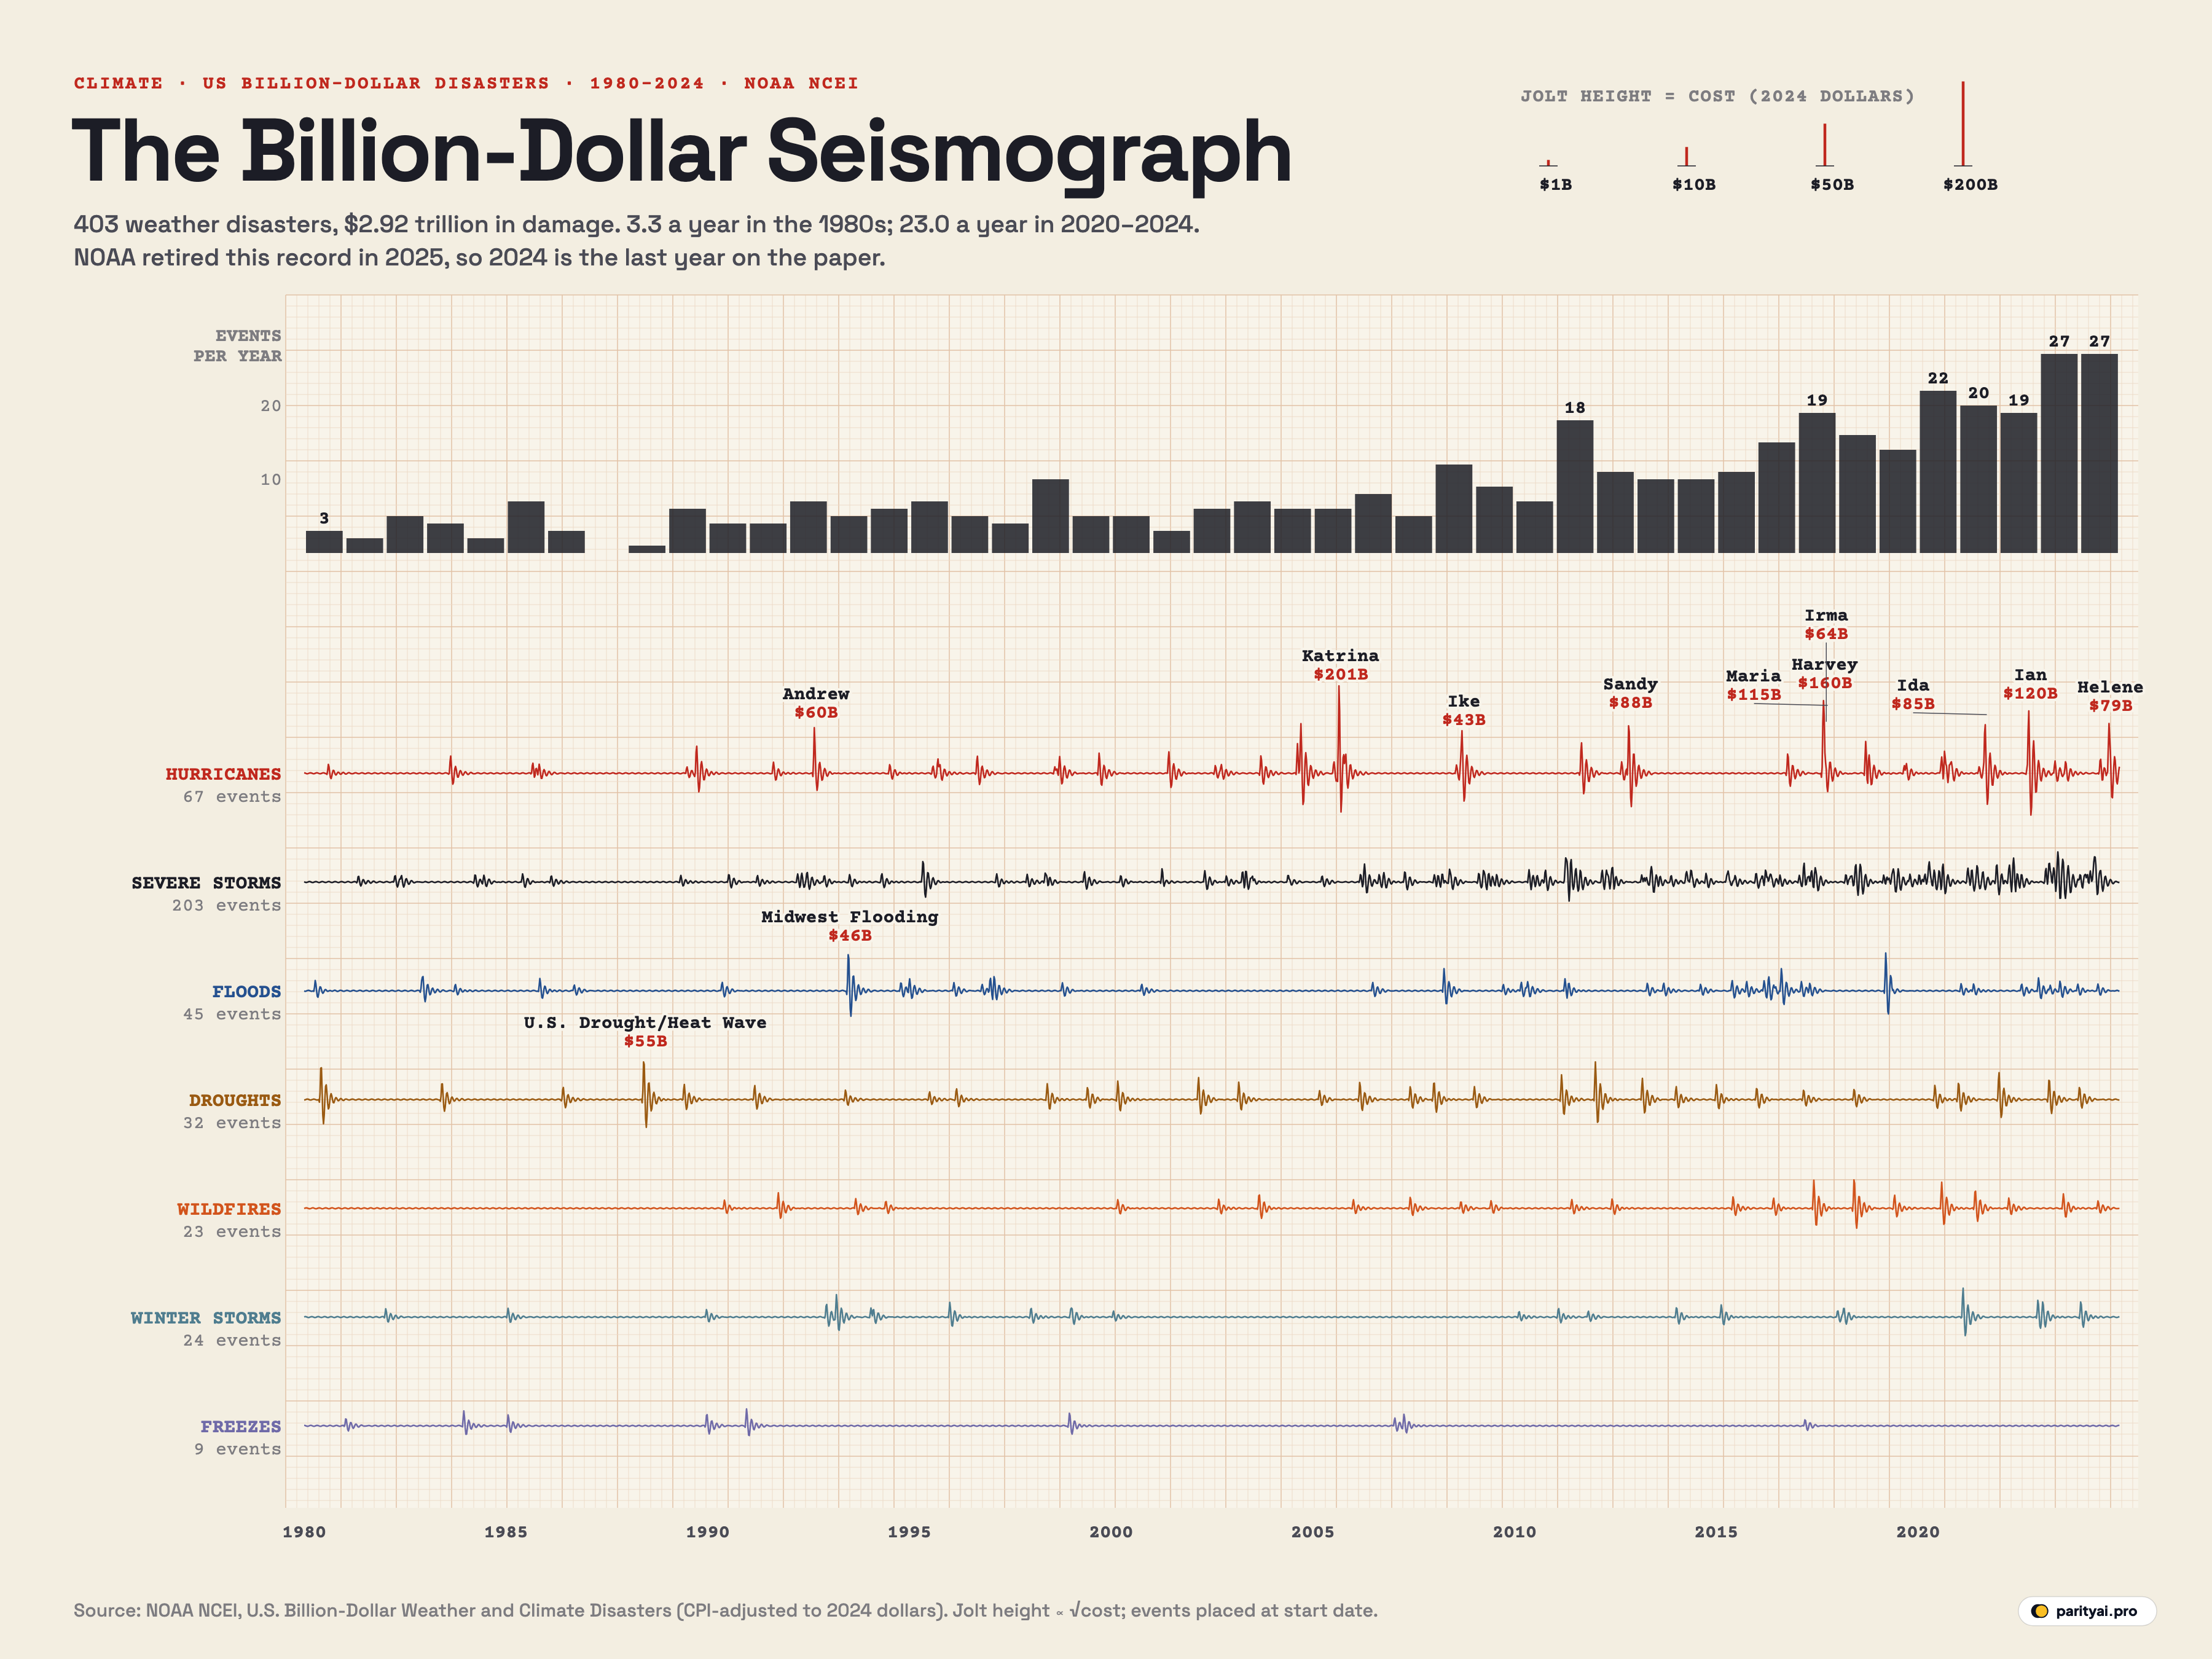
On May 8, 2025, the National Oceanic and Atmospheric Administration posted a short notice. Its database of billion-dollar weather and climate disasters, covering every year back to 1980, would be retired, "with no updates beyond calendar year 2024". The agency cited evolving priorities, statutory mandates and staffing changes.
It was one of the most quoted datasets in American climate reporting, and one of the most argued about. The chart above treats it as what it became: a finished instrument record, like the paper roll from a seismograph that has been switched off.
There are seven traces on the paper, one for each kind of disaster NOAA tracked. Every one of the 403 disasters in the record makes its trace jolt at the date it began. The height of the jolt grows with the square root of the cost, so a $100 billion hurricane makes a spike ten times taller than a $1 billion hailstorm, not a hundred times. Costs are NOAA's estimates of total direct losses, insured and uninsured, adjusted for inflation to 2024 dollars. The bars along the top count the events each year.
Together, the record adds up to $2.92 trillion in damage and 16,941 deaths.
A pen that rarely moved, then never stopped
Run your eye along the paper from left to right and the first thing you notice is not any single spike but the change in rhythm.
In the 1980s, the traces are mostly flat. The record averages 3.3 billion-dollar disasters a year in that decade, and in 1981, 1984, 1987, 1988 there were two or fewer. In 1987 there were none at all. In the 1990s the average rose to 5.7 a year, and in the 2000s to 6.7.
Then the pace changes. The 2010s averaged 13.1 events a year. From 2020 to 2024, the average was 23.0. The record for a single year is 27, set in 2023, and 2024 came close with 27.
Average annual costs climbed too, from about $22.0 billion in the 1980s to $99.4 billion in the 2010s and $149 billion a year in 2020–2024, all in 2024 dollars. The costliest year was 2017, at $396 billion, when Harvey, Irma and Maria struck within a month of each other.
The red trace: hurricanes
The top trace carries the biggest spikes on the paper. Hurricanes made up only 67 of the 403 events, but they account for 53% of the total cost: $1543 billion.
Hurricane Katrina in 2005 is the tallest spike in the record, at $201 billion. Hurricane Harvey (2017, $160 billion) flooded Houston with days of rain. Hurricane Ian (2022, $120 billion) and Hurricane Maria (2017, $115 billion) follow. Maria, which devastated Puerto Rico, is also the deadliest event in the record, with 2,981 deaths, ahead of Katrina's 1,833.
The last big spike on the paper is Hurricane Helene, at $78.7 billion. NOAA's final annual summary found that Helene killed at least 219 people, many of them in the mountains of western North Carolina, far from the coast where hurricane damage is usually expected.
| # | Disaster | Type | Cost (2024 $) | Deaths |
|---|---|---|---|---|
| 1 | Hurricane Katrina (August 2005) | Tropical Cyclone | 1,833 | |
| 2 | Hurricane Harvey (August 2017) | Tropical Cyclone | 89 | |
| 3 | Hurricane Ian (September 2022) | Tropical Cyclone | 152 | |
| 4 | Hurricane Maria (September 2017) | Tropical Cyclone | 2,981 | |
| 5 | Hurricane Sandy (October 2012) | Tropical Cyclone | 159 | |
| 6 | Hurricane Ida (August 2021) | Tropical Cyclone | 96 | |
| 7 | Hurricane Helene (September 2024) | Tropical Cyclone | 219 | |
| 8 | Hurricane Irma (September 2017) | Tropical Cyclone | 97 | |
| 9 | Hurricane Andrew (August 1992) | Tropical Cyclone | 61 | |
| 10 | U.S. Drought/Heat Wave (Summer 1988) | Drought | 454 | |
| 11 | Midwest Flooding (Summer 1993) | Flooding | 48 | |
| 12 | Hurricane Ike (September 2008) | Tropical Cyclone | 112 | |
| 13 | U.S. Drought/Heat Wave (2012) | Drought | 123 | |
| 14 | Central/Eastern Drought/Heat Wave (Summer-Fall 1980) | Drought | 1,260 | |
| 15 | Hurricane Milton (October 2024) | Tropical Cyclone | 32 |
CPI-adjusted to 2024 dollars by NOAA NCEI. Costs are estimates of total direct losses, insured and uninsured.
The black trace: storms that never make the news
The second trace looks completely different. Severe storms, the record's term for outbreaks of tornadoes, hail and damaging winds, rarely produce a single giant spike. Instead they make the trace shiver.
There were only 8 billion-dollar severe storms in the whole of the 1980s. From 2010 onward there were 149. They make up 50% of all events in the record, and by the 2020s the black trace is almost never still.
A billion-dollar hailstorm over a big suburb can do more damage than a tornado in open farmland, and severe storms are where growth in exposure matters most. More homes, more roofs, more cars and more solar panels are now sitting under the clouds that produce hail.
The slow disasters: droughts and freezes
Droughts make few jolts, but large ones. There were 32 in the record, with a combined cost of $368 billion, the second-highest of any category, and 4,658 deaths, many of them in heat waves that came with the droughts. The biggest, the U.S. Drought/Heat Wave (Summer 1988), cost $54.6 billion. Droughts are hard to date: they creep in over months, so their jolt marks the start of a long, slow event rather than a single day.
Freezes are the rarest trace, with just 9 events, most of them hard frosts in Florida and California that destroyed citrus and other crops. Winter storms add 24 more. The costliest was the Northwest, Central, Eastern Winter Storm and Cold Wave (February 2021), at $27.2 billion, which knocked out Texas's power grid for days.
Fire and water
The wildfire trace is quiet for its first decade and noisy for its last. The record has 23 billion-dollar wildfire events, and almost half of them came in its last ten years. The costliest, the Western Wildfires, California Firestorm (Summer-Fall 2018), at $30.0 billion, includes the Camp Fire that destroyed the town of Paradise.
NOAA counted western wildfires as seasonal, regional totals rather than single fires. The record ends before the January 2025 fires in Los Angeles, which Climate Central has estimated at $61.2 billion, which would make them the costliest wildfire disaster in the series by a wide margin.
The flood trace has one dominant spike: the Midwest Flooding (Summer 1993), at $46.3 billion, when the Mississippi and Missouri rivers overflowed across nine states.
| Type | Events | Total cost | Average per event | Deaths |
|---|---|---|---|---|
| Tropical Cyclone | 67 | $23.0 billion | 7,211 | |
| Severe Storm | 203 | $2.5 billion | 2,145 | |
| Drought | 32 | $11.5 billion | 4,658 | |
| Flooding | 45 | $4.5 billion | 765 | |
| Wildfire | 23 | $6.4 billion | 537 | |
| Winter Storm | 24 | $4.4 billion | 1,463 | |
| Freeze | 9 | $4.1 billion | 162 |
Counting the dead
Money is what the record measures, but it also counts lives. Of the 16,941 deaths it attributes to these disasters, hurricanes caused 7,211 and droughts and heat waves 4,658. Severe storms killed 2,145 people, winter storms and cold waves 1,463, floods 765 and wildfires 537.
The deadliest years and the costliest years are not always the same. In 2024, the last year on the paper, 27 disasters cost $183 billion and killed 568 people, most of them in Helene. In 2023, the record year by count, NOAA logged 28 disasters, but their combined cost was about half of 2024's, because none of them was a major landfalling hurricane. A year full of hailstorms and tornado outbreaks can set a record for the number of disasters without setting one for damage.
Death counts are also the part of the record most likely to be revised or disputed. Maria's toll of nearly 3,000 came from a later study of excess deaths in Puerto Rico, not from the initial official count of 64.
Is the rise real?
This is where the arguments start, and they are worth taking seriously.
The costs are adjusted for inflation, but not for growth. The United States has far more people, buildings and wealth than it did in 1980, and much of the growth has been in places exposed to hurricanes, wildfires and severe storms, from the Gulf Coast and Florida to the suburbs of Dallas and the hills around Los Angeles. Even if the weather were unchanged, the same storm would cost more today than it did forty years ago. Climate Central, which now maintains the database, itself attributes part of the rise to increased exposure and vulnerability, "where we build; how we build", as well as climate change.
Some critics go further. The political scientist Roger Pielke Jr. has argued that the tabulation fails to meet NOAA's own standards for information quality and should not be used to detect trends in extreme weather. Others reply that the data were never meant to isolate climate change, only to count costs, and that rising costs are what matter to the people paying them.
Both points can be true at once. The paper shows, beyond dispute, that Americans are paying far more for weather disasters than they used to, and far more often. It cannot, on its own, say how much of that is because the weather changed and how much because of where and how the country has built.
| Year | Events | Cost (2024 $) | Deaths |
|---|---|---|---|
| 2024 | $183 billion | 568 | |
| 2023 | $90.5 billion | 470 | |
| 2022 | $188 billion | 496 | |
| 2021 | $164 billion | 724 | |
| 2020 | $121 billion | 262 | |
| 2019 | $55.5 billion | 44 | |
| 2018 | $116 billion | 247 | |
| 2017 | $396 billion | 3,280 | |
| 2016 | $61.2 billion | 138 | |
| 2015 | $30.9 billion | 158 | |
| 2014 | $25.5 billion | 53 | |
| 2013 | $32.3 billion | 114 | |
| 2012 | $159 billion | 377 | |
| 2011 | $97.9 billion | 765 | |
| 2010 | $20.2 billion | 51 | |
| 2009 | $19.8 billion | 43 | |
| 2008 | $94.1 billion | 315 | |
| 2007 | $18.9 billion | 37 | |
| 2006 | $25.2 billion | 97 | |
| 2005 | $269 billion | 2,002 | |
| 2004 | $92.3 billion | 172 | |
| 2003 | $38.4 billion | 180 | |
| 2002 | $27.2 billion | 63 | |
| 2001 | $21.8 billion | 46 | |
| 2000 | $15.5 billion | 147 | |
| 1999 | $24.5 billion | 659 | |
| 1998 | $38.2 billion | 301 | |
| 1997 | $17.2 billion | 246 | |
| 1996 | $23.2 billion | 234 | |
| 1995 | $35.5 billion | 977 | |
| 1994 | $16.6 billion | 133 | |
| 1993 | $65.7 billion | 339 | |
| 1992 | $80.0 billion | 113 | |
| 1991 | $19.6 billion | 43 | |
| 1990 | $14.6 billion | 30 | |
| 1989 | $40.3 billion | 228 | |
| 1988 | $54.6 billion | 454 | |
| 1987 | $0.0 billion | 0 | |
| 1986 | $7.9 billion | 123 | |
| 1985 | $22.5 billion | 379 | |
| 1984 | $3.2 billion | 81 | |
| 1983 | $26.8 billion | 186 | |
| 1982 | $15.2 billion | 243 | |
| 1981 | $3.5 billion | 20 | |
| 1980 | $45.7 billion | 1,303 |
Reading the paper
- A $1 billion threshold, adjusted for inflation. An event enters the record only if its cost, in 2024 dollars, reached $1 billion. Smaller disasters, however deadly, are not on the chart.
- Square-root jolts. Jolt height grows with the square root of cost, so mid-sized disasters stay visible next to Katrina.
- Start dates only. Long events, especially droughts, are placed at the day they began, not spread across their duration.
- Estimates. Costs combine insurance claims, federal aid and other sources, and some were revised for years after the event.
After the pen lifts
The paper roll ends in December 2024 with the jolts of Helene and Milton. The pen has not exactly stopped, though. Adam Smith, the scientist who led the project, left NOAA in April 2025 and joined Climate Central, which revived the database later that year. Its first tally counted 14 billion-dollar disasters in the first half of 2025, costing more than $101 billion.
So the record continues, under a new owner and with some changes in method. The 45 years drawn here are the part that NOAA itself measured: a seismograph that recorded, in its own plain units, how the cost of American weather grew from an occasional shock into a near-constant tremor.
Sources and method
- NOAA National Centers for Environmental Information (NCEI), U.S. Billion-Dollar Weather and Climate Disasters, 1980–2024. Event list with CPI-adjusted costs, retrieved October 10, 2026; the dataset is no longer updated
Each event is a weather or climate disaster in the United States whose total direct losses, insured and uninsured, reached at least $1 billion after adjusting for inflation to 2024 dollars with the Consumer Price Index, as estimated by NOAA NCEI. Events are placed at their start date on the trace for their disaster type. Each jolt is a short damped wave whose height is proportional to the square root of the event's cost, so a disaster four times as costly makes a jolt twice as tall. Overlapping events add together. Annual bars count events and sum their CPI-adjusted costs.
Charts like this, from your own numbers.
Connect a spreadsheet or the tools you run on, and Parity builds the dashboard and writes the report, with every number checked.
Try Parity free

