Every month, the US Treasury publishes a document almost nobody reads. The Monthly Treasury Statement lists, to the cent, how much money the federal government took in during the month, where it came from, how much it spent and on what. It is the closest thing the country has to a household bank statement, and it is where the story of the 2025 tariffs, and their partial unwinding in 2026, can be read most plainly.
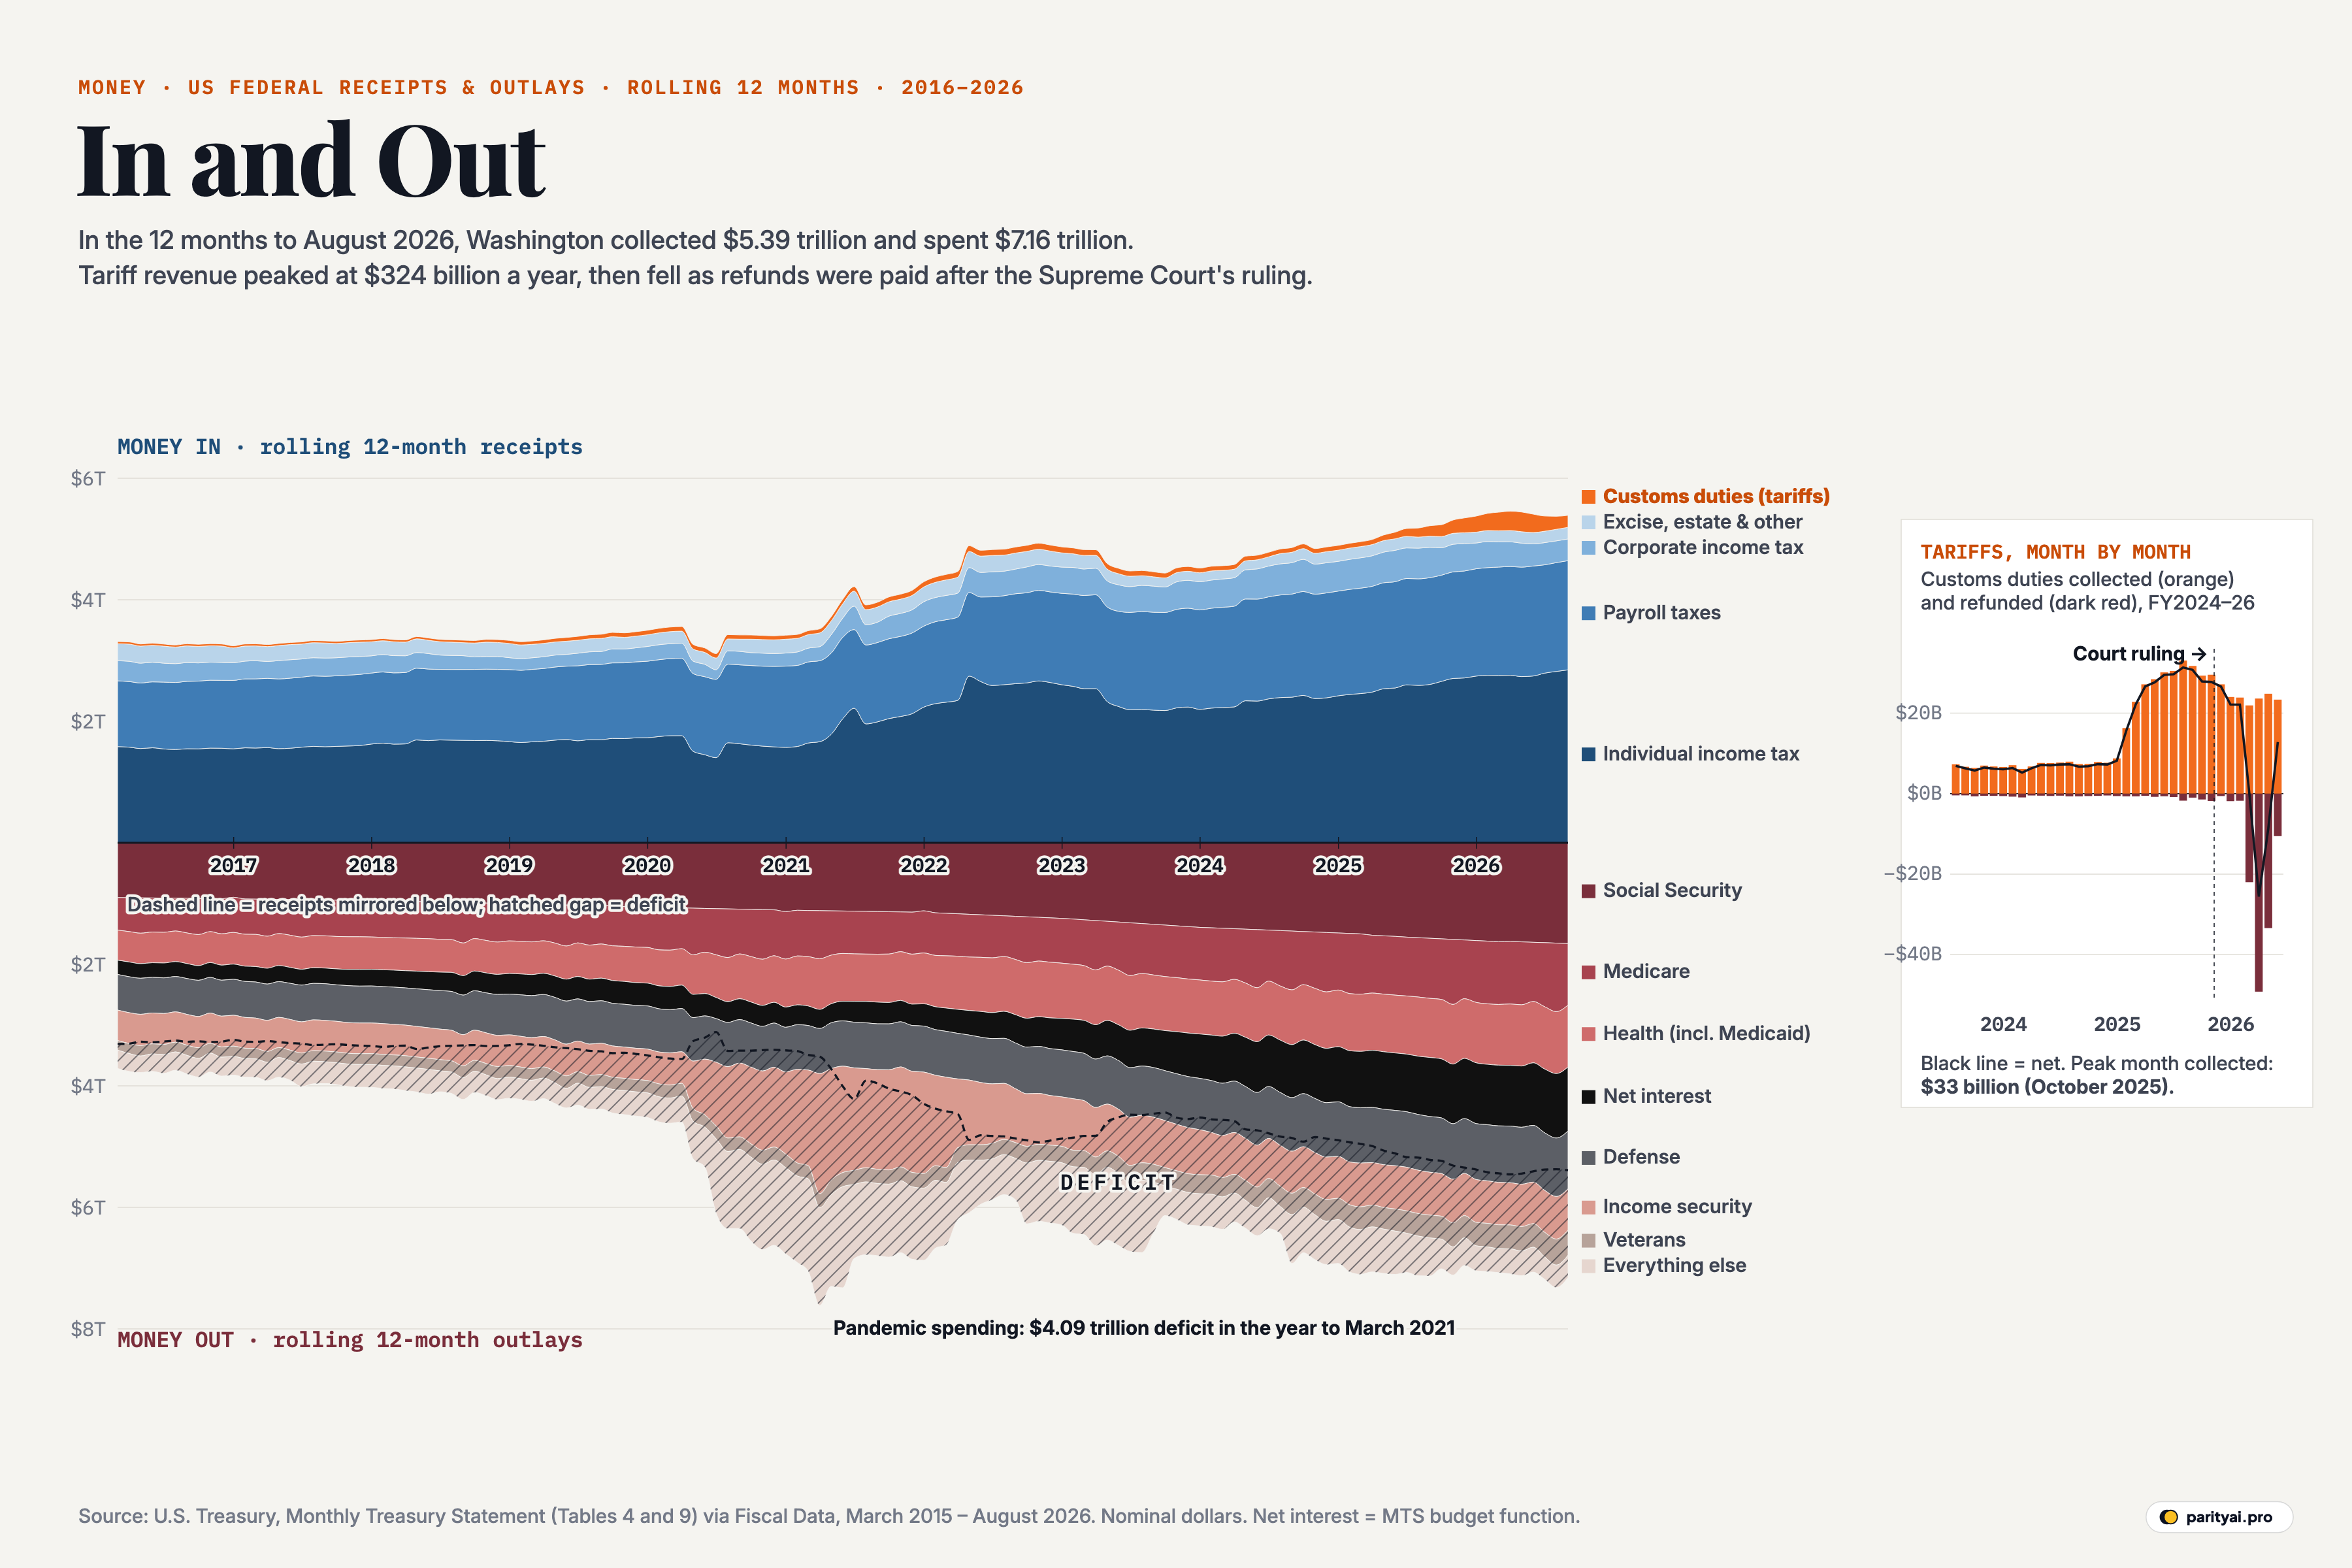
The chart above draws March 2015 to August 2026 from those statements. Each point is a rolling 12-month total, so the spikes of tax-filing season are smoothed away and every point reads as a year's worth of money. Above the central line, receipts are stacked in blues, with customs duties, the money raised by tariffs, as a thin orange band on top. Below the line, outlays are stacked in reds and greys. The dashed line below the axis is the receipts total, mirrored, so that the hatched gap between it and the bottom of the spending stack is the deficit: the amount the government had to borrow.
In the 12 months to August 2026, Washington collected $5.39 trillion and spent $7.16 trillion, leaving a gap of $1.77 trillion.
The credit side
The top half of the chart is dominated by two layers. Individual income tax is the largest single source of federal money, about 51% of all receipts in fiscal year 2025. Payroll taxes, the Social Security and Medicare contributions taken from wages, are the second. Together they make up roughly four-fifths of everything the government collects.
Corporate income tax is a much thinner band, and lately a shrinking one. It raised $452 billion in fiscal 2025. In the first 11 months of fiscal 2026 it brought in $295 billion, against $390 billion in the same months a year earlier. The Congressional Budget Office attributes much of the drop to the 2025 reconciliation act, which lets companies deduct more of their investment spending straight away.
Above those sit excise taxes, estate taxes and miscellaneous receipts, and then the orange sliver that became, briefly, one of the most-watched lines in American public finance.
A line item that moved
For most of the decade, customs duties were a rounding error. They raised $35 billion in fiscal 2016 and $77 billion in fiscal 2024, less than 2% of federal receipts.
Then came 2025. In April, the administration invoked the International Emergency Economic Powers Act to impose a 10% tariff on almost all imports, followed days later by higher rates for individual countries. In June, tariffs on steel and aluminum doubled to 50%. The orange band swelled. Customs duties brought in $195 billion in fiscal 2025, a record, and 3.7% of all receipts. In the inset on the right, monthly collections climbed from around $7 billion to a peak of $33 billion in October 2025.
On a rolling 12-month basis, tariff revenue peaked at $324 billion in the year to April 2026.
The ruling and the refunds
On February 20, 2026, the Supreme Court ruled in Learning Resources v. Trump that the emergency-powers law does not authorise tariffs. The IEEPA tariffs, the largest part of the 2025 increase, had been collected unlawfully.
That decision is visible in the inset as the sudden appearance of dark red bars below the line. The administration ended the IEEPA tariffs and, according to CBO, began issuing refunds in May. Through August, customs refunds in fiscal 2026 totalled $125 billion. In 3 months, starting in May 2026, the government paid back more in tariffs than it collected, so net customs revenue was negative.
The government did not abandon tariffs. A temporary 10% tariff under a different law, Section 122 of the Trade Act, ran from February 24 to July 24, 2026, and new Section 301 tariffs of 10% to 12.5% on more than 80 countries took effect on July 24. So orange bars keep appearing above the line even as the refunds flow out below it.
The net effect on the budget is that the tariff windfall shrank. Net customs receipts in the first 11 months of fiscal 2026 came to $167 billion. CBO estimates that for the full fiscal year they fell 11% from 2025, to about $172 billion, after roughly $130 billion of refunds on IEEPA tariffs. On a rolling 12-month basis, tariff revenue had dropped back to $197 billion by August 2026.
| Month | Collected | Refunded | Net |
|---|---|---|---|
| August 2026 | $11 billion | ▲ $13 billion | |
| July 2026 | $33 billion | ▼ $9 billion | |
| June 2026 | $49 billion | ▼ $26 billion | |
| May 2026 | $22 billion | ▼ $0 billion | |
| April 2026 | $2 billion | ▲ $22 billion | |
| March 2026 | $2 billion | ▲ $22 billion | |
| February 2026 | $1 billion | ▲ $27 billion | |
| January 2026 | $2 billion | ▲ $28 billion | |
| December 2025 | $1 billion | ▲ $28 billion | |
| November 2025 | $1 billion | ▲ $31 billion | |
| October 2025 | $2 billion | ▲ $31 billion | |
| September 2025 | $1 billion | ▲ $30 billion | |
| August 2025 | $1 billion | ▲ $30 billion | |
| July 2025 | $1 billion | ▲ $28 billion | |
| June 2025 | $1 billion | ▲ $27 billion | |
| May 2025 | $1 billion | ▲ $22 billion | |
| April 2025 | $1 billion | ▲ $16 billion | |
| March 2025 | $1 billion | ▲ $8 billion | |
| February 2025 | $0 billion | ▲ $7 billion | |
| January 2025 | $1 billion | ▲ $7 billion | |
| December 2024 | $1 billion | ▲ $7 billion | |
| November 2024 | $1 billion | ▲ $7 billion | |
| October 2024 | $1 billion | ▲ $7 billion |
MTS Table 4. Refunds rose after the Supreme Court ruled on February 20, 2026 that IEEPA does not authorize tariffs.
The debit side
Below the line, the biggest layers are the programmes for older Americans. Social Security cost $1581 billion in fiscal 2025 and Medicare $997 billion. Health, mostly Medicaid and subsidies for health insurance, added $979 billion. All three grow almost automatically as the population ages and health costs rise, which is why the bottom half of the chart gets deeper almost every year.
The pandemic shows up as a sudden plunge in 2020 and 2021, when emergency payments to households, expanded unemployment benefits and business loans swelled the income security layer to $1649 billion in fiscal 2021. In the year to March 2021, the deficit reached $4.09 trillion, the widest gap on the chart. Those programmes ended, and income security fell back to $702 billion by fiscal 2025.
Guns, veterans and everything else
Defense is the grey band near the bottom of the spending stack. It grew from $595 billion in fiscal 2016 to $917 billion in fiscal 2025, more slowly than the programmes above it, so its share of the budget has shrunk even as the dollar amount rose. Veterans' benefits grew faster, from $175 billion to $377 billion, as disability payments expanded after the wars in Iraq and Afghanistan and a 2022 law extended care to veterans exposed to toxic burn pits.
The palest layer at the bottom is everything else: transportation, education, science, agriculture, justice, international aid, the running of federal agencies and much more. These are the things most people picture when they think of "government". Net of certain offsetting receipts that the budget records as negative spending, they came to $488 billion in fiscal 2025, against $307 billion in fiscal 2016. That is a large sum, but it is smaller than Social Security alone, which is why debates about trimming waste in agencies rarely move the deficit much.
The cost of the gap
The black band is the most striking change on the debit side. Net interest, what the government pays to borrow, cost $241 billion in fiscal 2016. In fiscal 2025 it cost $971 billion, four times as much, as years of deficits added to the debt and interest rates rose from near zero.
On the Treasury's measure, net interest passed defense spending in fiscal 2024 and stayed above it in 2025, when defense cost $917 billion. In the 12 months to August 2026, net interest reached $1054 billion, against $952 billion for defense. The black band is now thicker than the grey defense band beneath it.
That is the feedback loop the chart quietly records. Each year's deficit adds to the debt; a bigger debt means a bigger interest bill; a bigger interest bill means a bigger deficit next year, unless something else changes.
| Fiscal year | Receipts | Outlays | Deficit | Customs duties | Net interest |
|---|---|---|---|---|---|
| FY2025 | $5.23 trillion | $7.01 trillion | $971 billion | ||
| FY2024 | $4.92 trillion | $6.75 trillion | $882 billion | ||
| FY2023 | $4.44 trillion | $6.13 trillion | $659 billion | ||
| FY2022 | $4.90 trillion | $6.27 trillion | $475 billion | ||
| FY2021 | $4.05 trillion | $6.82 trillion | $352 billion | ||
| FY2020 | $3.42 trillion | $6.55 trillion | $345 billion | ||
| FY2019 | $3.46 trillion | $4.45 trillion | $376 billion | ||
| FY2018 | $3.33 trillion | $4.11 trillion | $325 billion | ||
| FY2017 | $3.31 trillion | $3.98 trillion | $263 billion | ||
| FY2016 | $3.27 trillion | $3.85 trillion | $241 billion |
Fiscal years run October to September. Monthly Treasury Statement, Table 9. Not adjusted for inflation.
The difference
So, after a decade, where does the account stand?
Receipts have grown substantially, from $3.27 trillion in fiscal 2016 to $5.23 trillion in fiscal 2025. Spending grew faster, from $3.85 trillion to $7.01 trillion. The deficit, which was $0.98 trillion in fiscal 2019, before the pandemic, was $1.78 trillion in fiscal 2025. CBO's preliminary estimate puts fiscal 2026 at $2.0 trillion, $218 billion more than the year before.
The tariff surge, for all the attention it got, was never large enough to change that picture much. At its peak it was a few percent of federal revenue, and after the Supreme Court's ruling, much of it was being paid back to the importers who paid it. CBO's estimate of the 2025 reconciliation act points the other way: it expects the law to add $3.4 trillion to deficits over a decade, mainly through lower taxes.
How to read the chart
- Rolling 12-month totals. Each point sums the previous 12 months. A change shows up gradually and fully only a year after it starts.
- Fiscal years. The federal fiscal year runs from October to September. Fiscal 2026 ended on September 30, 2026; the latest monthly statement in the chart covers August.
- Net interest as the Treasury reports it. The MTS measure subtracts interest paid to government trust funds. CBO's broader measure of interest on the public debt is larger.
- Nominal dollars. The figures are not adjusted for inflation, which accounts for part of the growth on both sides.
The statement nobody reads
A household that spends more than it earns for a decade will eventually have to change something. Governments have more room than households, but the Monthly Treasury Statement keeps the same kind of record, line by line, and the decade shown here has a clear shape: a top half that grows steadily, a bottom half that grows faster, and an interest bill that has quietly become one of the largest things the government buys.
The orange sliver on top is the part that made headlines. The black band underneath is the part that will matter longer.
Sources and method
- U.S. Treasury, Monthly Treasury Statement, Table 9 (receipts by source and outlays by function), via Fiscal Data. March 2015 to August 2026, retrieved October 10, 2026
- U.S. Treasury, Monthly Treasury Statement, Table 4 (customs duties: gross, refunds, net)
- Congressional Budget Office, Monthly Budget Review: September 2026
Monthly receipts and outlays come from Table 9 of the Monthly Treasury Statement. Each point on the main chart is the sum of the previous 12 months, so seasonal swings such as April tax payments are smoothed out and the chart reads in annual dollars. Payroll taxes are the sum of 'employment and general retirement', 'unemployment insurance' and 'other retirement' receipts. 'Everything else' combines the remaining budget functions, including undistributed offsetting receipts, which are negative. Net interest is the budget function as reported in the MTS, which nets out interest received by trust funds and is smaller than interest on the public debt. Customs duties in the inset come from Table 4 and are shown gross, with refunds below the line and the net as a line. Figures are not adjusted for inflation.
Charts like this, from your own numbers.
Connect a spreadsheet or the tools you run on, and Parity builds the dashboard and writes the report, with every number checked.
Try Parity free