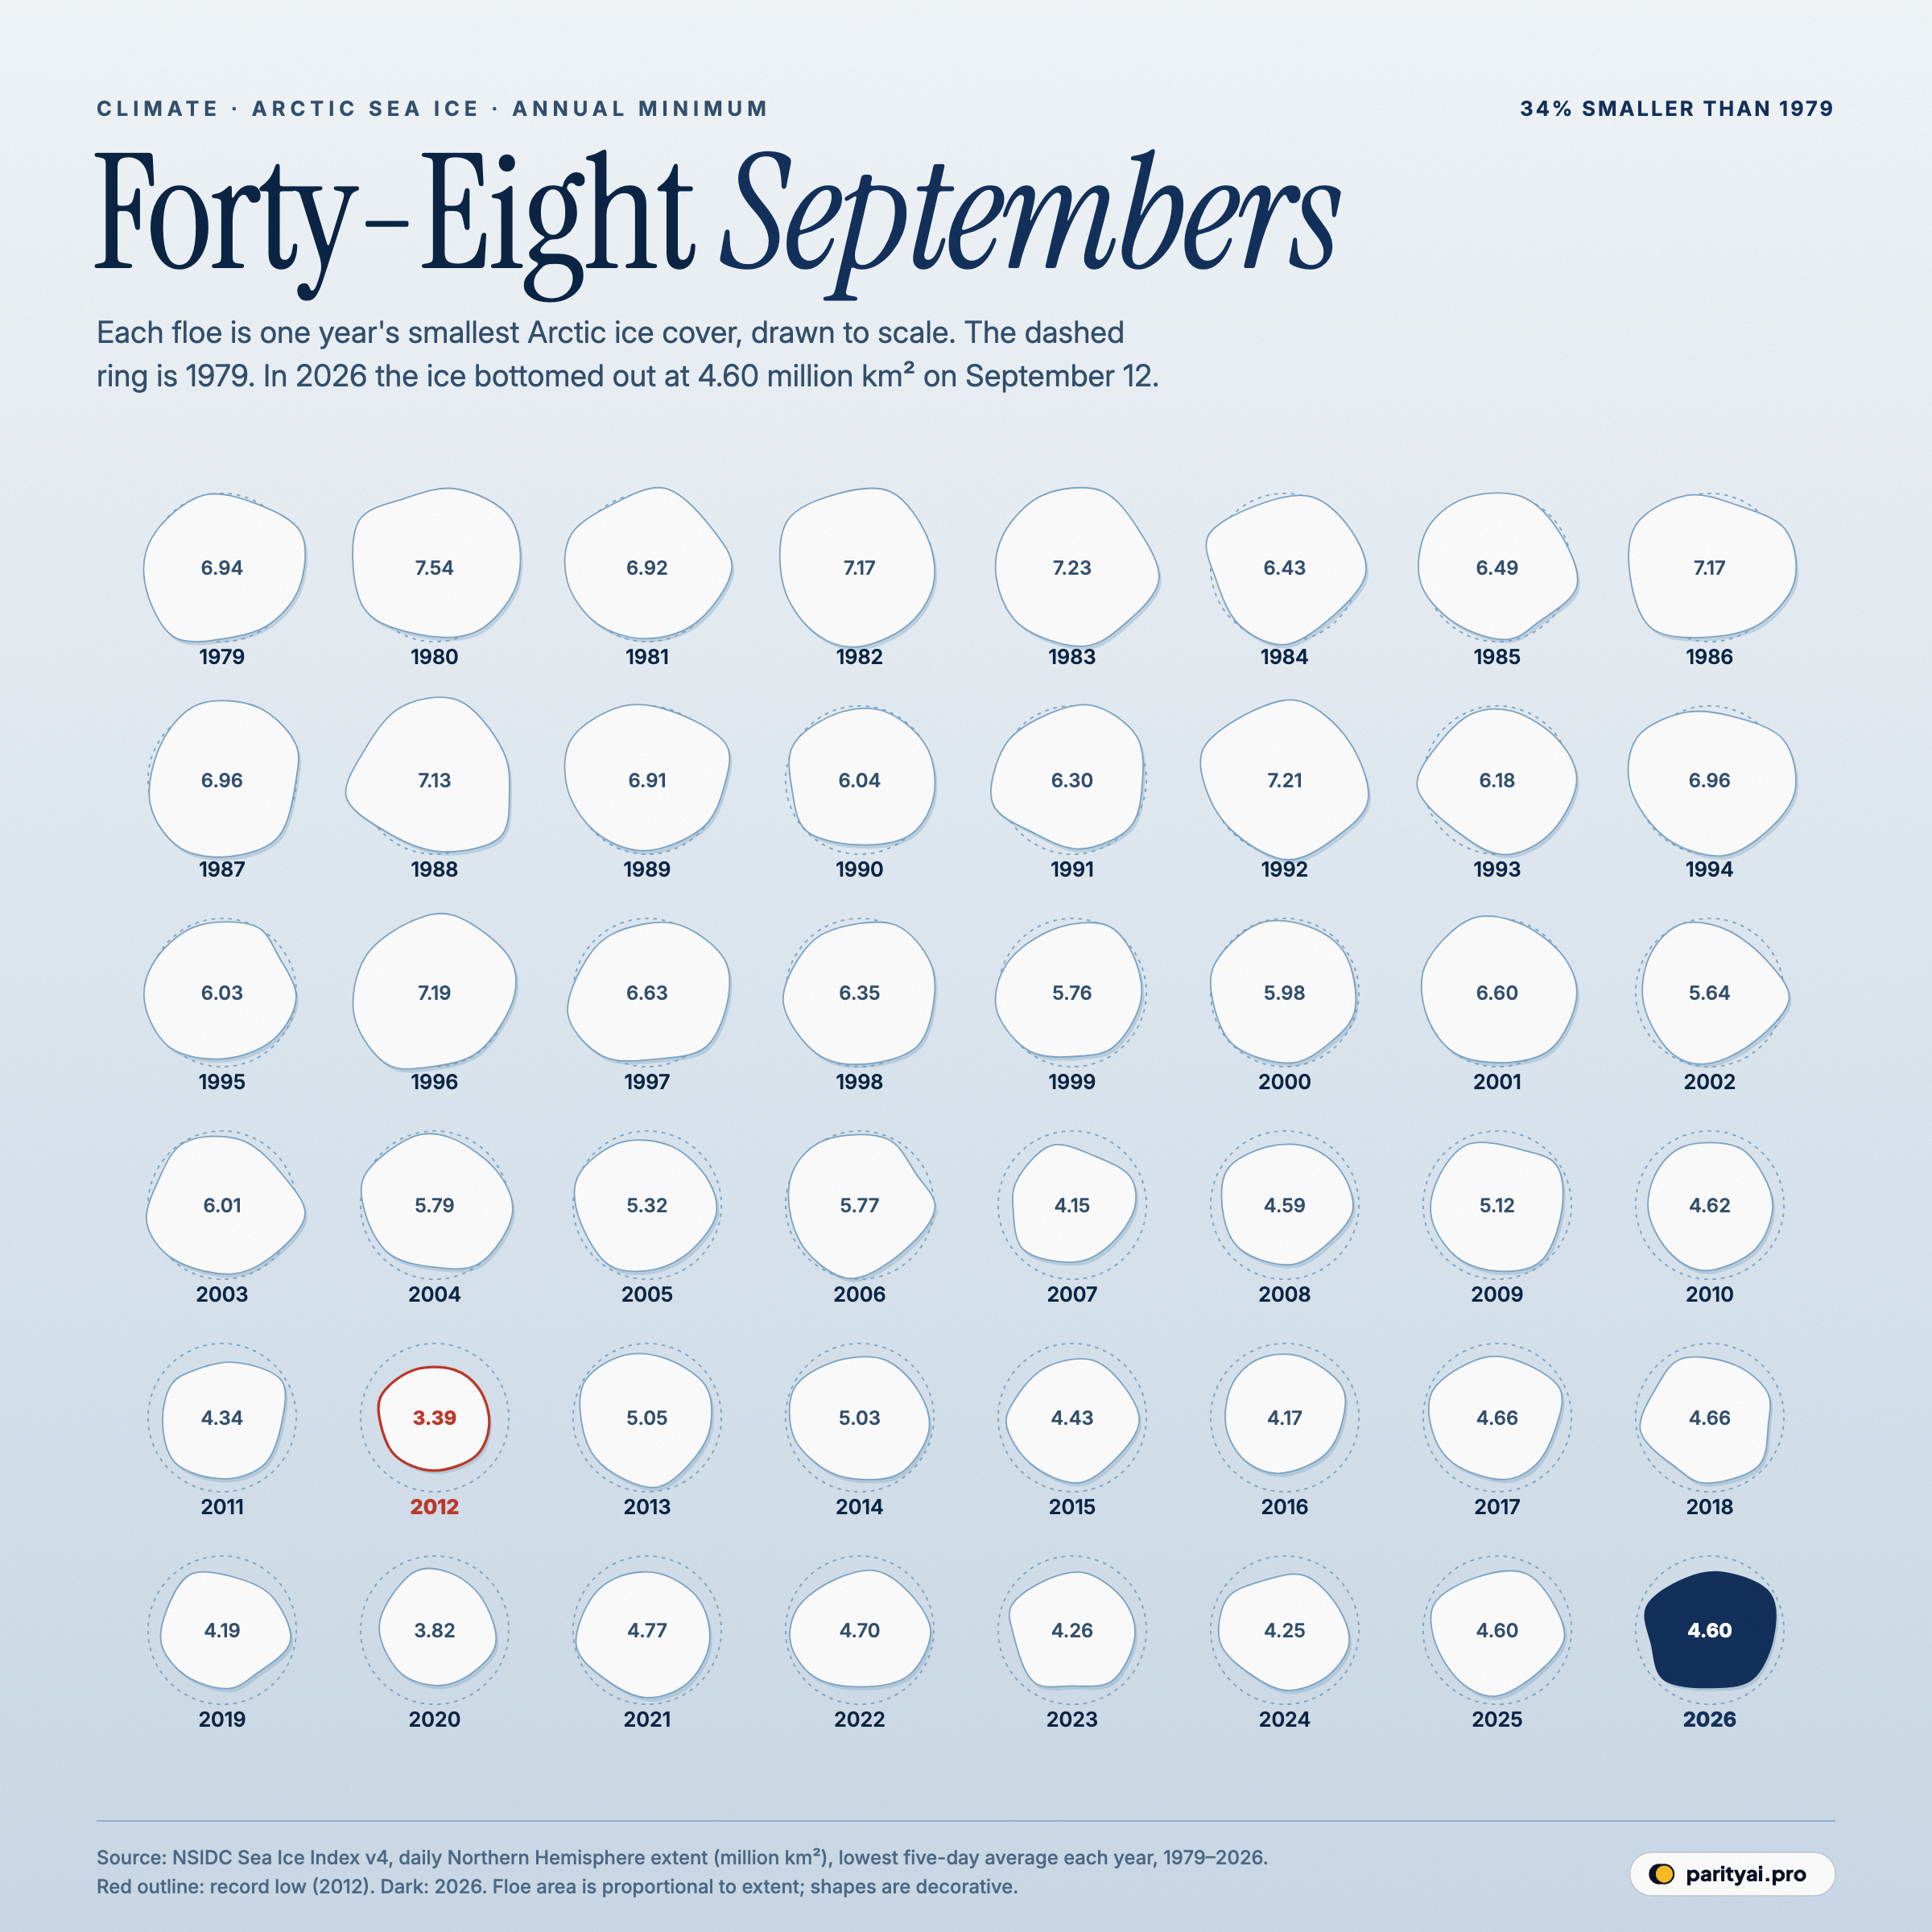
Every summer the Arctic Ocean's ice shrinks, and every September it stops. In 2026 the turning point came on September 12. On that day, according to the National Snow and Ice Data Center, sea ice covered about 4.60 million square kilometres of the northern seas, an area a little larger than the European Union. Then the long polar night began to close in, and the ice started growing back.
The graphic above lays that moment beside every one like it since satellites began watching in 1979. Each of the 48 floes is one September minimum, and its area is drawn exactly in proportion to the ice that was left. The shapes are invented; the sizes are not. A dashed ring around each floe shows how big the 1979 minimum was, so the gap between ring and ice is the loss. The red floe is the record low; the dark one is 2026.
The figures come from NSIDC's Sea Ice Index, the daily satellite record of how much of the Arctic is covered by at least 15% ice. Following NSIDC's convention, each year's minimum is the lowest five-day average. This story is best told through five numbers.
4.60 million km²
This year's minimum was low, but not a record. NSIDC ranked it as tied for the tenth lowest in the satellite era, alongside 2008, 2010 and 2025. Our own calculation from the daily file, which keeps more decimal places, puts it 11th, a difference that comes down to a few thousand square kilometres. Last year's minimum was almost identical at 4.60 million.
That a "middling" year is still this low says a lot. In 1979 the September ice bottomed out at 6.94 million km². The 2026 minimum was 2.34 million km², or 34%, smaller. The ice lost since then is an area larger than Mexico.
The weather did the ice some favours this year. NSIDC described the summer over the Arctic Ocean as cool and stormy, even as global temperatures were at or near record highs in June, July and August. Cool, cloudy summers slow melting. Without that luck, 2026 could have ranked lower.
3.39 million km²
The record low still belongs to 2012, when the minimum reached 3.39 million km² on September 17. On the grid it is the floe outlined in red, visibly smaller than every other.
That year was extreme partly because of a powerful August cyclone that broke up and scattered thin ice. Since then no year has come closer than 431,000 km². The next lowest was 2020, at 3.82 million. That has led some people to claim that Arctic ice "recovered" after 2012.
The grid answers that. Look at the rows instead of the single red floe. Before 2007, no September minimum fell below 5.32 million km². Since 2007, none has risen above 5.12 million. A single record measures how bad the worst year was. The loss in the average year is the more important trend.
20 out of 20
Here is a more telling statistic than any one record. According to NASA, the 20 lowest minimums in the satellite record are the 20 years from 2007 to 2026. Every September since 2007 has been lower than every September before it.
Our decade averages tell the same story. The September minimum averaged 6.99 million km² in the 1980s, 6.46 million in the 1990s, 5.50 million in the 2000s and 4.45 million in the 2010s. So far in the 2020s it has averaged 4.43 million.
Those last two numbers are close. The decline since 2007 has been slower and bumpier than the steep drop before it, which is why the 2010s and the early 2020s look similar. Scientists disagree about how much of the slowdown is natural variability, such as cooler summers, and how much reflects changes in the ice itself. But the range has shifted for good. The highest minimum of the last two decades (5.12 million, in 2009) would have been lower than every minimum recorded before 2000, a sign of how far the whole range has moved down.
11.6% per decade
To set aside the year-to-year noise, scientists fit a straight line through the data. NSIDC puts the downward trend in September Arctic ice at 74,100 square kilometres a year, or 11.6% per decade relative to the 1981–2010 average. Our simple fit to the yearly minimums gives a similar loss of about 73,400 km² a year.
That is like losing an area roughly the size of the Republic of Ireland every year, on average, for almost half a century.
The area figure understates what is happening, because the ice is also getting thinner and younger. NSIDC says that since 2012 the oldest, thickest ice, more than four years old, has almost disappeared, covering 250,000 square kilometres or less each year. The University of Washington's PIOMAS model, which estimates ice volume, found that 2025 had the lowest average volume on record. (Its updates were disrupted in 2026 after a weather reanalysis it relies on was discontinued, so no figure for this summer is available yet.) Thin first-year ice melts more easily, which makes each future summer more vulnerable than the area alone suggests.
The 2030s?
The question everyone asks is when the Arctic will have its first ice-free September. Scientists usually define "ice-free" as less than one million square kilometres, since some ice will cling to the coasts of Greenland and Canada's northern islands long after the open ocean is clear.
The UN climate panel's latest assessment, the IPCC's sixth report, concluded that the Arctic is likely to be practically ice-free in September at least once before 2050, as summarised by the Hong Kong Observatory. A 2023 study in Nature Communications went further. Its authors estimated that the first ice-free September could come as early as the 2030s to 2050s, whatever path emissions take.
On the grid, that future would be a floe less than a sixth the area of the 1979 ring. Even 2012's red floe is far from that size.
Why September, and what counts as ice
The Arctic's sea ice follows the sun. It grows through the dark winter, usually peaking in March at around 14 to 15 million square kilometres, then melts through the summer. The low point comes in September, after months of round-the-clock sunlight and before the autumn freeze takes hold. In this record the minimum has fallen as early as September 5 and as late as September 23. Because September is when the least ice survives, it is the month that shows long-term change most clearly.
"Extent" has a specific meaning. Satellites carrying microwave sensors measure how much of each grid cell, 25 kilometres on a side, is covered by ice. Any cell that is at least 15% ice counts in full toward the extent. It is a deliberately generous measure, because satellites struggle to tell melt ponds on top of the ice from open water. That makes extent a reliable way to compare one year with another, but it is not the same as the area of solid ice. Volume, which also depends on thickness, is harder to measure and is mostly estimated with models.
NSIDC's daily record began in late 1978, so 1979 is the first full September. For the first nine years the satellite reported every other day. That makes the earliest minimums slightly less precise, but not enough to change the pattern on the grid.
The ice that's left is working harder
A smaller ice cap matters beyond the Arctic. Bright ice reflects sunlight; dark open water absorbs it. Each summer with less ice lets the ocean soak up more heat, which helps explain why the Arctic is warming faster than the planet as a whole.
It also changes what is possible at the top of the world. NSIDC noted that this September the Northern Sea Route along Russia's coast appeared largely free of ice, while significant ice remained in the southern route of the Northwest Passage through Canada's islands. Shipping companies, navies and Arctic communities now plan around a summer ocean that was largely closed to ships in 1979.
Meanwhile at the other pole, NSIDC reports that Antarctic sea ice hit its third-lowest winter maximum on record on September 14 and has been at record-low daily levels since October 2. The two poles behave differently, and Antarctic ice was stable or growing for decades. Its recent lows are one of the more worrying surprises in climate science.
| Year | Minimum extent (million km²) | vs 1979 | Date | Rank (1 = lowest) |
|---|---|---|---|---|
| 2026 | ▼ 34% | September 12 | 11 | |
| 2025 | ▼ 34% | September 10 | 12 | |
| 2024 | ▼ 39% | September 14 | 6 | |
| 2023 | ▼ 39% | September 19 | 7 | |
| 2022 | ▼ 32% | September 19 | 16 | |
| 2021 | ▼ 31% | September 16 | 17 | |
| 2020 | ▼ 45% | September 16 | 2 | |
| 2019 | ▼ 40% | September 18 | 5 | |
| 2018 | ▼ 33% | September 23 | 14 | |
| 2017 | ▼ 33% | September 13 | 15 | |
| 2016 | ▼ 40% | September 10 | 4 | |
| 2015 | ▼ 36% | September 9 | 9 | |
| 2014 | ▼ 27% | September 17 | 18 | |
| 2013 | ▼ 27% | September 13 | 19 | |
| 2012 | ▼ 51% | September 17 | 1 | |
| 2011 | ▼ 37% | September 11 | 8 | |
| 2010 | ▼ 33% | September 21 | 13 | |
| 2009 | ▼ 26% | September 13 | 20 | |
| 2008 | ▼ 34% | September 20 | 10 | |
| 2007 | ▼ 40% | September 18 | 3 | |
| 2006 | ▼ 17% | September 17 | 24 | |
| 2005 | ▼ 23% | September 22 | 21 | |
| 2004 | ▼ 16% | September 20 | 25 | |
| 2003 | ▼ 13% | September 18 | 27 | |
| 2002 | ▼ 19% | September 14 | 22 | |
| 2001 | ▼ 5% | September 20 | 35 | |
| 2000 | ▼ 14% | September 12 | 26 | |
| 1999 | ▼ 17% | September 13 | 23 | |
| 1998 | ▼ 8% | September 19 | 32 | |
| 1997 | ▼ 4% | September 23 | 36 | |
| 1996 | ▲ 4% | September 11 | 45 | |
| 1995 | ▼ 13% | September 8 | 28 | |
| 1994 | 0% | September 8 | 40 | |
| 1993 | ▼ 11% | September 9 | 30 | |
| 1992 | ▲ 4% | September 9 | 46 | |
| 1991 | ▼ 9% | September 18 | 31 | |
| 1990 | ▼ 13% | September 22 | 29 | |
| 1989 | ▼ 0% | September 15 | 37 | |
| 1988 | ▲ 3% | September 12 | 42 | |
| 1987 | 0% | September 5 | 41 | |
| 1986 | ▲ 3% | September 10 | 43 | |
| 1985 | ▼ 6% | September 11 | 34 | |
| 1984 | ▼ 7% | September 16 | 33 | |
| 1983 | ▲ 4% | September 10 | 47 | |
| 1982 | ▲ 3% | September 13 | 44 | |
| 1981 | ▼ 0% | September 14 | 38 | |
| 1980 | ▲ 9% | September 5 | 48 | |
| 1979 | – | September 21 | 39 |
Lowest five-day average of daily extent, NSIDC Sea Ice Index v4. Values can differ by 0.01 from NSIDC's published figures. 2026 and the 2012 record are highlighted.
How to read the grid
Read across a row and you see the year-to-year noise: the 1996 floe is bigger than its neighbours, and 2012 is far smaller. Read down a column and you see the trend: in most columns, the bottom rows hold the smallest floes. The variation between years is real, but so is the steady shrinking. A single year, warm or cool, tells you about the weather. Forty-eight of them tell you about the climate. And the climate those floes describe is one where the Arctic Ocean keeps less of its summer ice almost every decade.
Sources and method
- National Snow and Ice Data Center, Sea Ice Index version 4 (G02135), daily Northern Hemisphere extent. Retrieved October 8, 2026
Each year's minimum is the lowest five-day trailing average of daily extent, following NSIDC's convention. Data before 1988 are every other day, so early minimums average fewer readings. Extent counts every grid cell with at least 15% ice cover. Floe areas are drawn exactly proportional to extent; their outlines are decorative.
Charts like this, from your own numbers.
Connect a spreadsheet or the tools you run on, and Parity builds the dashboard and writes the report, with every number checked.
Try Parity free

