Charts like this, from your own numbers.
Connect a spreadsheet or the tools you run on, and Parity builds the dashboard and writes the report, with every number checked.
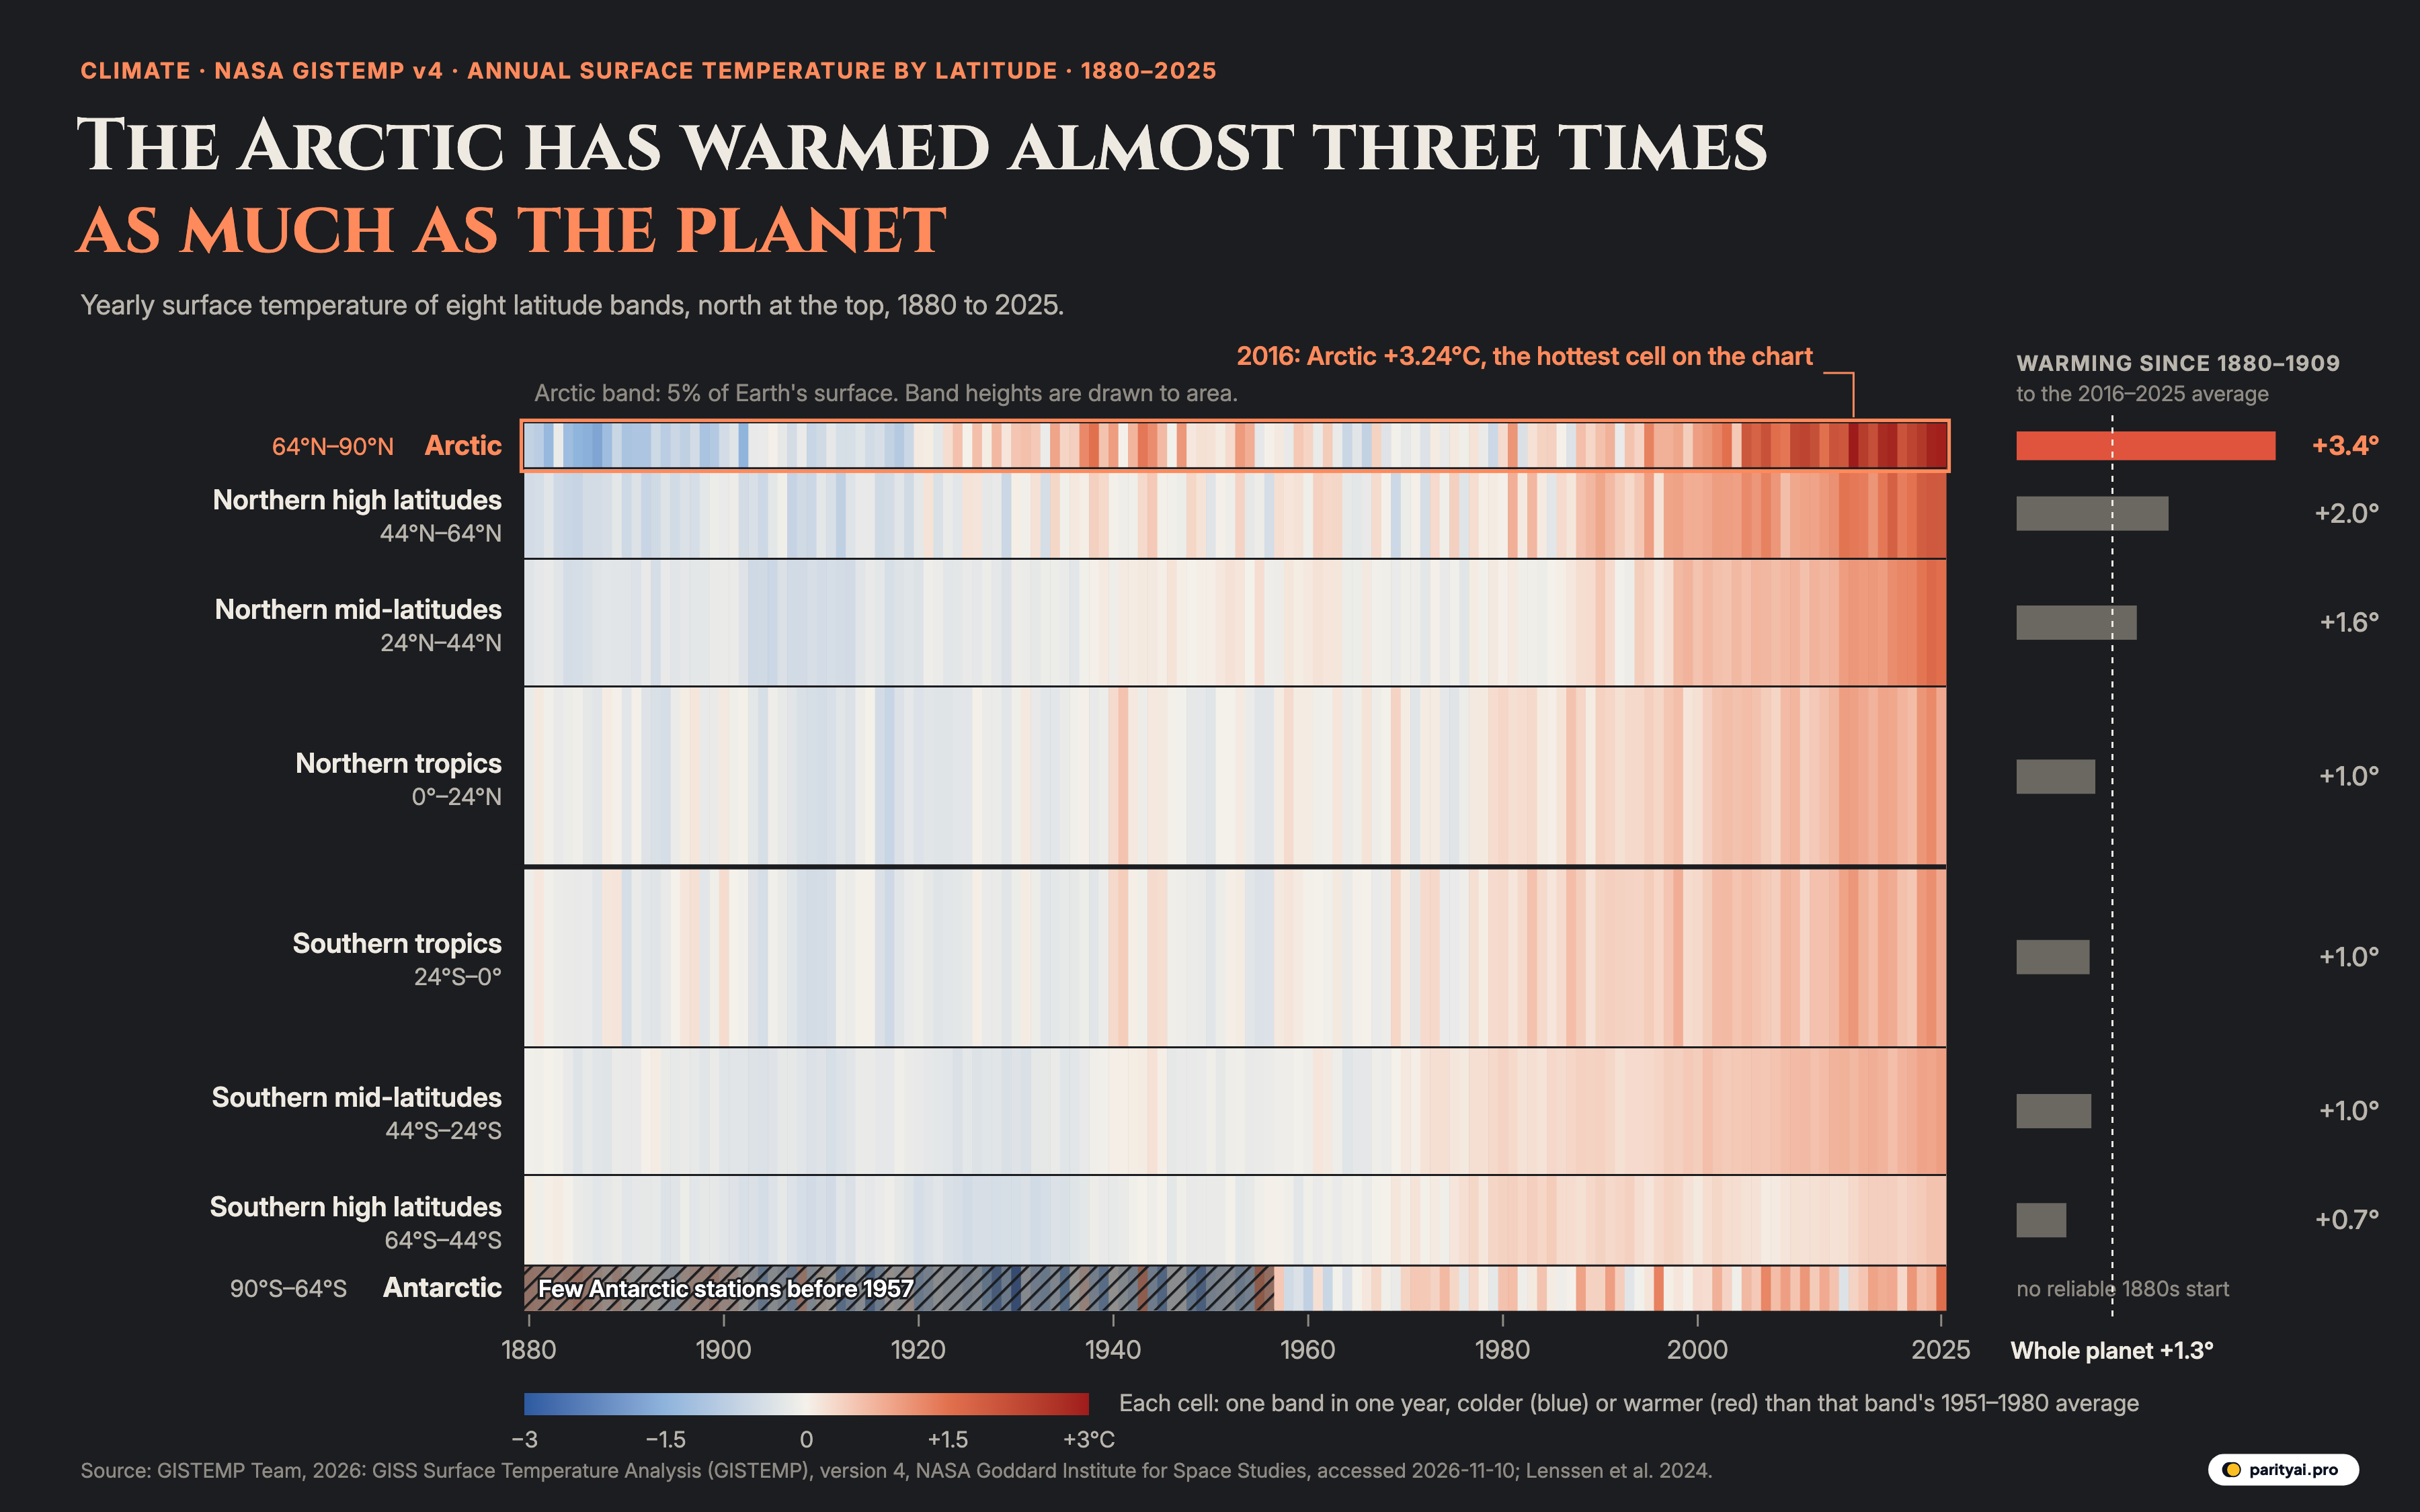
Try Parity freeThe darkest red square in the graphic above sits in the top strip, near the right edge. It is the Arctic in 2016, when the land and sea north of 64°N averaged 3.24°C warmer than they had in a typical year between 1951 and 1980. NASA's table behind the chart holds 1168 cells, one for each of eight latitude bands in each of 146 years from 1880 to 2025, and that one is the warmest of them all. The second-warmest is also Arctic. So is the third.
The table is the zonal means file from NASA's GISS Surface Temperature Analysis, version 4, known as GISTEMP. NASA's Goddard Institute for Space Studies builds it from weather-station records in NOAA's GHCN v4 and sea surface temperatures in ERSST v5, and updates it "about the 10th of every month". For each band it gives one number per year: how far that year's average surface temperature was above or below the band's own 1951–1980 average.
How the chart is drawn
Time runs from left to right. The eight bands are stacked from the North Pole at the top to the South Pole at the bottom, and the thick dark line is the equator. Each band is drawn as tall as its share of Earth's surface. Latitude circles crowd together towards the poles, so the Arctic band, from 64°N to the pole, covers only 5.1% of the planet. Each of the two tropical bands covers 20.3%. That is why the top and bottom strips are thin and the middle is wide. Colour shows the anomaly: blue for colder than the band's 1951–1980 average, near-white for about the same, red for warmer. The bars on the right compare the average of 2016–2025 with the average of 1880–1909, and the dashed line marks the whole planet's warming over the same span, 1.27°C.
Since every band has warmed, the useful question is how much each one warmed and when. Rather than walk through the chart band by band in an atlas voice, what follows is a set of short letters, one to each strip of latitude, reading its own record back to it. The last letter goes to whoever reads the chart next, because a chart like this has limits that should be stated.
| # | Latitude band | Latitudes | Share of Earth's surface | Five-year means, 1880–2025 | Warming, 1880–1909 to 2016–2025 (°C) | Warmest year |
|---|---|---|---|---|---|---|
| 1 | Arctic | 64°N–90°N | 2016 (+3.24) | |||
| 2 | Northern high latitudes | 44°N–64°N | 2024 (+1.95) | |||
| 3 | Northern mid-latitudes | 24°N–44°N | 2024 (+1.64) | |||
| 4 | Northern tropics | 0°–24°N | 2024 (+1.22) | |||
| 5 | Southern mid-latitudes | 44°S–24°S | 2025 (+0.97) | |||
| 6 | Southern tropics | 24°S–0° | 2024 (+1.16) | |||
| 7 | Antarctic | 90°S–64°S | 2025 (+1.56) | |||
| 8 | Southern high latitudes | 64°S–44°S | 2025 (+0.55) |
GISTEMP v4 annual anomalies vs each band's 1951–1980 mean. For comparison, the whole planet warmed +1.27°C between the same two periods.
To the Arctic, 64°N to the pole
You started this record cold. Your average for 1880–1909 was −0.80°C against your mid-century baseline, and your coldest year on the chart was 1887, at −1.73°C. For a while you looked like any other band, only noisier. Between 1951 and 1980 your yearly values had a standard deviation of 0.40°C, against 0.18°C for the northern tropics and 0.11°C for the planet as a whole. You swing more than the other bands do, and that is worth remembering before reading too much into any single one of your years.
You had one early warm spell. In 1938 you reached 1.52°C above your baseline, a level no year after 1950 matched until 2005. 19 years have beaten it since, starting with that one. The early peak was real in the record, and the 1960s and 1970s cooled back to about your baseline; your 1970s averaged −0.14°C.
Then you pulled away from everyone. You first passed 2°C above your baseline in 2007. You have now done it in 15 years, and in all 10 of the years from 2016 to 2025. No other band on the chart has reached 2°C even once. Every one of your years since 1993 has been above your baseline. Your ten warmest years all fall in 2010 or later. Your record is still 2016, at 3.24°C, and 2025 came close at +2.93°C.
Put your two endpoints together and you warmed 3.43°C between 1880–1909 and 2016–2025. The planet warmed 1.27°C. That is 2.7 times as much, which is where the headline comes from. On the shorter window since 1979 your trend is 0.67°C per decade, 3.3 times the global 0.21°C.
You may have heard a bigger number. A 2022 study led by the Finnish Meteorological Institute found that the Arctic "has warmed at a rate that is nearly four times faster than the world on average" since 1979, according to the University of Eastern Finland. That study drew your border at the Arctic Circle, not at 64°N, and covered the 43 years from 1979, so its ratio and the one here measure slightly different things. The same work found the Barents Sea warming at "seven times above the global mean", and found that climate models underestimate how much faster you warm. NOAA's Arctic Report Card 2025 says your October 2024 to September 2025 was "the warmest recorded since 1900" and that "the last 10 years are the 10 warmest on record". Every source agrees on the direction. They differ only on the multiple.
Part of the reason, the National Snow and Ice Data Center explains, is ice. Sea ice has "a much higher albedo" than water, so as it retreats "the darker open oceans absorb more solar energy", which melts more ice. You lose your reflective lid and take in more heat.
| Decade | Arctic (°C) | Whole planet (°C) | Arctic minus planet |
|---|---|---|---|
| 1880s | ▼ 1.11 | ▼ 0.21 | |
| 1890s | ▼ 0.88 | ▼ 0.24 | |
| 1900s | ▼ 0.42 | ▼ 0.31 | |
| 1910s | ▼ 0.53 | ▼ 0.33 | |
| 1920s | ▲ 0.21 | ▼ 0.24 | |
| 1930s | ▲ 0.64 | ▼ 0.12 | |
| 1940s | ▲ 0.63 | ▲ 0.04 | |
| 1950s | ▲ 0.25 | ▼ 0.05 | |
| 1960s | ▼ 0.12 | ▼ 0.03 | |
| 1970s | ▼ 0.14 | ▲ 0.03 | |
| 1980s | ▲ 0.24 | ▲ 0.25 | |
| 1990s | ▲ 0.62 | ▲ 0.39 | |
| 2000s | ▲ 1.42 | ▲ 0.59 | |
| 2010s | ▲ 2.29 | ▲ 0.80 | |
| 2020–2025 | ▲ 2.60 | ▲ 1.06 |
Decade means of annual anomalies vs the 1951–1980 baseline. The 2020s cover six years. Bars are drawn only where the Arctic was warmer than the planet.
To the northern high latitudes, 44°N to 64°N
You are the band of Scandinavia, most of Canada and Russia, and the northern edge of the United States, and you hold second place on this chart. You warmed 2.01°C between the two periods, 1.6 times the global figure. Your first year more than 1°C above your baseline was 2005; every year since 1986 has been above it. Your record is recent, 2024 at 1.95°C, and 2025 was within a few hundredths of it at +1.94°C. All ten of your warmest years fall between 2015 and 2025.
You sit just below the Arctic and share some of its habits: lots of land, plenty of snow, big swings between years. If anyone asks why the northern half of the planet has warmed more than the southern, you are a large part of the answer. The Northern Hemisphere as a whole warmed 1.61°C between the two periods; the Southern Hemisphere, 0.92°C.
To the northern mid-latitudes, 24°N to 44°N
You hold the Mediterranean, the Middle East, most of China, the southern United States and the Sahara's northern edge, and 14.4% of Earth's surface. Your warming was 1.59°C, the third-largest on the chart. You did not see a year 1°C above your baseline until 2016. Since then the threshold has become ordinary. Your ten warmest years, warmest first, are 2024, 2025, 2023, 2022, 2021, 2020, 2016, 2018, 2017, 2015: every one of them since 2015.
Your trend since 1979 is 0.32°C per decade, close to the 0.34°C of the band above you and well ahead of the planet's 0.21°C. Over the full span you warmed 1.3 times as much as the planet did.
| Latitude band | Trend 1979–2025 (°C per decade) | Times the global pace | 2025 anomaly (°C) | Every year above baseline since |
|---|---|---|---|---|
| Arctic | 3.3× | +2.93 | 1993 | |
| Northern high latitudes | 1.6× | +1.94 | 1986 | |
| Northern mid-latitudes | 1.5× | +1.53 | 1994 | |
| Northern tropics | 0.8× | +0.85 | 1977 | |
| Southern tropics | 0.7× | +0.85 | 1977 | |
| Southern mid-latitudes | 0.7× | +0.97 | 1970 | |
| Southern high latitudes | 0.0× | +0.55 | 1975 | |
| Antarctic | 0.7× | +1.56 | 2016 | |
| Whole planet | 1.0× | +1.18 | 1977 |
Least-squares slope of annual anomalies, 1979–2025. 'Every year above baseline since' is the first year of the unbroken run of positive anomalies that reaches 2025.
To the tropics, 24°N to 24°S
There are two of you on the chart, north and south of the equator, and you are almost twins. Together you cover 41% of the planet, which is why you take up so much of the picture. The north warmed 1.04°C and the south 0.97°C between the two periods, a little less than the global 1.27°C. Your trends since 1979 are 0.17°C and 0.14°C per decade.
Your colours are paler than the Arctic's, but that does not mean you have changed less in a way that matters. Your year-to-year swings are small: your standard deviation in the baseline years was 0.18°C in the north, less than half the Arctic's. A quieter band does not need to move as far to leave its old range. Every one of your years since 1977 has been above your baseline, in both halves.
Your records are both 2024: 1.22°C in the north and 1.16°C in the south. In 2025 both of you fell back to +0.85°C. That drop of 0.37°C in the north from one year to the next is one of the larger moves on your rows in recent years, and it is why the right edge of your strips looks slightly lighter than the column before it. This piece does not try to explain that drop; a single year in the tropics swings with the Pacific, and one year is not a trend.
To the southern mid-latitudes, 24°S to 44°S
You are mostly water: the southern Atlantic, Indian and Pacific Oceans, with much of Australia, southern Africa and the middle of South America. You warmed 0.99°C, the same as the tropics within rounding, and you have never had a year 1°C above your baseline. Your record is 2025, at 0.97°C.
You do hold one record of your own. Every year since 1970 has been above your 1951–1980 average. That is the longest unbroken warm run of any band on the chart; the planet's run starts in 1977 and the Arctic's in 1993. You warmed slowly, but you warmed steadily, and you have not had a cool year in more than half a century.
To the southern high latitudes, 44°S to 64°S
You are the Southern Ocean almost everywhere, with Patagonia and the southern end of New Zealand's South Island at your northern edge. You warmed least of all the bands, 0.66°C, about 0.5 times the global figure. The Arctic warmed 5.2 times as much as you did. Your trend since 1979 is 0.01°C per decade, close to flat. Your ten warmest years, warmest first, are 2025, 2024, 2023, 1985, 1983, 2018, 2019, 2022, 2020, 1981, which means three years from the early 1980s still stand in your top ten.
There is a sourced explanation for your patience. Research led by Kyle Armour, summarised by Carbon Brief, found that "the deep waters that are drawn up – 'upwelled' – to the surface of the Southern Ocean are quite old", so they "haven't yet been exposed to the warmer atmosphere". Your surface keeps being refreshed from below by water that left the surface long ago.
Even so, your last three years, 2025, 2024 and 2023, are your three warmest, in that order. Your record is 0.55°C, set in 2025.
To the Antarctic, 64°S to the pole
Your strip is the hardest to read honestly, and the chart hatches your left side for that reason. Before 1957 there were very few thermometers on or near you. The longest record in the region comes from Orcadas, on the South Orkney Islands, which has had "daily surface meteorological observations since April 1903", according to a study of the station, and Orcadas sits at about 61°S, outside your band. A wider network arrived with the International Geophysical Year: P. D. Jones counted data from "nearly twenty stations for the period since the International Geophysical Year 1957" in a 1995 paper. Your early values on the chart swing wildly, down to −2.59°C in 1930, the coldest cell anywhere on the chart, and they should be read as rough at best. That is also why your bar on the right is left empty: there is no trustworthy 1880–1909 average to measure from.
From 1957 the picture is steadier. Your trend since then is 0.14°C per decade, a little slower than the planet's over the same years. But 2025 broke your record by a wide margin: 1.56°C, against 1.32°C in 1996, the second-warmest year in your row. Every year since 2016 has been above your baseline. One record year in a band this variable is not a trend, and your year-to-year standard deviation since 1957 is 0.47°C. It is worth watching all the same.
To whoever reads this chart next
Four warnings, so that the colours are not asked to say more than they can.
The baseline is local and arbitrary. Each band is compared with its own 1951–1980 average, a period GISS uses because "a fixed base period yields anomalies that are consistent over time", and which its FAQ says "is specific to GISS, not universal". The colours therefore show change within a band, not how hot a band is. A red Arctic cell is still far colder than a pale tropical one. Choosing another baseline would shift all the colours in a row up or down but would not change the warming bars, which compare two periods.
The uncertainty is larger than the colours suggest. GISS puts the uncertainty of annual global means after 1960 at "about ±0.05°C". The bands are smaller areas built from fewer stations, and the team's 2024 uncertainty ensemble notes regions "where station sparsity and other systematic issues contribute to greater uncertainty". The early decades, and both polar bands, carry the widest error bars.
The poles are partly estimated. GISTEMP lets each station inform grid cells up to 1,200 km away, with its weight "linearly decreasing to 0" at that distance, as its method page describes. That is how it reaches the Arctic Ocean, where buoys and coastal stations are few, and over sea ice it cannot use water temperatures, because there "water temperature will stay at the freezing level". The UCAR Climate Data Guide credits the method with "nearly full coverage of the arctic", and lists "incomplete spatial coverage of the land and sea ice surface" among its weaknesses.
Zonal means hide geography. A band is a ring around the whole planet, averaged into one number per year. The Barents Sea and the Canadian Archipelago share a row; so do the Sahara and the Gulf of Mexico. The chart tells you which latitudes changed most, not which places. And GISS revises the past slightly every month as late reports arrive, so the numbers here are a snapshot of the file as downloaded on November 10, 2026.
A last line to the Arctic
The reason this chart reads as a single sentence is that you are drawn to scale. You are the thinnest strip on the page, 5.1% of the surface of the Earth, and still the one the eye goes to first. The other bands have warmed too, all of them, and seven of the eight set their records in 2024 or 2025. Yours stands from 2016, and 2025 came within a third of a degree of it. You are not the exception to what the rest of the planet is doing. You are the same thing, almost three times over.
Sources and method
- GISTEMP Team, 2026: GISS Surface Temperature Analysis (GISTEMP), version 4. NASA Goddard Institute for Space Studies. Dataset accessed 2026-11-10 at https://data.giss.nasa.gov/gistemp/. Zonal annual means, land-ocean temperature index (ZonAnn.Ts+dSST.csv), 1880–2025. NASA science data, released without restrictions on use (CC0 unless marked otherwise). Use does not imply NASA endorsement.
- Lenssen, N., G.A. Schmidt, M. Hendrickson, P. Jacobs, M. Menne, and R. Ruedy, 2024: A GISTEMPv4 observational uncertainty ensemble. J. Geophys. Res. Atmos., 129, no. 17, e2023JD040179. The current GISTEMP v4 reference publication, cited at NASA GISS's request.
Values are GISTEMP v4 annual mean surface temperature anomalies (land stations from NOAA GHCN v4 and sea surface temperatures from ERSST v5), in °C relative to each band's own 1951–1980 average, as published by NASA GISS in its zonal means table. We use the eight non-overlapping latitude bands and the global mean. Band heights in the graphic are proportional to each band's share of Earth's surface (the sine of the northern edge minus the sine of the southern edge, halved). 'Warming' compares the average of 1880–1909 with the average of 2016–2025. Trends are ordinary least-squares slopes of annual values. Antarctic values before 1957 rest on very few stations, mostly on its edges, and are shown hatched. GISS revises past values slightly each month as late reports and corrections arrive.
Charts like this, from your own numbers.
Connect a spreadsheet or the tools you run on, and Parity builds the dashboard and writes the report, with every number checked.
Try Parity free

