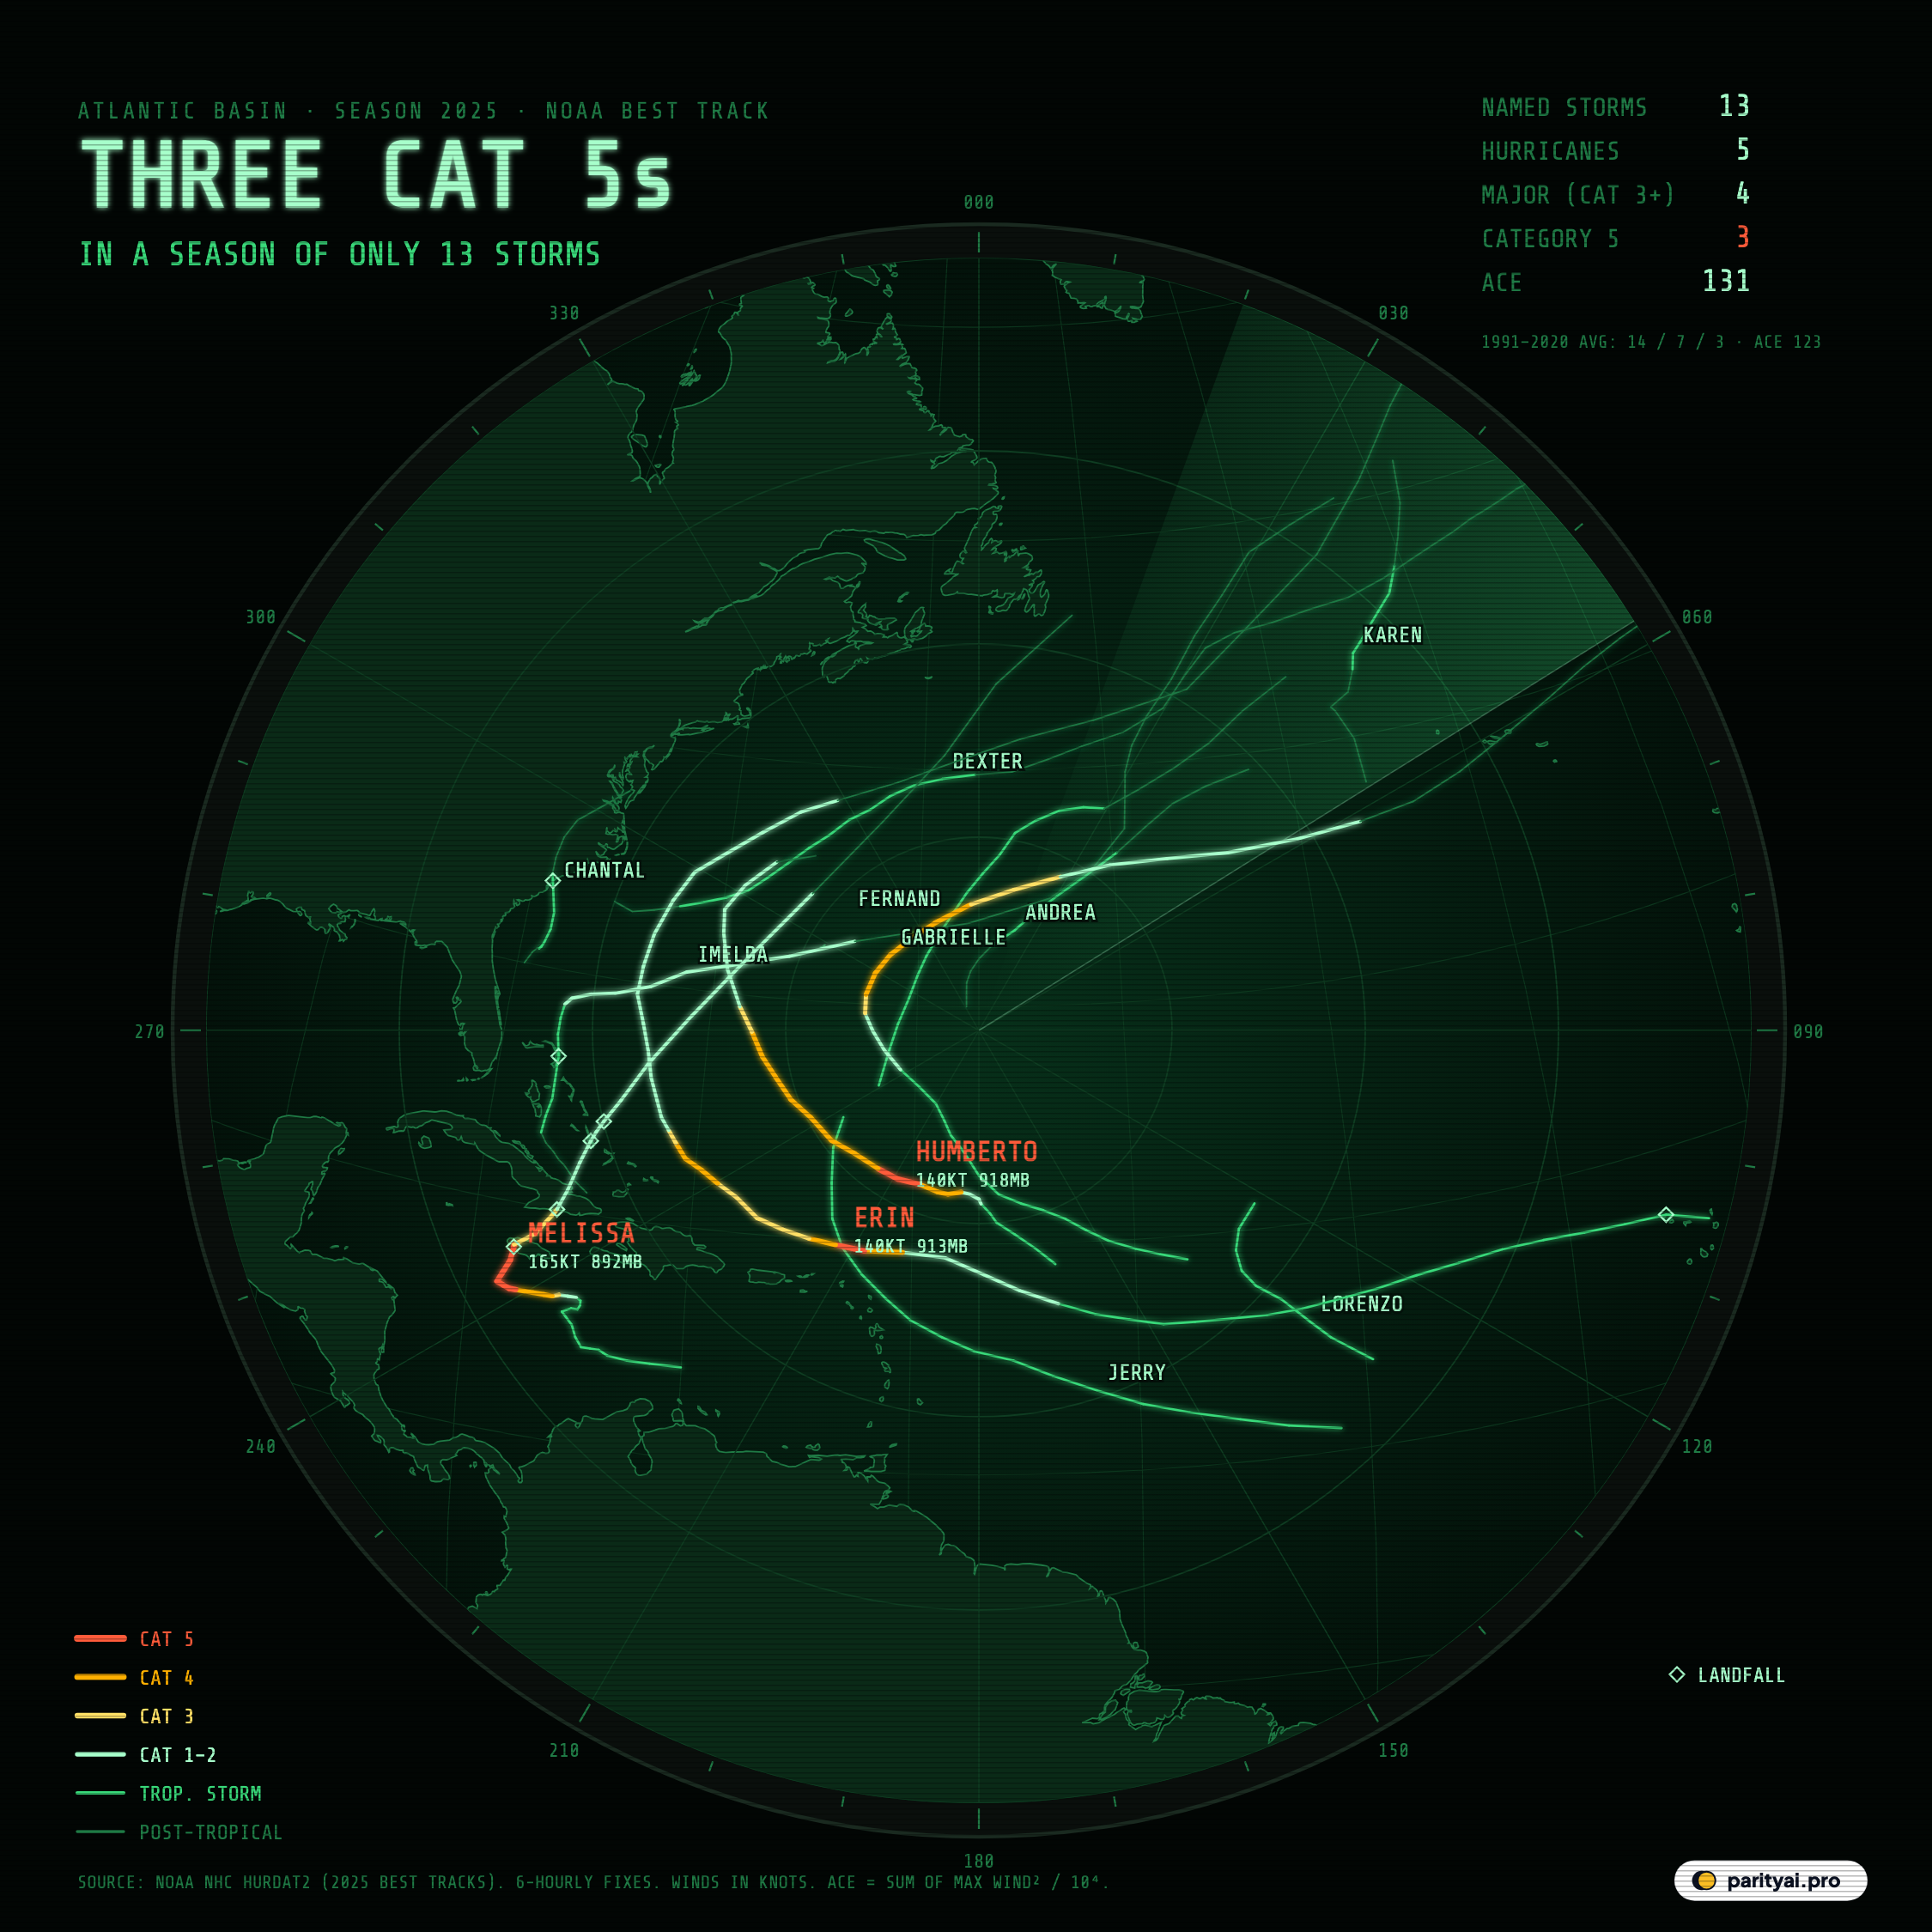
Eight hundred ninety-two millibars. That was the lowest air pressure measured at the centre of Hurricane Melissa on October 28, 2025, shortly before it struck Jamaica. The lower the pressure at a hurricane's eye, the stronger the storm. Only two Atlantic hurricanes in the record have gone lower. Melissa was the season's last storm, and its fiercest.
The 2025 Atlantic hurricane season was, by most counts, a quiet one. Only 13 named storms formed, fewer than the 1991–2020 average of 14.4, and only 5 became hurricanes, against an average of 7.2. Yet 3 of those storms reached Category 5, the top of the Saffir-Simpson scale. Since records began in 1851, the only other season with three or more was 2005 (4), 2025 (3).
The radar screen above plots every track in the National Hurricane Center's post-season best-track database, HURDAT2, with positions every six hours. The colour of each segment shows the storm's strength at that moment, from deep green for depressions through amber for Category 4 to red for Category 5. Small diamonds mark landfalls. The faint lines in the north-east are storms that had lost their tropical character and become ordinary mid-latitude systems. The sweep, the range rings and the bearing ticks are decoration; the tracks are data.
This article goes through the season the way a forecaster's file would: one case at a time, starting with the three storms that reached Category 5.
Case file 1: Erin
August 11 – August 27. Peak 140 knots (160 mph), 913 mb.
Erin formed off Africa in mid-August and became the season's first hurricane. What made it remarkable was its speed. In the National Hurricane Center's final report, Erin's maximum winds increased by 45 knots in just 12 hours on August 16, and its central pressure fell by 4.5 millibars an hour. By that evening it was a Category 5 hurricane north of the Leeward Islands, with peak winds of 140 knots and a pressure of about 913 mb.
On the radar, Erin's track is the long amber-and-red arc that curves north of the Caribbean, then up between the US East Coast and Bermuda before heading out to sea. Its only landfall came early in its life, in the Cape Verde Islands, while it was still a tropical storm. As a hurricane it stayed offshore, but its size churned up dangerous surf along the US coast. The NHC report attributes 13 deaths directly to the storm. By the season's measure of total energy, accumulated cyclone energy or ACE, Erin produced 31.8 units, the second-highest of any storm in 2025.
Case file 2: Humberto
September 24 – October 1. Peak 140 knots (160 mph), 918 mb.
Humberto spent its whole life over open water in the central Atlantic, and that is where its short red segment appears on the scope. It intensified quickly in late September and reached Category 5 on September 27, with winds of 140 knots, well north-east of the Caribbean. Imelda was forming to its west at the same time, and the two storms ran north side by side for several days. Humberto never threatened land, which is why few people outside the weather community remember it. Yet in the full record since 1851, it is one of only 44 Atlantic hurricanes to reach Category 5.
Case file 3: Melissa
October 21 – November 1. Peak 165 knots (190 mph), 892 mb.
Melissa is the red hook in the western Caribbean. Its track shows it creeping west for days in the waters south of Jamaica, strengthening from a tropical storm to a Category 5 hurricane over warm water, before turning north. The NHC's operational discussion that afternoon reported that the eye made landfall in western Jamaica around midday local time on October 28. It estimated maximum winds of 160 knots and a pressure near 892 mb, and called Melissa "among the strongest ever recorded in the Atlantic basin."
The post-season review raised its peak further. The best-track data now list 165 knots, about 190 mph. According to reporting on the final NHC report, that ties Hurricane Allen of 1980 for the strongest winds in the Atlantic record. The same report counted 95 deaths across the region, including 45 in Jamaica, and put Jamaica's damage at about $8.8 billion, roughly 41% of the island's 2024 economic output. The best-track data then record a second landfall in eastern Cuba early on October 29, and two more in the Bahamas, before Melissa raced north-east out to sea.
Melissa alone produced 26% of the whole season's accumulated cyclone energy, and the three Category 5 storms together accounted for 71%.
Case file 4: the near-misses and the quiet ones
The rest of the season's tracks are mostly green.
Gabrielle (September 17 – September 28) was the season's other major hurricane, reaching 120 knots, Category 4, over the open Atlantic before crossing the Azores and, by then post-tropical, moving into Portugal. Imelda (September 26 – October 6) crossed the northern Bahamas as a tropical storm, then strengthened and curved past Bermuda on October 1. The best-track data list its peak at 80 knots, a strong Category 1, though it was described as a Category 2 when it passed the island.
The other named storms stayed tropical storms. Andrea, the first, formed on June 22 far out in the central Atlantic. Barry came ashore in Mexico as a depression, and Chantal made landfall in South Carolina as a tropical storm on July 6, the season's only US landfall by a named storm. Dexter, Fernand, Jerry, Karen and Lorenzo spent their lives mostly over open water.
Case file 5: the landfall that didn't happen
The most unusual fact about 2025 may be what is missing from the map. According to NOAA, no hurricane made landfall in the continental United States, the first season without one since 2015. Look at the radar: the strongest tracks all curve away from the US coast, out into the Atlantic or through the Caribbean. Erin came closest, passing several hundred miles offshore.
Hurricanes don't steer themselves. They are carried by the large-scale winds around them, and in 2025 those winds turned the strongest storms north and out to sea before they reached the US coast. Jamaica, Cuba and the Bahamas, which lay in Melissa's path, had no such luck.
Case file 6: the energy count
Counting storms is one way to measure a season. Measuring their energy is another. ACE adds up the square of each storm's maximum wind every six hours while it is a tropical storm or hurricane, so long-lived, intense storms count for much more than brief, weak ones.
By that measure, 2025 was above average despite its low storm count. Our calculation from the best-track data gives 131 units, against a 1991–2020 average of 123. A few very powerful storms did the work of many weak ones, the same "few do most of it" pattern that appears in our analysis of earthquakes.
| Storm | Dates | Peak | Lowest pressure | Category | Energy (ACE) | Landfalls |
|---|---|---|---|---|---|---|
| Andrea | Jun 22 – Jun 25 | 35 kt (40 mph) | 1014 mb | Tropical storm | – | |
| Barry | Jun 28 – Jun 30 | 40 kt (45 mph) | 1006 mb | Tropical storm | 1 | |
| Chantal | Jul 4 – Jul 7 | 50 kt (60 mph) | 1002 mb | Tropical storm | 1 | |
| Dexter | Aug 2 – Aug 13 | 50 kt (60 mph) | 988 mb | Tropical storm | – | |
| Erin | Aug 11 – Aug 27 | 140 kt (160 mph) | 913 mb | Category 5 | 1 | |
| Fernand | Aug 23 – Aug 28 | 50 kt (60 mph) | 999 mb | Tropical storm | – | |
| Gabrielle | Sep 17 – Sep 28 | 120 kt (140 mph) | 944 mb | Category 4 | – | |
| Humberto | Sep 24 – Oct 1 | 140 kt (160 mph) | 918 mb | Category 5 | – | |
| Imelda | Sep 26 – Oct 6 | 80 kt (90 mph) | 966 mb | Category 1 | 1 | |
| Jerry | Oct 7 – Oct 11 | 55 kt (65 mph) | 1000 mb | Tropical storm | – | |
| Karen | Oct 8 – Oct 11 | 40 kt (45 mph) | 996 mb | Tropical storm | – | |
| Lorenzo | Oct 13 – Oct 15 | 50 kt (60 mph) | 1000 mb | Tropical storm | – | |
| Melissa | Oct 21 – Nov 1 | 165 kt (190 mph) | 892 mb | Category 5 | 4 |
Peak winds are NOAA best-track maximum sustained winds; mph rounded to the nearest 5. Landfalls count best-track landfall points, including islands. Season ACE: 131 (1991–2020 average: 123).
How a best track is made
The lines on this radar aren't the forecasts people saw at the time. They are the National Hurricane Center's best tracks: its final, carefully reviewed estimate of where each storm was and how strong it was every six hours. After each season, forecasters go back over everything: satellite images, measurements from hurricane-hunter aircraft that fly into the eye, ocean buoys, weather stations, radar and damage surveys. They then publish a tropical cyclone report for every storm.
That review can change the story. Melissa's peak winds were raised after the season. Imelda was described as a Category 2 hurricane near Bermuda, but its best-track peak sits just below that, at Category 1. Storms can also gain or lose a day at either end as forecasters decide exactly when they became, or stopped being, tropical. Our counts and energy figures use the final data, so they can differ slightly from numbers reported during the season.
The best-track file goes back to 1851. Its early decades are far less complete: before aircraft and satellites, a storm that stayed at sea could go unnoticed. That's why comparisons in this article use the 1991–2020 average, a period that is well observed.
What it means, and what came next
Three Category 5 storms in a below-average season is a pattern scientists have been warning about. A warmer ocean doesn't necessarily mean more hurricanes, but it raises the ceiling on how strong they can get and how fast they can intensify. Erin's 45-knot jump in 12 hours and Melissa's slow strengthening over warm Caribbean water are the textbook version.
The 2026 season has been even quieter so far, partly because of a strengthening El Niño, which tends to shear apart Atlantic storms. The first hurricane of 2026, Isaias, didn't form until October 8, the latest first hurricane in more than a century, according to CBS News. Quiet seasons can still produce a single devastating storm, as Melissa showed. On the radar, it only takes one red line.
Sources and method
- NOAA National Hurricane Center, Atlantic hurricane database (HURDAT2), 1851–2025. Best-track file released September 2026, retrieved October 9, 2026
- Natural Earth land (via world-atlas)
Tracks are NOAA's post-season best-track positions, every six hours, with maximum sustained winds in knots. Categories use the Saffir-Simpson scale (Category 5 is 137 knots or more). Accumulated cyclone energy (ACE) adds the square of the maximum wind, in units of 10⁴ kt², for each six-hourly fix at which a system was a tropical or subtropical storm or hurricane. Long-term averages are calculated from the same database for 1991–2020.
Charts like this, from your own numbers.
Connect a spreadsheet or the tools you run on, and Parity builds the dashboard and writes the report, with every number checked.
Try Parity free

