Charts like this, from your own numbers.
Connect a spreadsheet or the tools you run on, and Parity builds the dashboard and writes the report, with every number checked.
Try Parity freePut $6.22 in your pocket. That is what a Big Mac cost in the United States in July 2026, according to the latest edition of The Economist's Big Mac index. Now spend it abroad. At a counter in Indonesia the same banknotes, changed at the market rate, become 112,364 rupiah, and the burger costs 43,000. You walk out with a Big Mac and $3.84 still in your pocket. Carry the same $6.22 to Switzerland and it buys 5.02 francs, against a menu price of 7.30. Now you are $2.82 short.
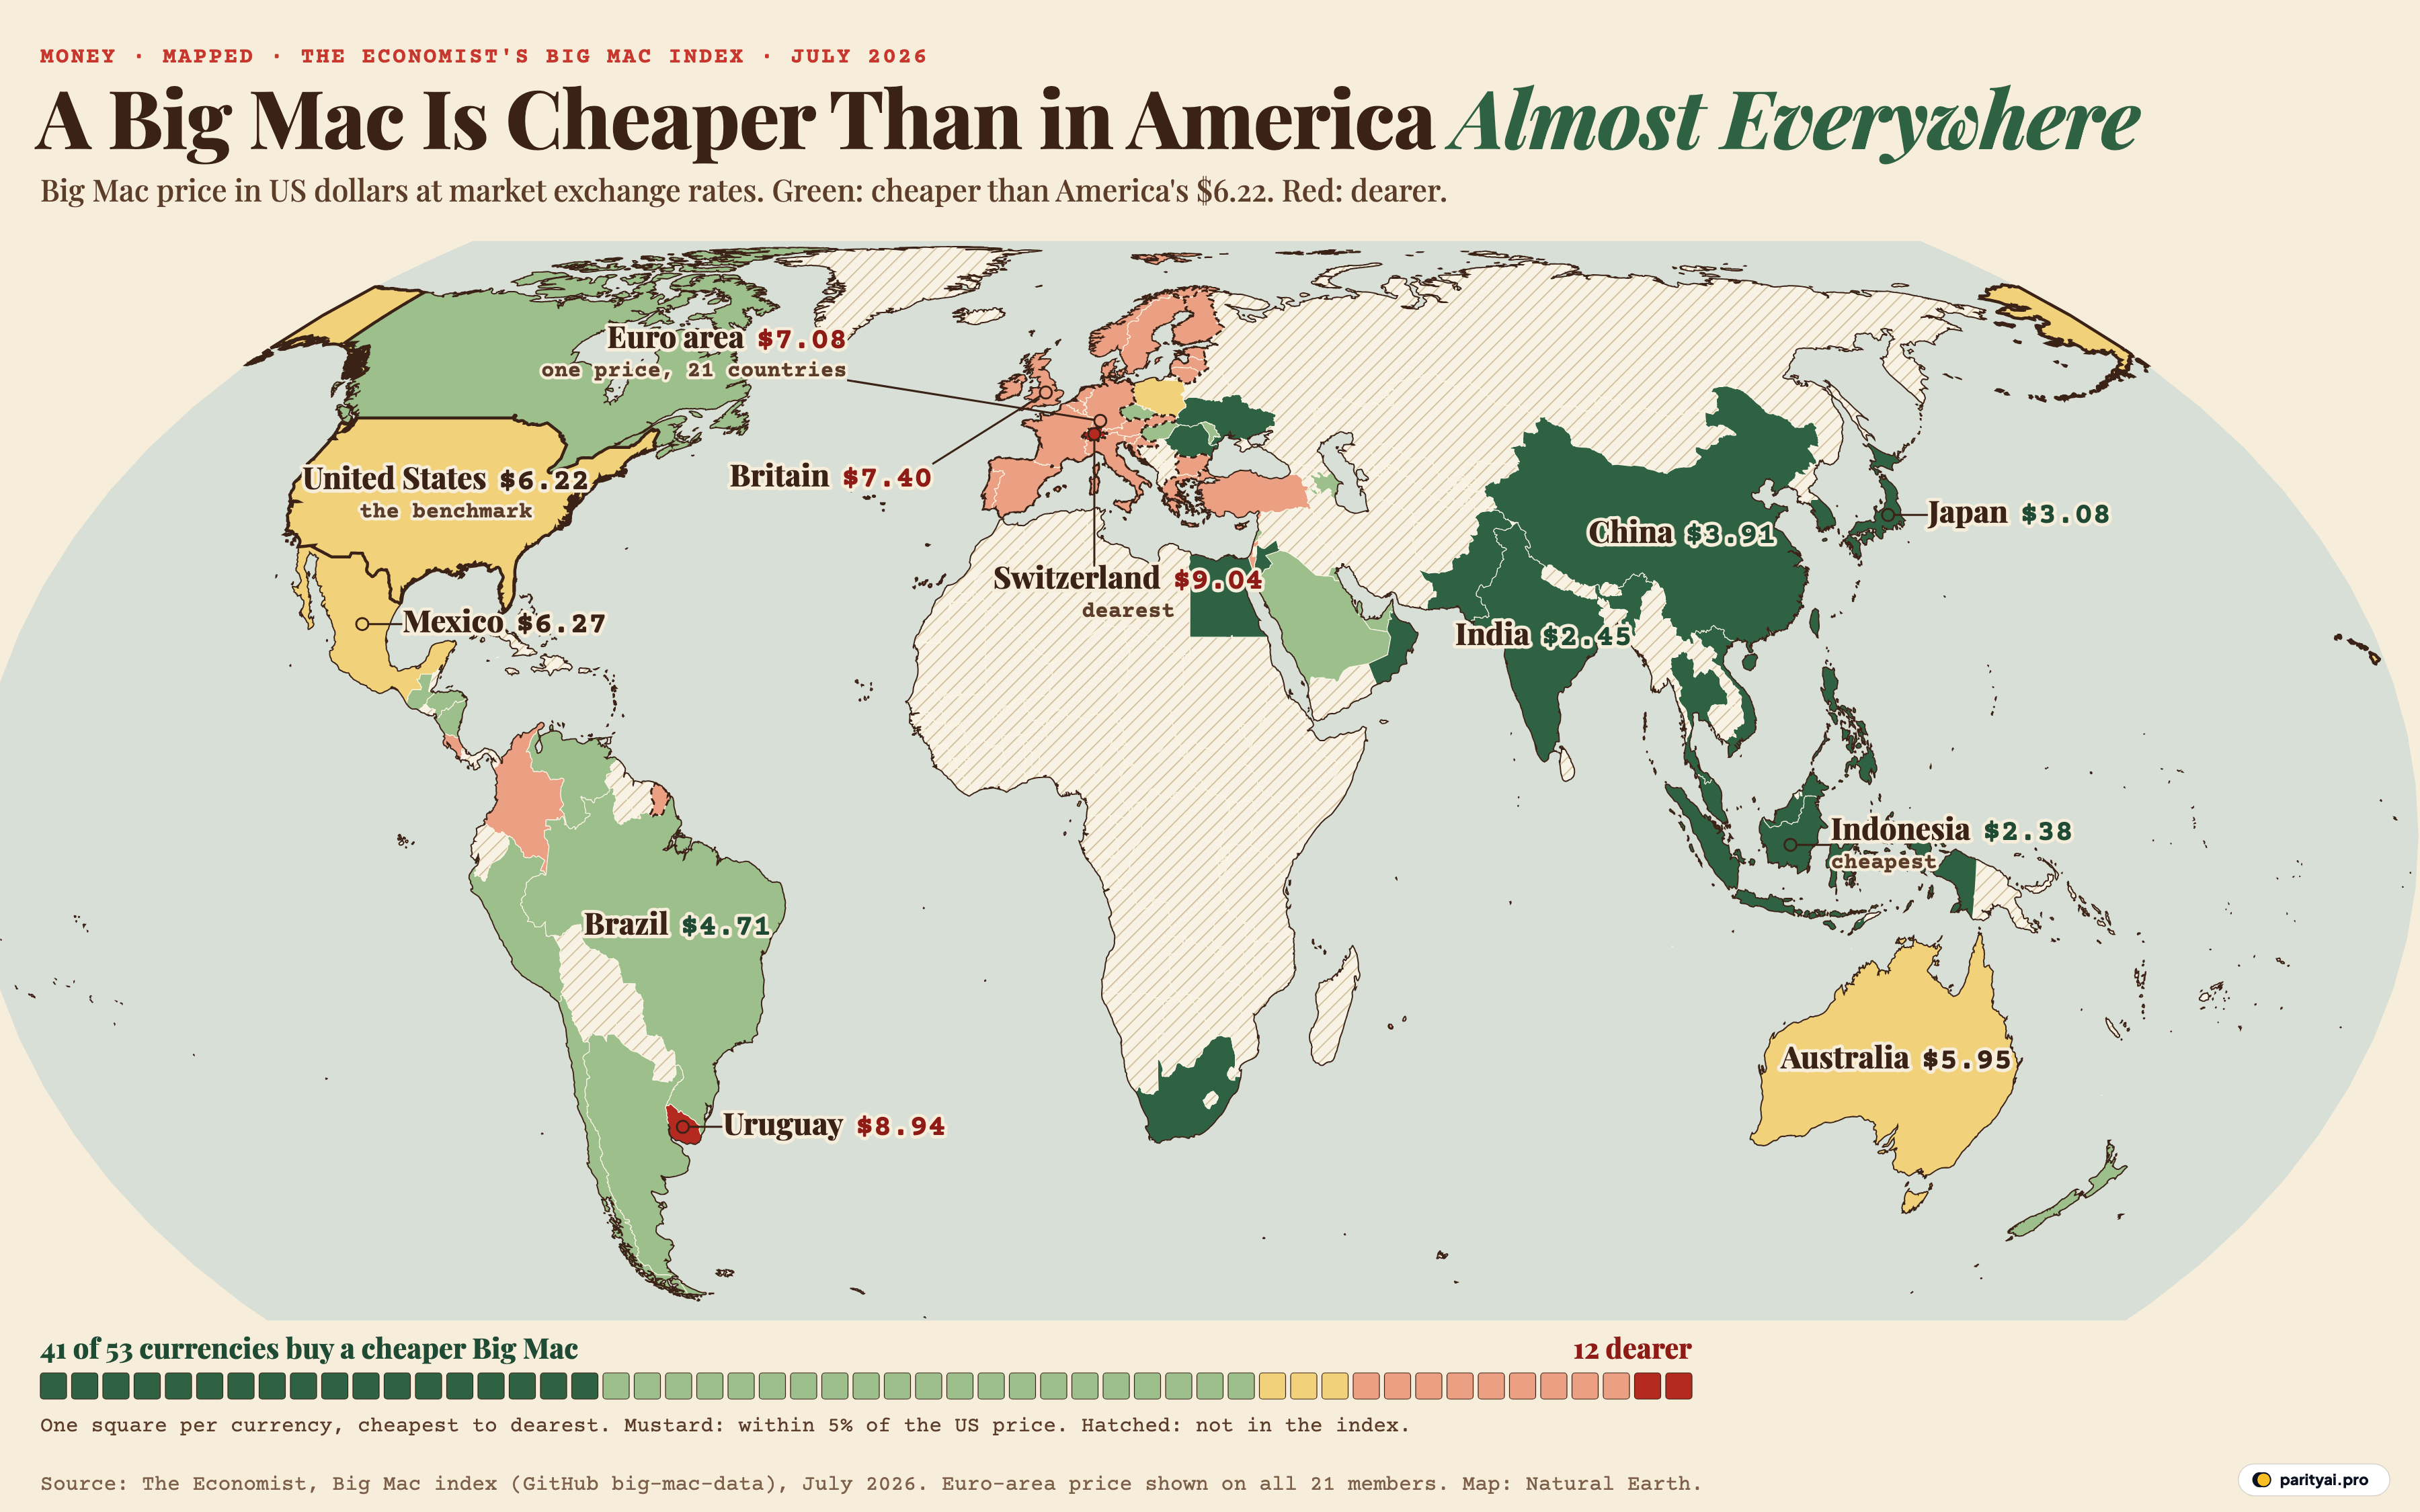
This piece is that trip, taken in order. It starts at the cheapest Big Mac in the index and ends at the dearest, with stops along the way where the numbers say something. All 54 entries in the July 2026 edition are in the table further down, and all of them are on the map above.
Reading the map before boarding
Each country on the map is coloured by the raw index: its Big Mac price, converted to dollars at the market exchange rate, compared with the American price. Green means the burger is cheaper than in the United States, and by the index's logic the local currency is undervalued against the dollar. Red means it is dearer and the currency looks overvalued. Pale mustard means the two prices are within 5% of each other. Hatched land has no entry in the index. A dozen dollar prices are printed on the map: the cheapest, the dearest, the American benchmark and some large economies. The rest are in the table below. The euro area is a single entry in The Economist's data, so its one price is painted across all 21 member states, inside a dashed outline. The European Central Bank lists 21 members since Bulgaria joined on 1 January 2026.
The row of squares under the map has one square per currency, sorted from cheapest to dearest. The history behind the colours, edition by edition since 2000, is in the second table.
Across the whole edition, 41 of the 53 other currencies come out cheaper than the dollar and 12 come out dearer. The median Big Mac costs $5.03. Buy one at every stop and the bill is $274.98. The same 54 burgers bought in America would cost $335.88.
Indonesia, Taiwan and India: three for the price of one
The first three stops are almost tied. Indonesia ($2.38), Taiwan ($2.42) and India ($2.45) are all about 62% below the American price. At any of them, $6.22 buys roughly two and a half Big Macs: 2.6 in Indonesia, 2.6 in Taiwan.
What makes this end of the map interesting is how recently the numbers got here. Indonesia and Taiwan both posted their lowest reading in the whole history of the index in July 2026. So did the Philippines and Vietnam, the next two cheapest entries in Asia. In April 2000 Taiwan's Big Mac cost $2.29, against $2.24 in the US. That is a gap of +2%, close enough to call parity. Since then its currency has fallen 63 points on the index, the second-largest drop among the 26 currencies priced in both 2000 and 2026. India entered the index in July 2011. Its lowest reading came in July 2013, at −64%, and its highest, −39%, was in July 2017. It has never come within a third of the US price.
Japan: the long slide of the yen
At $3.08, Japan's Big Mac costs half the American one. Your $6.22 becomes 1,008 yen at the July rate, and the burger costs 500. Few currencies in the index have moved as far. In April 2000 Japan was +24% dearer than the US, and that is still its highest reading. Now it is −50%. The fall of 74 points is the largest of any currency priced in both 2000 and 2026. Its lowest point, −51%, came in January 2026, six months before this edition. South Korea has followed a similar path. In 2000 its Big Mac was +21% above the American one, and today it is −38%, a fall of 59 points.
The Big Mac index doesn't say why a currency falls. It records the price of one sandwich and one exchange rate on one day. But when a rich country's burger goes from above the US price to half of it, the burger hasn't changed. The currency has.
Hong Kong and South Africa: one still, one swinging
Hong Kong ($3.25) has the calmest history in the index. Of the currencies priced since 2000, its range is the narrowest: 12 points from its weakest reading (−50%) to its strongest (−38%). Its exchange rate in the data is 7.8389 Hong Kong dollars to the US dollar, and across every edition since 2000 it has stayed between 7.75 and 8.00.
South Africa ($3.49) is close by in price but shows the opposite pattern. It was at −61% in July 2020 and is at −44% today. Its full range runs from −62% in April 2002 to −14% in January 2006.
China, Brazil and a detour through Caracas
The middle of the price range is crowded. China's Big Mac is $3.91 (−37%). That is stronger than its −47% in 2000, but the yuan has never come within a fifth of dollar parity on this measure. Its best reading was −24%, in January 2022. Brazil sits at $4.71 (−24%), and its history shows how far a currency can travel. In July 2011 a Brazilian Big Mac was +69% dearer than an American one.
Venezuela ($4.51, −28%) looks unremarkable on the map. Its history has the widest range in the index: 210 points, from +125% in January 2013 to −85% in January 2016. Lebanon ($5.36) was at +23% in July 2020 and is at −14% now, the biggest fall of any currency since then (37 points). The Economist's code includes both countries in the raw index but leaves them out of the GDP-adjusted regression, so neither has an adjusted value.
The exchange rate behind the counter
This is a good point in the trip to say what the index claims. The International Monetary Fund defines purchasing-power parity as the rate at which one currency would have to be converted into another to buy the same amount of goods and services in each country. The same IMF explainer names the Big Mac index as one comparison built on that idea. If a burger costs 26.50 yuan in China and $6.22 in America, the "burger exchange rate" is the ratio of the two prices. The market rate in July was 6.7708 yuan per dollar. The gap between those two rates is the −37% you see on the map.
Pam Woodall, a journalist at The Economist, introduced the index, and it was first published in September 1986, so it turned 40 this year. One burger is a crude measure. It makes a dry topic easy to follow, but it doesn't forecast exchange rates. The method is public: The Economist publishes the data and the code that compute it. Since July 2022 the American price has been supplied by McDonald's itself. Before that it was an average of four cities.
| # | Country or area | Local price | In US dollars | Raw vs dollar | GDP-adjusted |
|---|---|---|---|---|---|
| 1 | Indonesia | 43,000 IDR | ▼ 61.7% | −51.9% | |
| 2 | Taiwan | 78 TWD | ▼ 61.0% | −61.9% | |
| 3 | India | 236.25 INR | ▼ 60.5% | −49.5% | |
| 4 | Philippines | 169 PHP | ▼ 56.0% | −44.1% | |
| 5 | Egypt | 145 EGP | ▼ 53.9% | −41.1% | |
| 6 | Vietnam | 76,000 VND | ▼ 53.5% | −41.2% | |
| 7 | Japan | 500 JPY | ▼ 50.4% | −47.2% | |
| 8 | Hong Kong | 25.5 HKD | ▼ 47.7% | −50.1% | |
| 9 | Ukraine | 149 UAH | ▼ 46.4% | −32.5% | |
| 10 | South Africa | 56.9 ZAR | ▼ 44.0% | −29.9% | |
| 11 | Jordan | 2.5 JOD | ▼ 43.3% | −28.1% | |
| 12 | Malaysia | 14.55 MYR | ▼ 42.6% | −31.0% | |
| 13 | South Korea | 5,700 KRW | ▼ 38.3% | −32.3% | |
| 14 | Pakistan | 1,080 PKR | ▼ 37.5% | −19.0% | |
| 15 | China | 26.5 CNY | ▼ 37.1% | −23.8% | |
| 16 | Oman | 1.53 OMR | ▼ 36.1% | −24.5% | |
| 17 | Romania | 18.35 RON | ▼ 35.6% | −24.6% | |
| 18 | Thailand | 135 THB | ▼ 35.4% | −18.9% | |
| 19 | Azerbaijan | 7.25 AZN | ▼ 31.4% | −13.5% | |
| 20 | Guatemala | 34 GTQ | ▼ 28.3% | −9.0% | |
| 21 | Venezuela | 3,267 VES | ▼ 27.5% | n/a | |
| 22 | Kuwait | 1.4 KWD | ▼ 27.3% | −16.8% | |
| 23 | Moldova | 80 MDL | ▼ 26.7% | −7.8% | |
| 24 | Brazil | 23.9 BRL | ▼ 24.4% | −6.0% | |
| 25 | Bahrain | 1.8 BHD | ▼ 23.2% | −11.2% | |
| 26 | Qatar | 18 QAR | ▼ 20.5% | −20.0% | |
| 27 | Peru | 16.9 PEN | ▼ 19.7% | +0.5% | |
| 28 | Saudi Arabia | 19 SAR | ▼ 18.7% | −7.4% | |
| 29 | Nicaragua | 187 NIO | ▼ 17.9% | +5.9% | |
| 30 | New Zealand | 8.8 NZD | ▼ 17.4% | −10.2% | |
| 31 | United Arab Emirates | 19 AED | ▼ 16.8% | −9.8% | |
| 32 | Honduras | 139 HNL | ▼ 16.5% | +7.7% | |
| 33 | Hungary | 1,660 HUF | ▼ 14.8% | −0.2% | |
| 34 | Lebanon | 480,000 LBP | ▼ 13.8% | n/a | |
| 35 | Chile | 4,990 CLP | ▼ 13.1% | +6.1% | |
| 36 | Czech Republic | 115 CZK | ▼ 12.6% | −0.1% | |
| 37 | Singapore | 7.45 SGD | ▼ 7.2% | −11.4% | |
| 38 | Canada | 8.17 CAD | ▼ 6.5% | +1.6% | |
| 39 | Argentina | 8,700 ARS | ▼ 5.0% | +19.0% | |
| 40 | Australia | 8.5 AUD | ▼ 4.3% | −0.5% | |
| 41 | Poland | 23.5 PLN | 0.0% | +19.3% | |
| 42 | United States | 6.22 USD | base | base | |
| 43 | Mexico | 109 MXN | ▲ 0.8% | +25.4% | |
| 44 | Turkey | 325 TRY | ▲ 11.1% | +38.7% | |
| 45 | Costa Rica | 3,150 CRC | ▲ 12.5% | +38.1% | |
| 46 | Denmark | 46 DKK | ▲ 13.1% | +19.7% | |
| 47 | Euro area | 6.19 EUR | ▲ 13.8% | +29.1% | |
| 48 | Sweden | 69 SEK | ▲ 15.1% | +26.6% | |
| 49 | Britain | 5.49 GBP | ▲ 19.0% | +33.1% | |
| 50 | Israel | 23 ILS | ▲ 23.3% | +35.2% | |
| 51 | Colombia | 25,900 COP | ▲ 28.7% | +63.6% | |
| 52 | Norway | 78 NOK | ▲ 29.5% | +33.6% | |
| 53 | Uruguay | 359 UYU | ▲ 43.7% | +77.4% | |
| 54 | Switzerland | 7.3 CHF | ▲ 45.4% | +48.5% |
Raw: dollar price ÷ US price − 1. GDP-adjusted: dollar price compared with the price predicted from GDP per person; The Economist omits Lebanon and Venezuela from that regression.
Argentina, the United States and the near-misses
Argentina ($5.91) comes in 5% below the US price, close to the American level. Converted at the July rate, $6.22 becomes 9,162 pesos, against a menu price of 8,700. Its range is one of the widest in the data, from −66% in April 2002 to +33% in July 2011.
Then the home stop. The US price itself has moved a lot. A Big Mac cost $2.24 in April 2000 and $4.82 in July 2020. At $6.22 it is 178% dearer than in 2000 and 29% dearer than six years ago. Every other row in the index is measured against that moving benchmark. A country whose burger price stood still would slide toward green.
Two countries sit almost exactly on the line. Poland's Big Mac converts to $6.22, the same as America's to the cent. Mexico's converts to $6.27, +1% above. Both look very different from six years ago. In July 2020 Mexico was at −54%, its weakest reading ever. It has gained 55 points since then, the third-largest rise in the index. Poland was at −43% in 2000. Its gain since then, 43 points, is the largest of any currency priced in both years.
Turkey: from bargain to above the line
Turkey ($6.91, +11%) is the first red stop on the way up the price list. It is also the biggest mover since 2020. In July 2020 its Big Mac was −58% below the American price. Its weakest reading, −63%, came in January 2022. The rise of 69 points since July 2020 is the largest of the 52 currencies priced in both editions. Colombia (60 points) and Uruguay (54 points) come close behind. Across those 52 currencies, 31 look stronger against the dollar now than they did in July 2020.
The euro area and Britain: Europe's one price
In the euro area $6.22 becomes 5.44 euros, and the Big Mac costs 6.19, or $7.08. That is +14% above the US price. The Economist reports the euro area as one entry. Its GitHub notes say the euro-area averages are calculated using GDP and population data from Eurostat. A Big Mac in Lisbon and one in Amsterdam are averaged together. So the map paints one shade from Portugal to Finland and from Ireland to Bulgaria. That is a limitation of the data, not a finding that prices are the same everywhere in the euro area.
Britain is a little further up, at $7.40 (+19%). Both have swung over the 26 years. The euro area was +6% in 2000, peaked at +66% in June 2008, and was at −1% in July 2020. Britain went from +34% in 2000 to −11% in 2020 and back to +19%.
| Country or area | Apr 2000 | Jul 2020 | Jul 2026 | Change since 2000 (points) | 2000–2026 |
|---|---|---|---|---|---|
| Poland | −43% | −42% | 0% | ▲ 43 | |
| Hungary | −46% | −40% | −15% | ▲ 31 | |
| Australia | −31% | −5% | −4% | ▲ 27 | |
| Czech Republic | −38% | −21% | −13% | ▲ 25 | |
| China | −47% | −36% | −37% | ▲ 10 | |
| Singapore | −16% | −12% | −7% | ▲ 9 | |
| Euro area | +6% | −1% | +14% | ▲ 8 | |
| New Zealand | −24% | −10% | −17% | ▲ 7 | |
| Canada | −13% | +5% | −7% | ▲ 7 | |
| Malaysia | −47% | −51% | −43% | ▲ 4 | |
| Brazil | −26% | −19% | −24% | ▲ 2 | |
| Mexico | −1% | −54% | +1% | ▲ 2 | |
| Thailand | −35% | −15% | −35% | ▼ 0 | |
| South Africa | −40% | −61% | −44% | ▼ 4 | |
| Sweden | +21% | +19% | +15% | ▼ 6 | |
| Hong Kong | −42% | −45% | −48% | ▼ 6 | |
| Switzerland | +55% | +43% | +45% | ▼ 10 | |
| Britain | +34% | −11% | +19% | ▼ 15 | |
| Argentina | +12% | −27% | −5% | ▼ 17 | |
| Chile | +9% | −28% | −13% | ▼ 22 | |
| Denmark | +37% | −5% | +13% | ▼ 24 | |
| Israel | +60% | +3% | +23% | ▼ 37 | |
| Indonesia | −19% | −51% | −62% | ▼ 43 | |
| South Korea | +21% | −22% | −38% | ▼ 59 | |
| Taiwan | +2% | −49% | −61% | ▼ 63 | |
| Japan | +24% | −25% | −50% | ▼ 74 |
Raw index against the US dollar. A positive change means the Big Mac got dearer relative to America's, in dollars.
Colombia and Norway: the eight-dollar stops
At $8.00 and $8.05, Colombia and Norway cost almost the same, +29% and +29% above the US. Their histories have little in common. Norway's Big Mac has never been cheaper than the American one: its lowest reading was +3%, in July 2019, and in May 2006 it reached +153%. Colombia was −32% below the US in July 2020 and has risen 60 points since.
Uruguay: the high that is happening now
Uruguay ($8.94) is the second-dearest Big Mac in the index, +44% above the US price. Here $6.22 becomes 249.83 pesos, against a menu price of 359. Its current reading is also its highest since it joined the index in May 2004. It is one of 7 entries at a record high this edition. Most of the others (Azerbaijan, Moldova, Qatar, Nicaragua and Honduras) have only been priced since 2018, so their records cover fewer years.
Switzerland, end of the line
The last stop is the dearest: $9.04, +45% above America, the price that leaves you $2.82 short. Switzerland's row is entirely red. Its lowest reading since 2000 was +30%, in July 2022, so its Big Mac has cost more than the American one in every edition since 2000. At its peak, in July 2011, it was +122% dearer.
What a burger can't tell you
The raw index ignores the most obvious reason prices differ: income. Much of what goes into a Big Mac is local, including wages, rents and utilities. Taxes, subsidies and trade barriers distort prices too. Richer economies tend to have higher prices for things that can't be traded, an effect known as Balassa–Samuelson. A cheap burger in a poor country is partly a sign of cheap labour, not only of a cheap currency.
The Economist's answer is the GDP-adjusted index. In its code, each edition fits a line of dollar Big Mac price against GDP per person across all countries. Each country is then compared with the price that line predicts for its income, not with the American price. On that measure 32 of 51 currencies are still undervalued against the dollar and 19 are overvalued. 7 of them switch from green to red: Poland, Argentina, Honduras, Chile, Nicaragua, Canada, Peru. Argentina goes from −5% to +19%. Mexico, level on the raw index, comes out at +25%. Uruguay is the most overvalued currency after adjustment (+77%). Taiwan is the most undervalued (−62%), still below what Taiwan's income would predict.
| Country or area | Raw vs dollar | GDP-adjusted | GDP per person used ($) |
|---|---|---|---|
| Uruguay | ▲ 43.7% | ▲ 77.4% | |
| Colombia | ▲ 28.7% | ▲ 63.6% | |
| Switzerland | ▲ 45.4% | ▲ 48.5% | |
| Turkey | ▲ 11.1% | ▲ 38.7% | |
| Costa Rica | ▲ 12.5% | ▲ 38.1% | |
| Israel | ▲ 23.3% | ▲ 35.2% | |
| Norway | ▲ 29.5% | ▲ 33.6% | |
| Britain | ▲ 19.0% | ▲ 33.1% | |
| Euro area | ▲ 13.8% | ▲ 29.1% | |
| Sweden | ▲ 15.1% | ▲ 26.6% | |
| Mexico | ▲ 0.8% | ▲ 25.4% | |
| Denmark | ▲ 13.1% | ▲ 19.7% | |
| Poland | 0.0% | ▲ 19.3% | |
| Argentina | ▼ 5.0% | ▲ 19.0% | |
| Honduras | ▼ 16.5% | ▲ 7.7% | |
| Chile | ▼ 13.1% | ▲ 6.1% | |
| Nicaragua | ▼ 17.9% | ▲ 5.9% | |
| Canada | ▼ 6.5% | ▲ 1.6% | |
| Peru | ▼ 19.7% | ▲ 0.5% | |
| Czech Republic | ▼ 12.6% | ▼ 0.1% | |
| Hungary | ▼ 14.8% | ▼ 0.2% | |
| Australia | ▼ 4.3% | ▼ 0.5% | |
| Brazil | ▼ 24.4% | ▼ 6.0% | |
| Saudi Arabia | ▼ 18.7% | ▼ 7.4% | |
| Moldova | ▼ 26.7% | ▼ 7.8% | |
| Guatemala | ▼ 28.3% | ▼ 9.0% | |
| United Arab Emirates | ▼ 16.8% | ▼ 9.8% | |
| New Zealand | ▼ 17.4% | ▼ 10.2% | |
| Bahrain | ▼ 23.2% | ▼ 11.2% | |
| Singapore | ▼ 7.2% | ▼ 11.4% | |
| Azerbaijan | ▼ 31.4% | ▼ 13.5% | |
| Kuwait | ▼ 27.3% | ▼ 16.8% | |
| Thailand | ▼ 35.4% | ▼ 18.9% | |
| Pakistan | ▼ 37.5% | ▼ 19.0% | |
| Qatar | ▼ 20.5% | ▼ 20.0% | |
| China | ▼ 37.1% | ▼ 23.8% | |
| Oman | ▼ 36.1% | ▼ 24.5% | |
| Romania | ▼ 35.6% | ▼ 24.6% | |
| Jordan | ▼ 43.3% | ▼ 28.1% | |
| South Africa | ▼ 44.0% | ▼ 29.9% | |
| Malaysia | ▼ 42.6% | ▼ 31.0% | |
| South Korea | ▼ 38.3% | ▼ 32.3% | |
| Ukraine | ▼ 46.4% | ▼ 32.5% | |
| Egypt | ▼ 53.9% | ▼ 41.1% | |
| Vietnam | ▼ 53.5% | ▼ 41.2% | |
| Philippines | ▼ 56.0% | ▼ 44.1% | |
| Japan | ▼ 50.4% | ▼ 47.2% | |
| India | ▼ 60.5% | ▼ 49.5% | |
| Hong Kong | ▼ 47.7% | ▼ 50.1% | |
| Indonesia | ▼ 61.7% | ▼ 51.9% | |
| Taiwan | ▼ 61.0% | ▼ 61.9% |
Highlighted rows look cheap on the raw index but dear after adjusting for GDP per person. GDP per person as used by The Economist (adjusted by Big Mac price differences since July 2022).
There are smaller limits too. The index covers only countries with a McDonald's price The Economist tracks, which is why most of Africa is hatched. Russia's last entry was in January 2022, at −65%. A few months later McDonald's sold its Russian business to a local licensee. Sri Lanka's series stops in January 2024. The euro area is one number for 21 countries. Each edition is a snapshot taken on one day, so a currency that moves sharply the week after publication will look out of date at once. And every comparison over time measures each currency with a US price that has itself risen 178% since 2000.
The view from the dearest counter
From Indonesia to Switzerland the price spread is 3.8 times. Of the 26 currencies priced in both 2000 and 2026, 14 look weaker against the dollar now than they did then. In 2000, 11 of them had Big Macs dearer than America's. In 2026, 7 do. Most of the trip runs through green.
Read as a test of currency value, that green is a claim that much of the world's money is cheap against the dollar. The GDP-adjusted index trims that claim without erasing it. And at the very end of the trip, a Swiss Big Mac still costs more than the $6.22 you brought, as it has in every edition since 2000.
Sources and method
- The Economist, Big Mac index data (big-mac-full-index.csv). Editions from April 2000 to July 2026; retrieved November 4, 2026
- Natural Earth country and land shapes via world-atlas; ISO 3166 codes via lukes/ISO-3166-Countries-with-Regional-Codes
- European Central Bank, euro area members
The raw index converts each local Big Mac price to US dollars at the market exchange rate and compares it with the US price: a Big Mac 20% cheaper than in America implies a currency 20% undervalued against the dollar. The GDP-adjusted index instead compares each price with the one predicted by the country's GDP per person, from a regression across all countries in the edition. The Economist reports the euro area as one entry, an average across member countries; the map paints that single value on all 21 euro members (Bulgaria joined in January 2026). Countries with no entry in July 2026 are hatched. Changes over time use every edition from April 2000 (or a country's first edition) to July 2026.
Charts like this, from your own numbers.
Connect a spreadsheet or the tools you run on, and Parity builds the dashboard and writes the report, with every number checked.
Try Parity free

