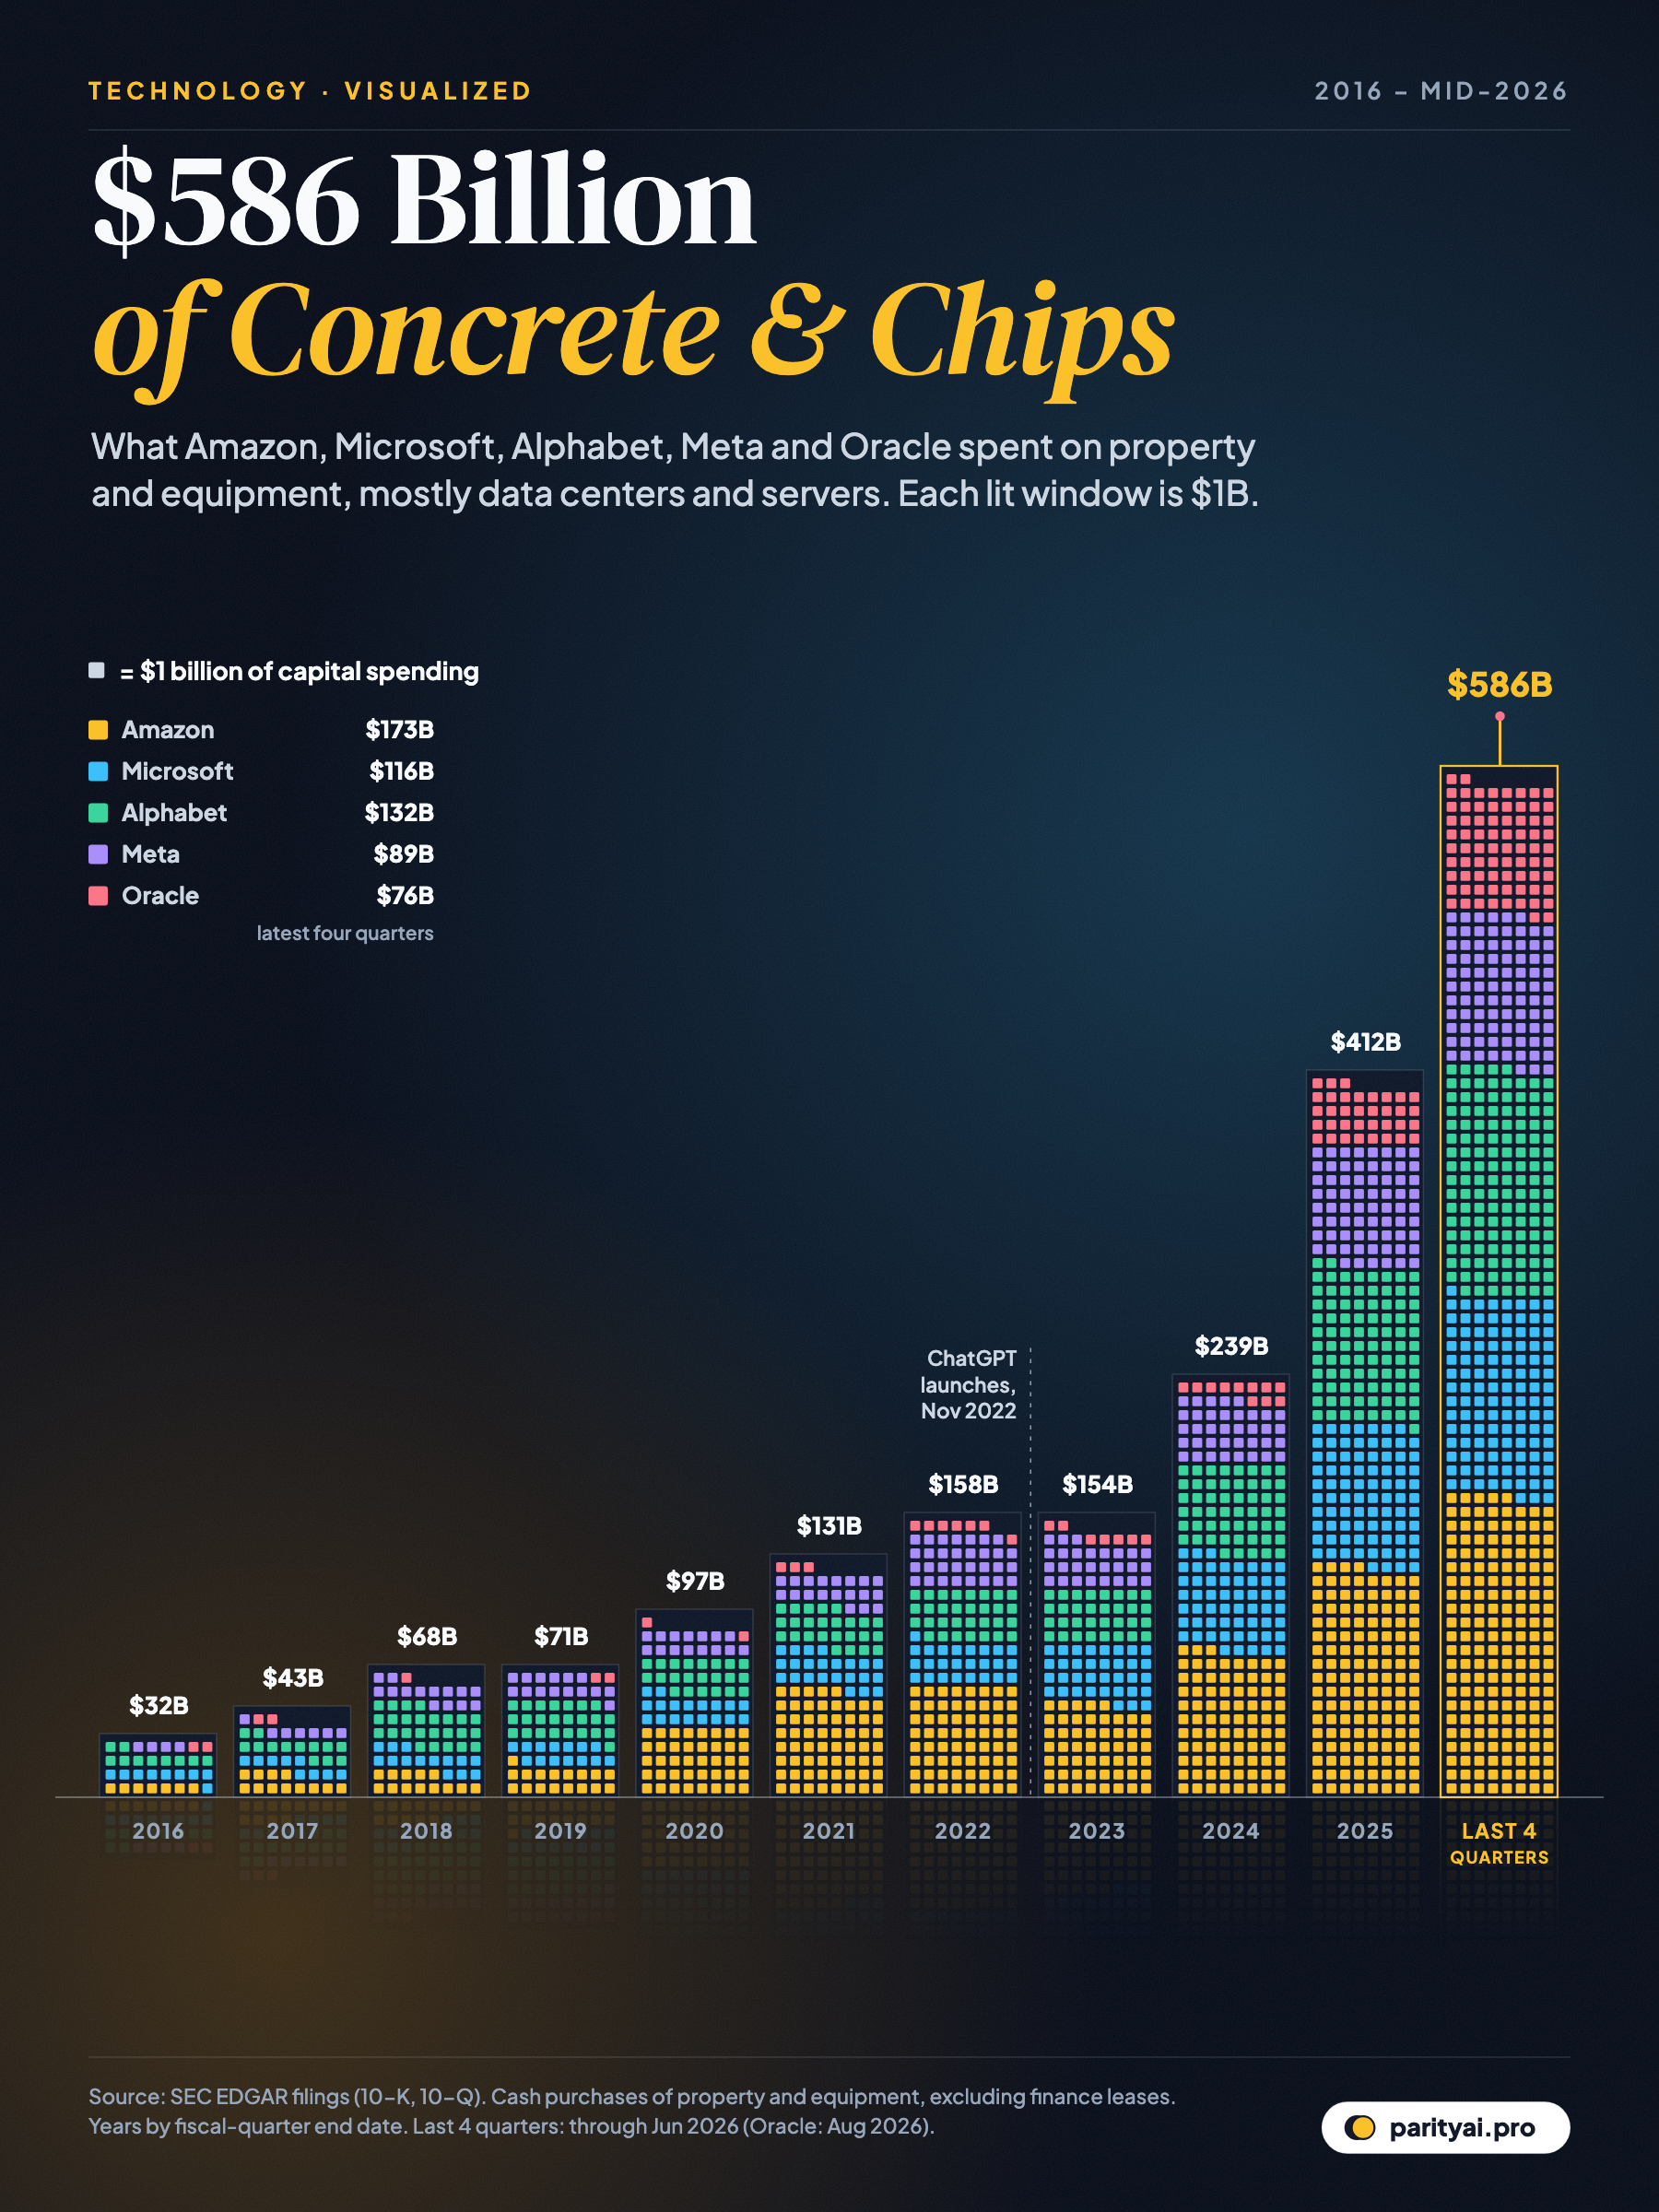
There is a building boom underway, and most of it is hidden behind fences in places like northern Virginia, central Ohio and the outskirts of Phoenix. It is the build-out of data centers for artificial intelligence, and five companies are paying for most of it.
Picture that spending as a city skyline at night. Each tower is a year, from 2016 to 2025, and the last tower is the latest four quarters each company has reported. Each lit window is $1 billion of capital spending, coloured by company. The towers barely change from 2016 to 2019. They rise through the cloud years and the pandemic, dip slightly in 2023, and then shoot up after the launch of ChatGPT in November 2022 made generative AI the industry's top priority.
The figures come straight from the companies' filings with the U.S. Securities and Exchange Commission, through the SEC's XBRL data API. We use each company's cash payments for property and equipment, the line usually reported as "capital expenditures", and add up the quarters.
From $32 billion to $586 billion
In 2016 the five companies spent $32 billion combined on property and equipment. Most of it went to warehouses, offices and the ordinary data centers that ran search, shopping and social media. By 2020 the total had reached $97 billion, as the pandemic pushed shopping and work online and Amazon raced to add fulfilment space.
Then came a pause. Spending was $158 billion in 2022 and $154 billion in 2023. Amazon pulled back after overbuilding its warehouse network, and Meta cut costs in what its CEO called a "year of efficiency".
The pause did not last. Total spending rose 55% to $239 billion in 2024 and another 72% to $412 billion in 2025. The latest four quarters, through June 2026 for four of the companies and August 2026 for Oracle, reached $586 billion.
Company by company
Amazon: $173 billion in the latest four quarters (30% of the total). Amazon is the biggest spender in absolute terms, up from $6.7 billion in 2016 and $83 billion in 2024. Its spending used to be split between warehouses and Amazon Web Services. Now it is mostly AWS. In its second-quarter 2026 results, the company said it expects about $220 billion in cash capital expenditures in 2026, up from a previous outlook of about $200 billion. It cited higher memory costs, among other factors. Its most recent quarter alone, ending June 2026, came to $54.2 billion.
Alphabet: $132 billion (23%). Google's parent spent $91 billion in 2025 and $44.9 billion in the quarter to June 2026, its biggest quarter yet. Executives raised the company's 2026 capital spending forecast to $195 to $205 billion and said roughly 60% goes to servers and 40% to data centers and networking equipment. Alphabet also raised about $49.6 billion in new equity in June 2026, partly to fund AI infrastructure. It is a rare move for a company long known for buying back its own shares.
Microsoft: $116 billion (20%). Microsoft's fiscal year ends in June, so its latest four quarters match fiscal 2026. Cash spending on property and equipment was $35.8 billion in the June quarter. Microsoft also leases data centers under finance leases that do not appear in this cash figure. On its July earnings call, the company said total capital expenditures including those leases were $41 billion for the quarter. Its CFO said roughly two-thirds of capex went to short-lived assets, mainly CPUs and GPUs. The company expects about $175 billion of capex in calendar 2026.
Meta: $89 billion (15%). Meta has no cloud business to rent out, so its spending is the purest bet on AI for its own use: recommendation systems, advertising tools and its Llama models. It spent $70 billion in 2025, nearly double 2024's $37 billion. In July 2026 it narrowed its 2026 forecast to $130 to $145 billion, a figure that includes finance-lease payments.
Oracle: $76 billion (13%). Oracle is the newcomer to this list, and its tower shows the steepest climb. It spent $1.6 billion in 2016 and still only $11 billion in 2024. Then it signed huge long-term contracts to supply computing power to AI developers, OpenAI above all. In the quarter to August 2026, Oracle spent $28.5 billion, almost as much as Meta. It reported delivering more than 300,000 GPUs in that quarter. Unlike the others, Oracle is funding much of this with borrowing. It sold $25 billion of bonds in February 2026, and trade press put its debt at about $125 billion by September.
Where the money goes
"Property and equipment" sounds like bricks, but much of it is silicon. Microsoft's two-thirds split and Alphabet's 60/40 split tell the same story. Most of the money buys servers packed with AI accelerators from Nvidia, AMD or the companies' own chip designs. The rest pays for the buildings, power systems, cooling and networking that keep them running.
That mix matters for investors. Chips wear out and go out of date far faster than buildings. Big Tech typically depreciates servers over five to six years, compared with decades for a building. As this spending turns into depreciation on the income statement, it will weigh on profits for years, whether or not AI revenue keeps up.
The physical side is visible in U.S. government data. The Census Bureau's construction spending survey put private data-center construction at an annual rate of about $85 billion in August 2026. That is up 73% from a year earlier and roughly nine times its level at the start of 2021. And the buildings need power. The International Energy Agency projects that data-center electricity use could more than double from about 415 TWh in 2024 to around 945 TWh by 2030, with the United States accounting for the largest share.
How big is $586 billion?
Some comparisons help:
- Per day: $1.6 billion, every day, for a year.
- Against the past: more than the five companies' combined spending from 2016 through 2021 ($442 billion).
- Against plans: spending is still rising. Taking the companies' latest guidance at face value, the four biggest alone, Amazon, Alphabet, Microsoft and Meta, are on course for more than $700 billion in calendar 2026, a total widely reported since the spring.
That last point is why the tallest tower has an antenna. It shows the past four quarters, not the peak.
The debate behind the skyline
Two readings of this chart compete.
In the bullish reading, the companies are building the next computing platform, and demand already exceeds supply. Several have said they are capacity-constrained, unable to sell all the AI computing customers want. Oracle reported a contract backlog of more than $600 billion. On that view, the skyline is a response to orders already on the books.
In the cautious reading, the spending has run ahead of proven revenue. Much of the demand comes from a small number of AI labs that are themselves losing money and depend on outside funding. Oracle's reliance on debt, Alphabet's share sale and the shift towards leasing all suggest that even these cash-rich companies are reaching for outside money. If AI revenue disappoints, the result could be the kind of overbuilding the telecom industry went through around 2000.
The chart can't settle that debate. It does show the scale of the bet. These five companies now invest more each year than most countries' entire economies produce.
What to watch next
Three signals will show whether the skyline keeps climbing.
The next round of earnings. Amazon, Alphabet, Microsoft and Meta report results for the July to September quarter in late October. Any change to their 2026 guidance, and the first hints of 2027 plans, will move the tallest tower.
The shift to leasing. Microsoft has said it is moving some data-center deals from finance leases to operating leases, and other companies rent capacity from specialist builders. Leased capacity shows up in cash flow as rent over many years rather than as capex today. Part of the build-out could therefore disappear from charts like this one without slowing down at all.
Component prices. Amazon pointed to memory costs when it raised its forecast. When chip and memory prices rise, the same dollar buys less computing power. A taller tower does not always mean more capacity.
| Period | Amazon | Microsoft | Alphabet | Meta | Oracle | Total | vs year before |
|---|---|---|---|---|---|---|---|
| Latest four quarters | 173.0 | 115.9 | 132.4 | 89.3 | 75.7 | – | |
| 2025 | 131.8 | 83.1 | 91.4 | 69.7 | 35.5 | ▲ 72% | |
| 2024 | 83.0 | 55.6 | 52.5 | 37.3 | 10.7 | ▲ 55% | |
| 2023 | 52.7 | 35.2 | 32.3 | 27.0 | 6.9 | ▼ 2% | |
| 2022 | 63.6 | 24.8 | 31.5 | 31.2 | 6.7 | ▲ 21% | |
| 2021 | 61.1 | 23.2 | 24.6 | 18.7 | 3.1 | ▲ 35% | |
| 2020 | 40.1 | 17.6 | 22.3 | 15.2 | 1.8 | ▲ 37% | |
| 2019 | 16.9 | 13.5 | 23.5 | 15.1 | 1.6 | ▲ 4% | |
| 2018 | 13.4 | 14.2 | 25.1 | 13.9 | 1.5 | ▲ 58% | |
| 2017 | 12.4 | 8.7 | 13.2 | 6.7 | 2.0 | ▲ 34% | |
| 2016 | 6.7 | 9.1 | 10.2 | 4.5 | 1.6 | – |
Cash purchases of property and equipment, excluding finance leases. Calendar years by the end date of each fiscal quarter.
Reading the filings
- Cash capex only. We use each company's cash purchases of property and equipment (the XBRL elements PaymentsToAcquirePropertyPlantAndEquipment, or PaymentsToAcquireProductiveAssets for Amazon). Assets taken on through finance leases, which are significant for Microsoft, Meta and Amazon, are not included. Companies' own "capex" headlines can therefore be higher than our figures.
- Calendar years by quarter end. Microsoft's fiscal year ends in June and Oracle's in May. We assign each fiscal quarter to the calendar year in which it ends.
- Derived quarters. Some filings report only year-to-date totals. We derive single quarters by subtracting the earlier year-to-date figure.
- Latest four quarters sums each company's four most recent reported quarters: through June 2026 for Amazon, Alphabet, Microsoft and Meta, and through August 2026 for Oracle.
Sources and method
- SEC EDGAR XBRL company facts API. 10-K and 10-Q filings of Amazon, Microsoft, Alphabet, Meta and Oracle, retrieved October 8, 2026
Capital spending is each company's cash payments for property and equipment as tagged in its filings (us-gaap PaymentsToAcquirePropertyPlantAndEquipment, or PaymentsToAcquireProductiveAssets for Amazon). It excludes assets acquired under finance leases, which add materially for Microsoft and Amazon, so it understates total investment. Quarters are taken from filings directly or derived by subtracting year-to-date figures, and assigned to the calendar year in which the fiscal quarter ends (Microsoft's fiscal year ends in June, Oracle's in May). 'Latest four quarters' sums each company's four most recently reported quarters: through June 2026 for Amazon, Microsoft, Alphabet and Meta, and through August 2026 for Oracle.
Charts like this, from your own numbers.
Connect a spreadsheet or the tools you run on, and Parity builds the dashboard and writes the report, with every number checked.
Try Parity free

