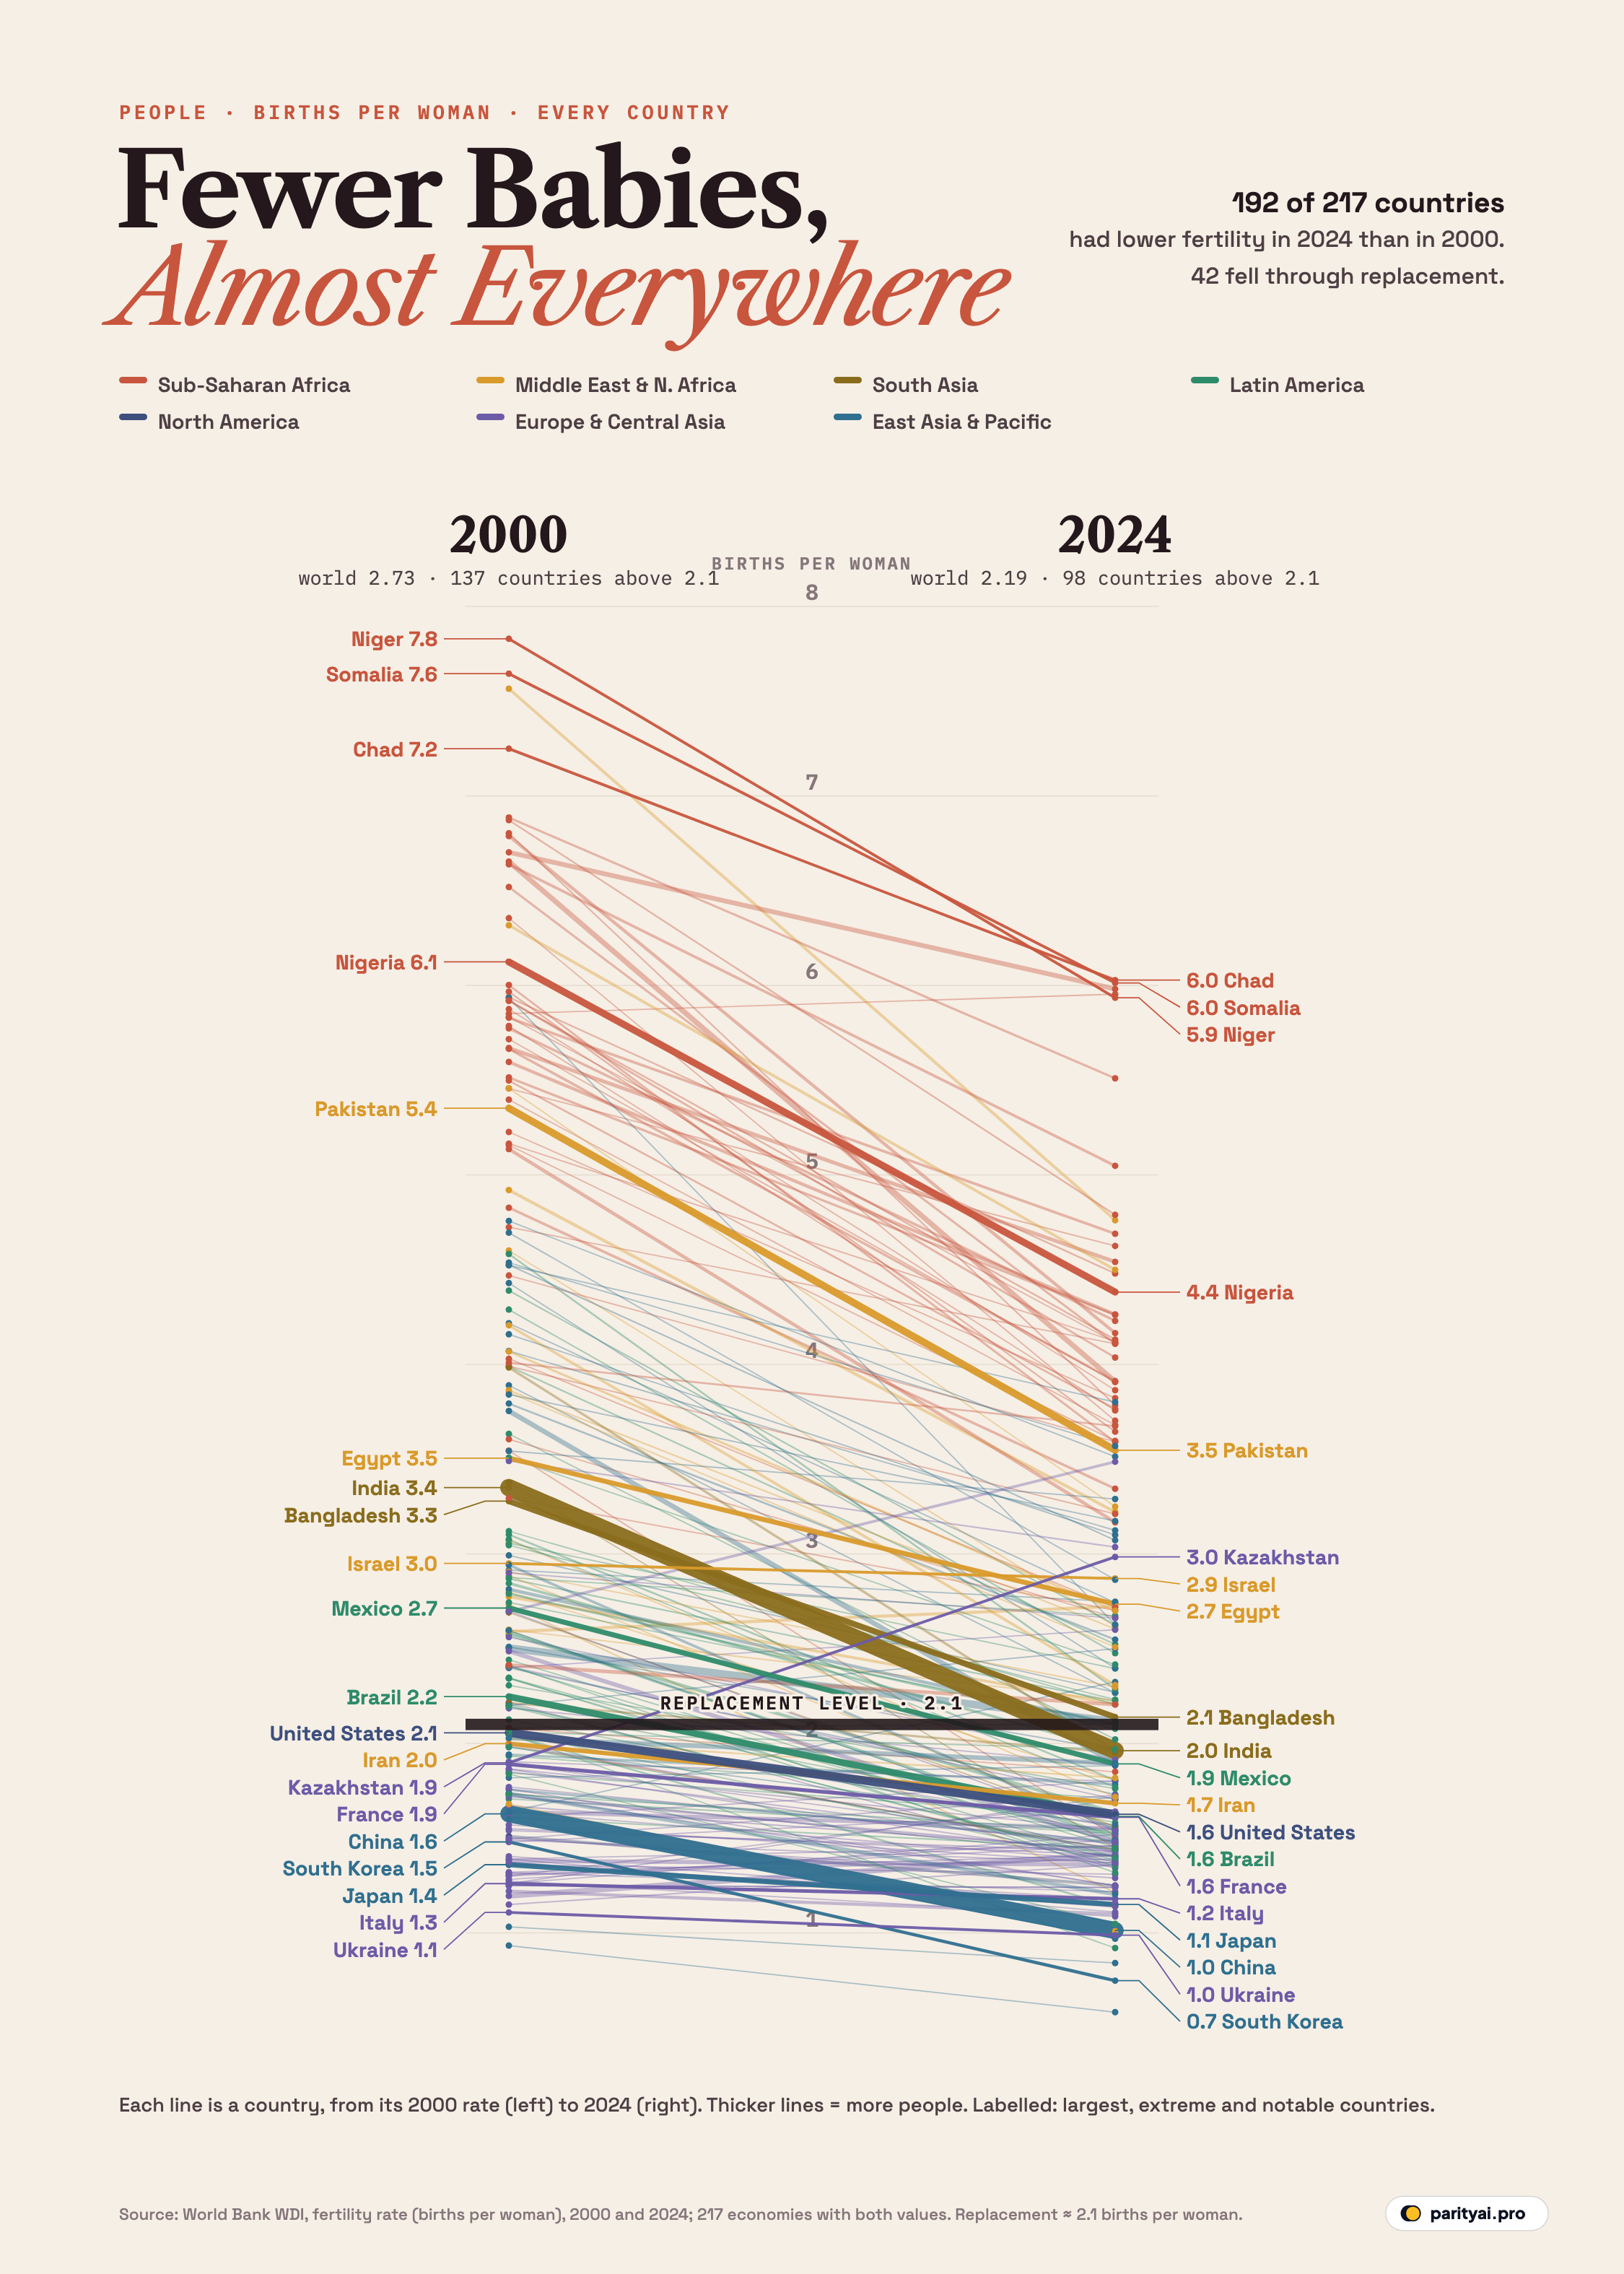
A woman in Chad can expect to have about six children over her lifetime. A woman in Seoul can expect to have fewer than one. Those two numbers, 6.03 and 0.75 births per woman in 2024, are the top and very nearly the bottom of the chart above. Between them lies almost every other country on Earth, and nearly all of them are sliding the same way.
The chart is a slope ladder. On the left axis is each country's total fertility rate in 2000; on the right, its rate in 2024. A line joins the two. Lines are coloured by region and drawn thicker for countries with more people, so India and China stand out as heavy bands while small island states are hairlines. The dark bar across the middle marks 2.1 births per woman, the level demographers call replacement. The data are the World Bank's fertility rate estimates for 217 countries and territories.
Of those 217, 192 had a lower fertility rate in 2024 than in 2000. The world average fell from 2.73 to 2.19.
Why 2.1 is the number that matters
The total fertility rate is a hypothetical: the number of children a woman would have if, through her life, she had babies at the rates women of each age are having them this year. It is the cleanest way to compare countries with very different age structures.
A population replaces itself, in the long run and without migration, when each woman has on average enough daughters to replace her and her partner. That works out at about 2.1 children: two to replace the parents, plus a little extra because slightly more boys are born than girls and because some children don't survive to adulthood. The UN's World Population Prospects describes it as the level required for a population to maintain a constant size in the long run. In countries where many children still die young, the true replacement rate is higher.
Falling below 2.1 does not make a population shrink immediately. A country with lots of young adults will keep growing for decades because so many people are of childbearing age, even if each has fewer children. That momentum is why the world's population is still rising even as the world's fertility rate approaches replacement. But a rate below 2.1, sustained for long enough, eventually means fewer people.
The crowd that fell through the bar
In 2000, 137 of the countries on the chart had fertility at or above 2.1. By 2024, 98 did. Watch the left and right ends of the replacement bar: 42 countries started above it and ended below it.
The crossing countries are a surprising mix. India, the world's most populous country, went from 3.35 to 1.96. Its thick olive band dips just under the bar on the right. India's own Sample Registration System put the figure at 1.9 for 2023, with large differences between states. Mexico fell from 2.71 to 1.89, Brazil from 2.25 to 1.61, Colombia from 2.57 to 1.63 and Türkiye from 2.49 to 1.48. The Philippines, long one of Asia's high-fertility countries, dropped from 3.75 to 1.89.
Latin America is the clearest case. Its green lines start scattered between about 2 and 3.5 and finish clustered below the bar, many of them below the level of Western Europe. Chile, at 1.14, now has lower fertility than France (1.61) or the United Kingdom (1.55).
Several Gulf states crossed too. Saudi Arabia fell from 4.21 to 2.31, just above the bar, while the United Arab Emirates, Qatar, Kuwait and Bahrain all moved below it.
The floor keeps dropping
At the bottom of the chart, the lines don't level off. They keep going down.
In 2000, 25 countries had fertility below 1.4, the level the UN calls "ultra-low". By 2024, 40 did. The lowest values in the data now are Macao (0.58), South Korea (0.75) and Hong Kong (0.84), with Singapore (0.97) and Ukraine (0.99) also under one. China fell from 1.63 to 1.01; it registered 7.92 million births in 2025, down from 9.54 million the year before, and its population is shrinking.
South Korea has become the emblem of this. Its line falls from 1.48 to 0.75, one of the steepest declines among rich countries. In June 2024 the then-president declared a demographic national emergency. There has since been a small rebound: preliminary figures put 2025 at 0.80, up from 0.75, with births up nearly 7%. Whether that turns into a trend is one of the most closely watched questions in demography.
Thailand (1.20), Japan (1.15), Italy (1.18) and Spain (1.10) are all well below 1.4. Japan and Italy, often treated as the classic cases of low fertility, actually changed less than many others over this period. They were already near the bottom in 2000. The rest of the world has been catching up with them.
The United States sits in the middle of the low group. Its rate fell from 2.06, almost exactly replacement, to 1.63 on the World Bank's figures. The CDC's final 2024 data are a little lower, 1,599.5 births per 1,000 women, a record low.
| Country | 2000 | 2024 | Change | 2000–2024 |
|---|---|---|---|---|
| Timor-Leste | 5.93 | 2.63 | ▼ 3.31 | |
| South Sudan | 6.80 | 3.79 | ▼ 3.02 | |
| Afghanistan | 7.57 | 4.76 | ▼ 2.80 | |
| Ethiopia | 6.65 | 3.91 | ▼ 2.75 | |
| Sierra Leone | 6.36 | 3.70 | ▼ 2.65 | |
| Uganda | 6.79 | 4.17 | ▼ 2.62 | |
| Malawi | 6.00 | 3.59 | ▼ 2.41 | |
| Burkina Faso | 6.52 | 4.11 | ▼ 2.41 | |
| Rwanda | 5.97 | 3.65 | ▼ 2.32 | |
| Guatemala | 4.58 | 2.29 | ▼ 2.30 | |
| Kazakhstan | 1.90 | 2.98 | ▲ 1.09 | |
| Uzbekistan | 2.70 | 3.49 | ▲ 0.79 | |
| Northern Mariana Islands | 1.64 | 2.32 | ▲ 0.68 | |
| Bulgaria | 1.26 | 1.72 | ▲ 0.46 | |
| Armenia | 1.30 | 1.70 | ▲ 0.40 |
The ten largest falls, then the five largest rises (highlighted). Births per woman, World Bank.
The lines that went up
Look carefully and a handful of lines slope upward. Only 21 countries had higher fertility in 2024 than in 2000.
Most of them sit in a single part of the world. Kazakhstan is the most striking: its line climbs from 1.90 to 2.98, cutting across almost every other line on the chart. Uzbekistan and Mongolia rose too, and several Eastern European countries that hit extreme lows after the collapse of communism, such as Bulgaria, Czechia, Romania and Hungary, have recovered a little from them. Russia went from 1.20 to 1.42. Georgia rose from 1.61 to 1.80.
Most of these rebounds start from very low levels in 2000 and end well below replacement. And they are not all one story: some reflect economic recovery after the 1990s, some reflect women who delayed having children finally having them, and some may reflect policy. Hungary, for instance, has made family support a central plank of government, and is phasing in a lifetime income tax exemption for mothers of two or more. Its rate rose from 1.32 to 1.41. Whether policy caused that, or simply accompanied it, is contested.
The top of the chart
The red lines at the top are sub-Saharan Africa. They are falling too, often steeply, but from such high starting points that most remain far above replacement.
The highest rates in 2024 were in Chad (6.03), Somalia (6.01) and DR Congo (5.98). Niger, which had the highest rate on the chart in 2000 at 7.83, has fallen to 5.93. Nigeria, Africa's most populous country, went from 6.12 to 4.38, Ethiopia from 6.65 to 3.91 and Kenya from 5.14 to 3.17.
Some of the steepest falls of all came outside Africa, in countries that also started very high. Timor-Leste went from 5.93 to 2.63, the biggest drop in the data. Afghanistan fell from 7.57 to 4.76, and Pakistan from 5.35 to 3.55.
The pattern across the top half of the chart is what demographers have observed for more than a century. As more children survive, more girls stay in school, more women work outside the home and more families move to cities, people tend to have fewer children. What is new is how fast it has happened in places where it began late.
| Region | 2000 | 2024 | Countries below 2.1 |
|---|---|---|---|
| Sub-Saharan Africa | 5.94 | 3 of 48 | |
| Middle East & N. Africa | 4.26 | 7 of 23 | |
| South Asia | 3.34 | 5 of 6 | |
| Latin America | 2.67 | 31 of 42 | |
| North America | 2.00 | 3 of 3 | |
| Europe & Central Asia | 1.62 | 52 of 58 | |
| East Asia & Pacific | 1.94 | 18 of 37 |
Can a government change the slope?
Almost every government at the bottom of the chart is now trying to push its line back up. China introduced a national childcare subsidy of 3,600 yuan a year for each child under three in 2025. South Korea has spent heavily on parental leave, housing and cash support. Hungary uses the tax system.
The record so far is modest. Cash and leave can help families have the children they already want, a little sooner. They have rarely brought fertility back up to replacement. The reasons people give for having fewer children, including the cost of housing and education, long working hours, later marriage and the difficulty of combining careers with caregiving, are not easily fixed by a bonus.
What the lines don't show
- Two years, not the path between them. A straight line from 2000 to 2024 hides swings in between. Several countries rose in the 2000s and fell again after 2015. The tables include a small chart of each listed country's full path.
- Estimates, not counts. For many countries, the 2024 figure is a World Bank modelled estimate drawn from the UN's projections, and some will be revised. China does not publish an official total fertility rate every year.
- Averages within countries. National averages hide big internal gaps: between Bihar and Delhi in India, or between cities and rural areas almost everywhere.
A world past its peak in births
The UN's latest projections expect the world's population to peak at around 10.3 billion in the mid-2080s, then start to decline. They also find that two-thirds of people already live in a country where fertility is below 2.1. On our data, that share is 67%.
Read the chart again with that in mind. The thick lines that matter most for the world's future, India, China, Indonesia, Brazil, the United States, all end near or below the dark bar. The countries still well above it are mostly in Africa, and they are falling too. The ladder slopes downhill almost everywhere, and the question for the rest of this century is not whether the lines keep falling but where they will stop.
Sources and method
- World Bank, World Development Indicators: Fertility rate, total (births per woman), SP.DYN.TFRT.IN. 2000 and 2024 values, API updated October 8, 2026
- World Bank country classifications (regions)
The total fertility rate is the number of children a woman would have if she lived to the end of her childbearing years and had children at each age at the rates observed in that year. Values are World Bank estimates, which are compiled largely from the UN Population Division's World Population Prospects and national statistics; recent years for some countries are modelled. Only economies with values for both 2000 and 2024 are drawn. Regional aggregates are excluded. Replacement level is taken as 2.1 births per woman, the usual approximation for countries with low child mortality.
Charts like this, from your own numbers.
Connect a spreadsheet or the tools you run on, and Parity builds the dashboard and writes the report, with every number checked.
Try Parity free

