Key takeaways
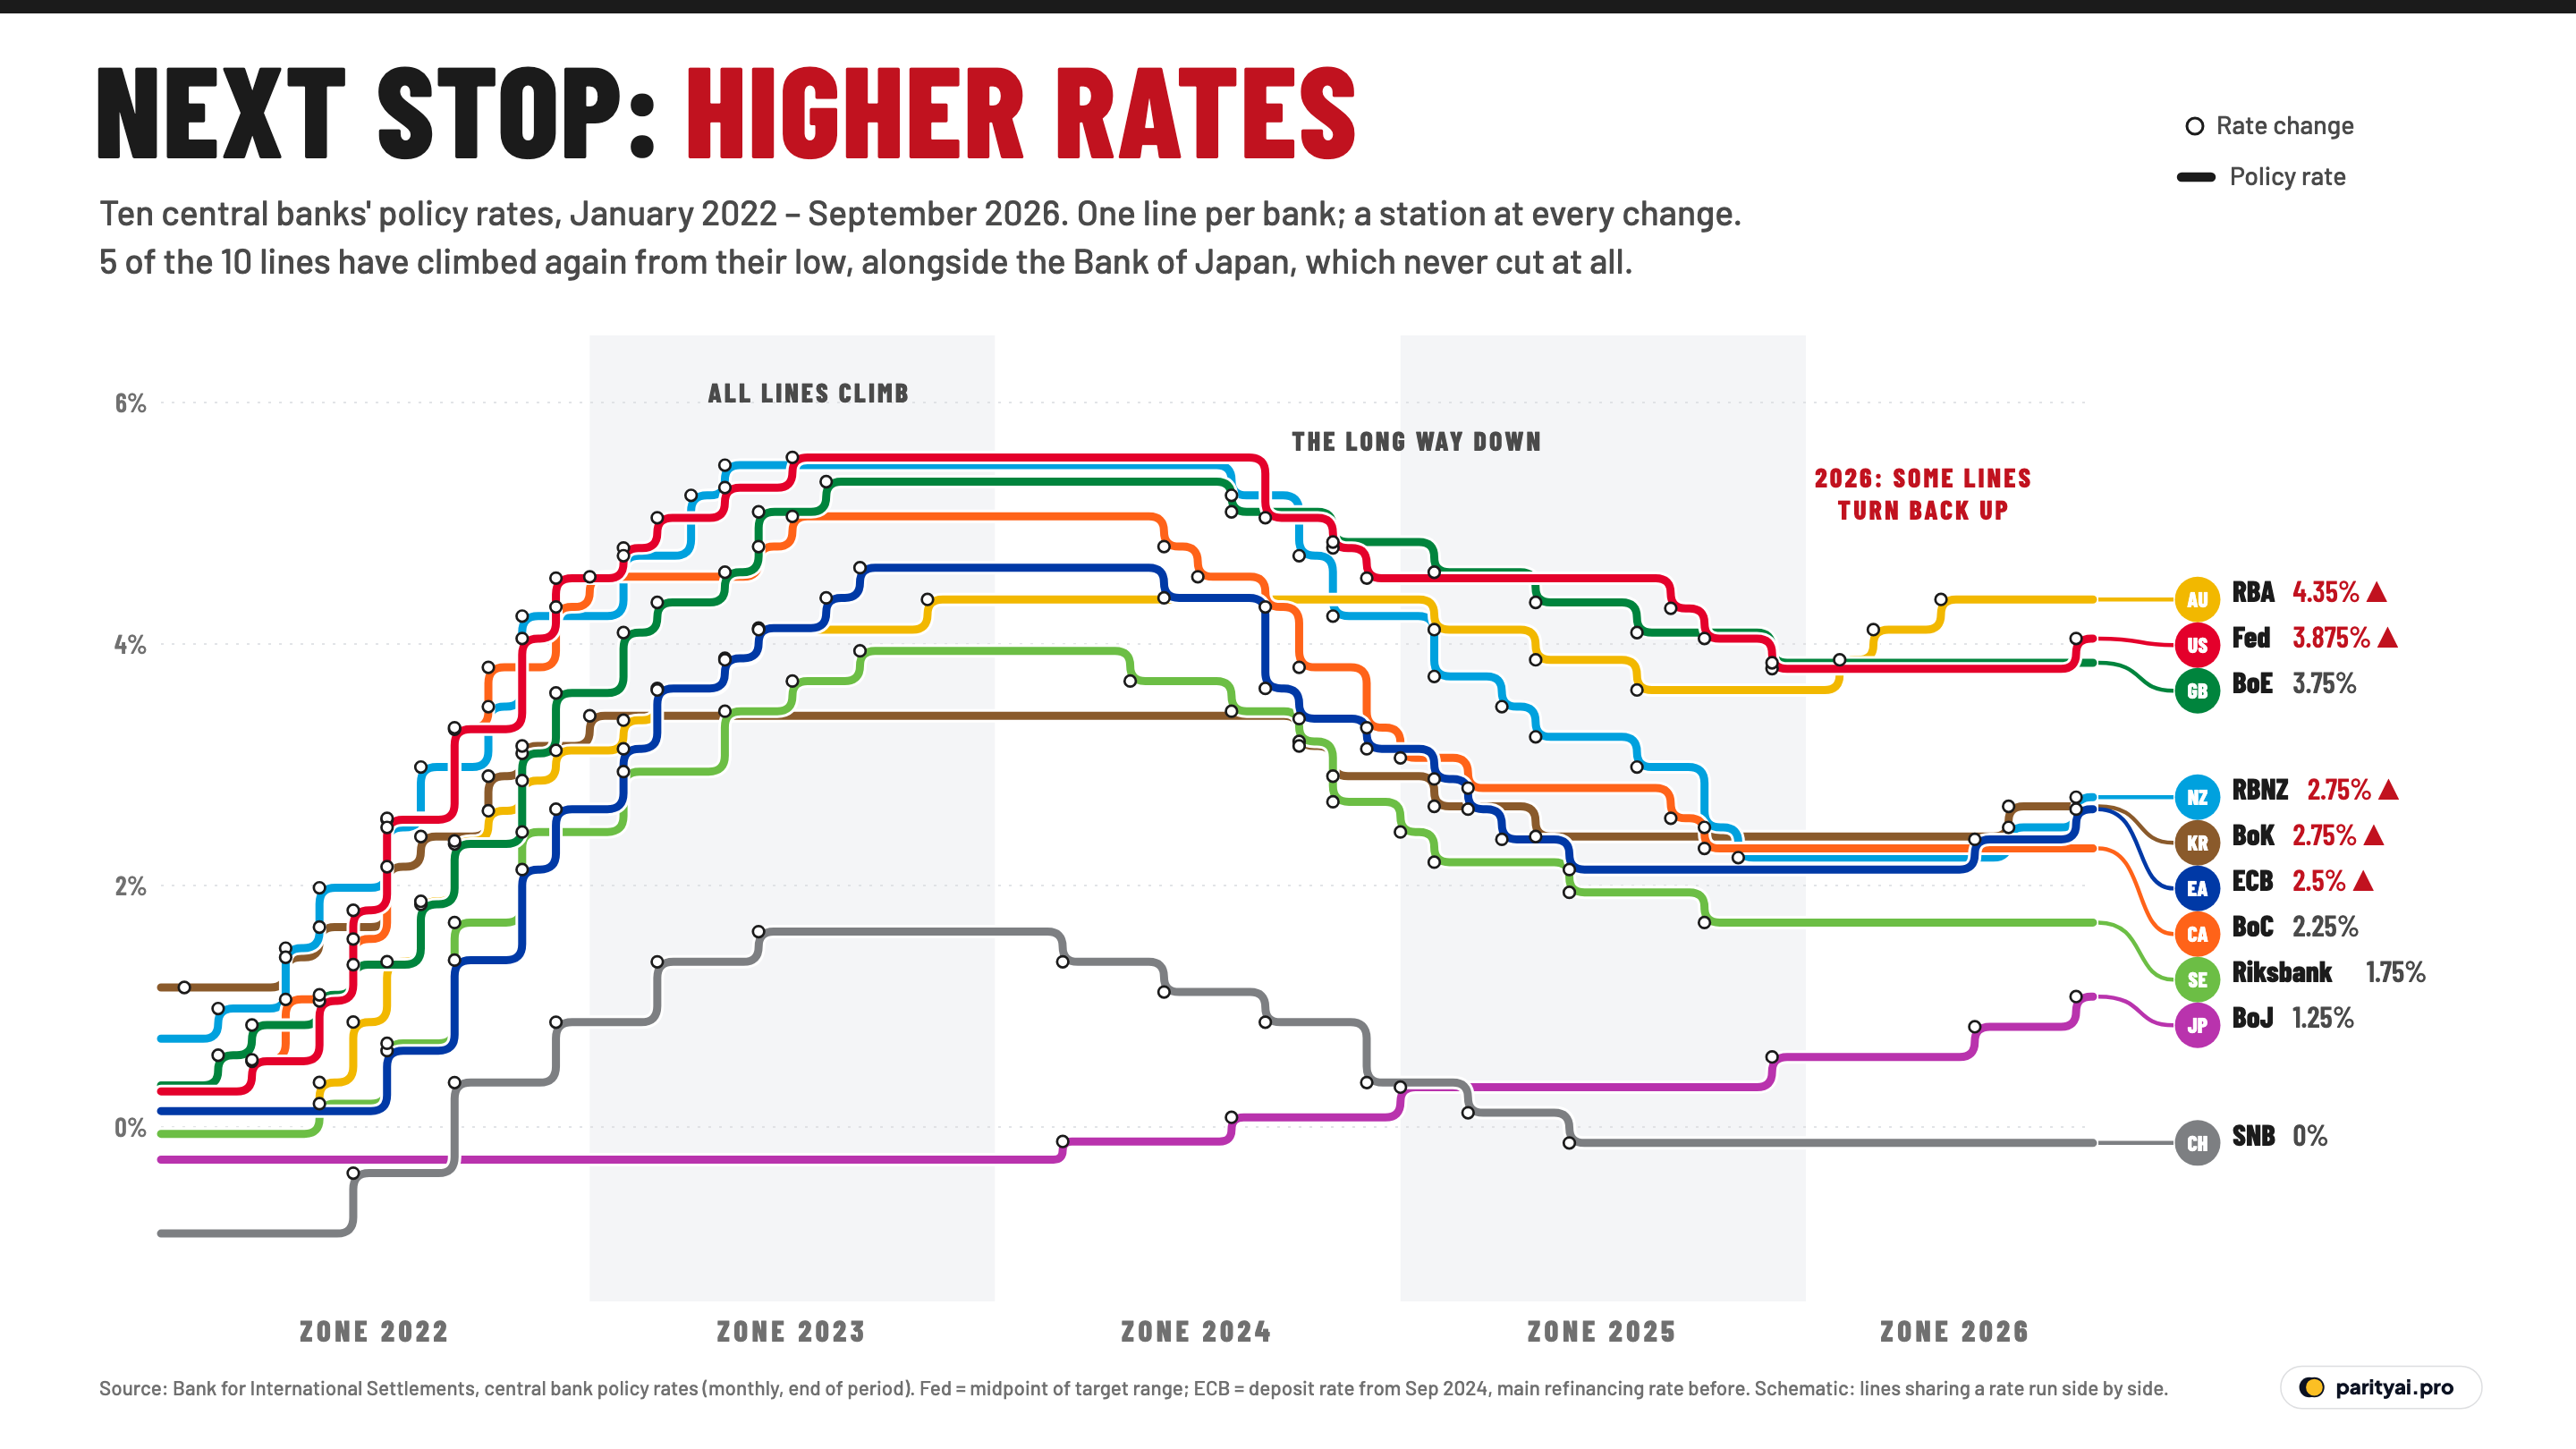
- Ten major central banks made 162 rate moves between January 2022 and September 2026. Almost all of them first climbed sharply and then cut for two years.
- In 2026 the direction changed again. The Fed, ECB, RBA, RBNZ, BoK have all raised rates from their lows, and the Bank of Japan kept rising.
- The cause is the oil shock that followed the war in the Persian Gulf, which pushed inflation back up just as central banks thought the job was done.
Every journey on this map starts in the same place: the bottom. In January 2022, at the left edge of the chart, money had rarely been cheaper. The Federal Reserve's target rate sat at 0.125%, the midpoint of a near-zero range. The European Central Bank's main rate was 0%. The Swiss National Bank and the Bank of Japan were still charging banks to park money with them, at -0.75% and -0.1%.
The chart follows ten central banks from there to September 2026, using the Bank for International Settlements' monthly record of policy rates. Each bank is a line, coloured like a transit route. Where a rate holds, the line runs flat; where it changes, the line drops or climbs and passes a station. Lines that share a rate run side by side, a few pixels apart, as subway lines do on a shared stretch of track. The terminus labels on the right show where each bank stands now, with a red arrow for those that have started climbing again.
Here is the trip, line by line.
The Red Line: the Federal Reserve
The Fed climbed fastest and highest. From March 2022 it raised rates at almost every meeting, in steps as big as three-quarters of a point, until its target range peaked at 5.25–5.5% in July 2023 (the line plots the midpoint, 5.375%). It made 12 increases in all, if you count by month.
It held that peak for more than a year, then began cutting in late 2024 and kept going through 2025, reaching a low of 3.625% in December 2025. In September 2026 the line turned back up. On September 16 the Fed raised its target range by a quarter point, to 3.75–4%, by a 12–0 vote, saying inflation "remains elevated." The statement cited geopolitical developments. The red line ends at 3.875%.
The Blue Line: the European Central Bank
The ECB started later, in July 2022, and rose to 4.5% by September 2023. Its line takes a sharp extra step down in September 2024. That isn't a rate cut. It is where the BIS series switches from the main refinancing rate to the deposit rate, which the ECB now treats as its main policy rate. Read the earlier stretch as the refinancing rate and the later one as the deposit rate.
The deposit rate bottomed at 2% in June 2025. In 2026 the ECB raised it twice. The second rise, on September 10, took it to 2.5%. "The conflict in the Middle East continues to generate inflation pressures," the bank said, and it projected inflation at 3% this year.
The Green Line: the Bank of England
The Bank of England began raising rates in December 2021, earlier than the Fed or the ECB, and made 13 increases to a peak of 5.25% in August 2023. It cut slowly through 2024 and 2025, reaching 3.75% in December 2025.
It is one of the lines still running flat. In September 2026 it held at 3.75%, but three of its nine policymakers voted to raise rates to 4%. The bank noted that protracted conflict in the Middle East had pushed energy prices up further. UK inflation was 3.1% in August and expected to reach about 3.75% by the end of the year. The green line may be about to turn too.
The Orange Line: the Bank of Canada
Canada's line has the deepest descent among the big economies. It climbed to 5% by July 2023, then made 9 cuts in a row to reach 2.25% by October 2025. That is less than half its peak. It has stayed there through September 2026, one of the few lines on the right of the map with no arrow.
The Yellow Line: the Reserve Bank of Australia
Australia's line has the strangest shape. The RBA climbed more slowly than most, to 4.35% by November 2023, and then sat there for well over a year without cutting. It finally lowered rates three times in 2025, reaching 3.6% in August.
Then, in 2026, it reversed. The RBA raised rates in February, March and May, back to 4.35%, the same level as its 2023 peak, noting that "the disruption to global oil supply is adding directly to inflation." Its line on the map ends in August 2026, the latest month in the BIS data. Reports at the end of September said it raised rates again, but that move isn't on this chart yet.
The Cyan and Brown Lines: New Zealand and Korea
New Zealand's central bank reached the highest peak on the map, 5.5% in May 2023, and then cut further than most, to 2.25% by November 2025. It has since raised twice, to 2.75%. The Bank of Korea moved early and stopped early: it peaked at 3.5% in January 2023, fell to 2.5%, and has edged back to 2.75% (the latest BIS figure is for July 2026).
The Grey and Lime Lines: Switzerland and Sweden
Two lines finish low and flat. The Swiss National Bank climbed from negative rates to a peak of only 1.75%, then cut all the way back to 0% by June 2025. Swiss inflation never rose as far as elsewhere, and a strong franc keeps import prices down. Sweden's Riksbank peaked at 4% and has held at 1.75% since October 2025.
The Purple Line: the Bank of Japan
The Bank of Japan's line is the outlier on the map. It runs flat along the bottom for more than two years, at -0.1%, while every other line climbs above it. When the others started cutting, Japan started raising: it ended negative rates in 2024 and has risen step by step ever since, with 6 increases and no cuts.
Its most recent move, in September 2026, took its policy rate to about 1.25%, the highest in more than three decades, according to market reports. The bank pointed to underlying inflation nearing its 2% target and a weak yen pushing up import prices. The purple line has only ever gone one way.
| Central bank | Dec 2021 | Peak | Low after peak | Latest | Path since 2022 | Hikes | Cuts | Since the low (pts) |
|---|---|---|---|---|---|---|---|---|
| Federal Reserve | 0.125% | 5.375% (Jul 2023) | 3.625% | 3.875% | 12 | 6 | ▲ 0.25 | |
| European Central Bank | 0% | 4.5% (Sep 2023) | 2% | 2.5% | 12 | 8 | ▲ 0.50 | |
| Bank of England | 0.25% | 5.25% (Aug 2023) | 3.75% | 3.75% | 13 | 6 | 0 | |
| Bank of Canada | 0.25% | 5% (Jul 2023) | 2.25% | 2.25% | 10 | 9 | 0 | |
| Reserve Bank of Australia | 0.1% | 4.35% (Nov 2023) | 3.6% | 4.35%* | 16 | 3 | ▲ 0.75 | |
| Reserve Bank of New Zealand | 0.75% | 5.5% (May 2023) | 2.25% | 2.75% | 12 | 9 | ▲ 0.50 | |
| Sveriges Riksbank | 0% | 4% (Sep 2023) | 1.75% | 1.75% | 8 | 8 | 0 | |
| Bank of Korea | 1% | 3.5% (Jan 2023) | 2.5% | 2.75%* | 9 | 4 | ▲ 0.25 | |
| Swiss National Bank | -0.75% | 1.75% (Jun 2023) | 0% | 0% | 5 | 6 | 0 | |
| Bank of Japan | -0.1% | 1.25% (Sep 2026) | – | 1.25% | 6 | 0 | 0 |
Monthly, end of period, January 2022 to September 2026. Hikes and cuts count months with a change. * Latest available month is earlier: RBA Aug 2026, BoK Jul 2026. Highlighted banks have raised rates again from their low.
Why the lines turned
The map's three zones tell the story of the past five years in monetary policy.
2022–2023: the climb. As economies reopened after the pandemic, demand outran supply, and Russia's invasion of Ukraine sent energy and food prices soaring. Inflation reached levels not seen since the 1980s. Central banks responded with the fastest run of rate increases in decades, which is why the left side of the map is a thicket of stations.
2024–2025: the long way down. Inflation eased as supply chains healed and energy prices fell. Central banks cut gradually, wary of declaring victory too soon. By late 2025 most lines had come down a long way, though few returned anywhere near their 2021 starting points.
2026: the turn. The war that began on February 28 choked off oil and gas shipments through the Strait of Hormuz. Energy prices surged and inflation picked up again, reaching banks that had only just finished cutting. By the Bank of England's September meeting, it noted, Brent crude was around $106 a barrel. In inflation-targeting terms, that is a supply shock, which central banks usually try to look through. When it comes on top of years of above-target inflation, though, the risk is that expectations start to drift upward, and that is what most of these banks moved to prevent. The ECB, the Fed, the RBA, the RBNZ and the Bank of Korea have all raised rates from their lows this year, and the Bank of England is close to doing the same.
Reading the map carefully
A subway map trades precision for clarity, and this one does too.
- Months, not meetings. The BIS records the rate at the end of each month. Two moves in the same month show as one station, and the exact day of a decision isn't shown.
- Definitions differ. The Fed's line is the midpoint of its target range. The ECB's switches between two rates in September 2024. Japan's is a target for the overnight call rate. The levels are comparable, but not identical in meaning.
- Lines are offset. Where banks share a rate, their lines are drawn a few pixels apart so all of them stay visible. The offset is cosmetic.
- The latest month varies. Some banks' data run only to August or July 2026, so the most recent decisions, such as Australia's at the end of September, may be missing.
For now, the direction of travel is clear. After two years of heading down the line, half the network has switched tracks, and the next stops are higher.
Sources and method
- Bank for International Settlements, Central bank policy rates (WS_CBPOL), monthly, end of period. Retrieved October 9, 2026
Rates are the BIS series for each central bank's main policy rate at the end of each month. The Fed's is the midpoint of its target range. For the euro area, BIS uses the deposit facility rate from September 18, 2024 and the main refinancing rate before, so the ECB line steps between the two definitions at that date. A month with a different rate from the month before counts as a change; two moves inside one month show as one. The map is schematic: where lines share a rate they run side by side, a few pixels apart.
Charts like this, from your own numbers.
Connect a spreadsheet or the tools you run on, and Parity builds the dashboard and writes the report, with every number checked.
Try Parity free

