Charts like this, from your own numbers.
Connect a spreadsheet or the tools you run on, and Parity builds the dashboard and writes the report, with every number checked.
Try Parity freePut the kettle on, pour a coffee, fry an egg in a little oil, check the phone, turn up the heating, drive to work. Before nine in the morning, an ordinary household in a rich country has touched a dozen of the world's traded raw materials. Every one of them has a benchmark price, set in a port or on an exchange thousands of miles away, and each month the World Bank publishes the averages in a data sheet known as the Pink Sheet.
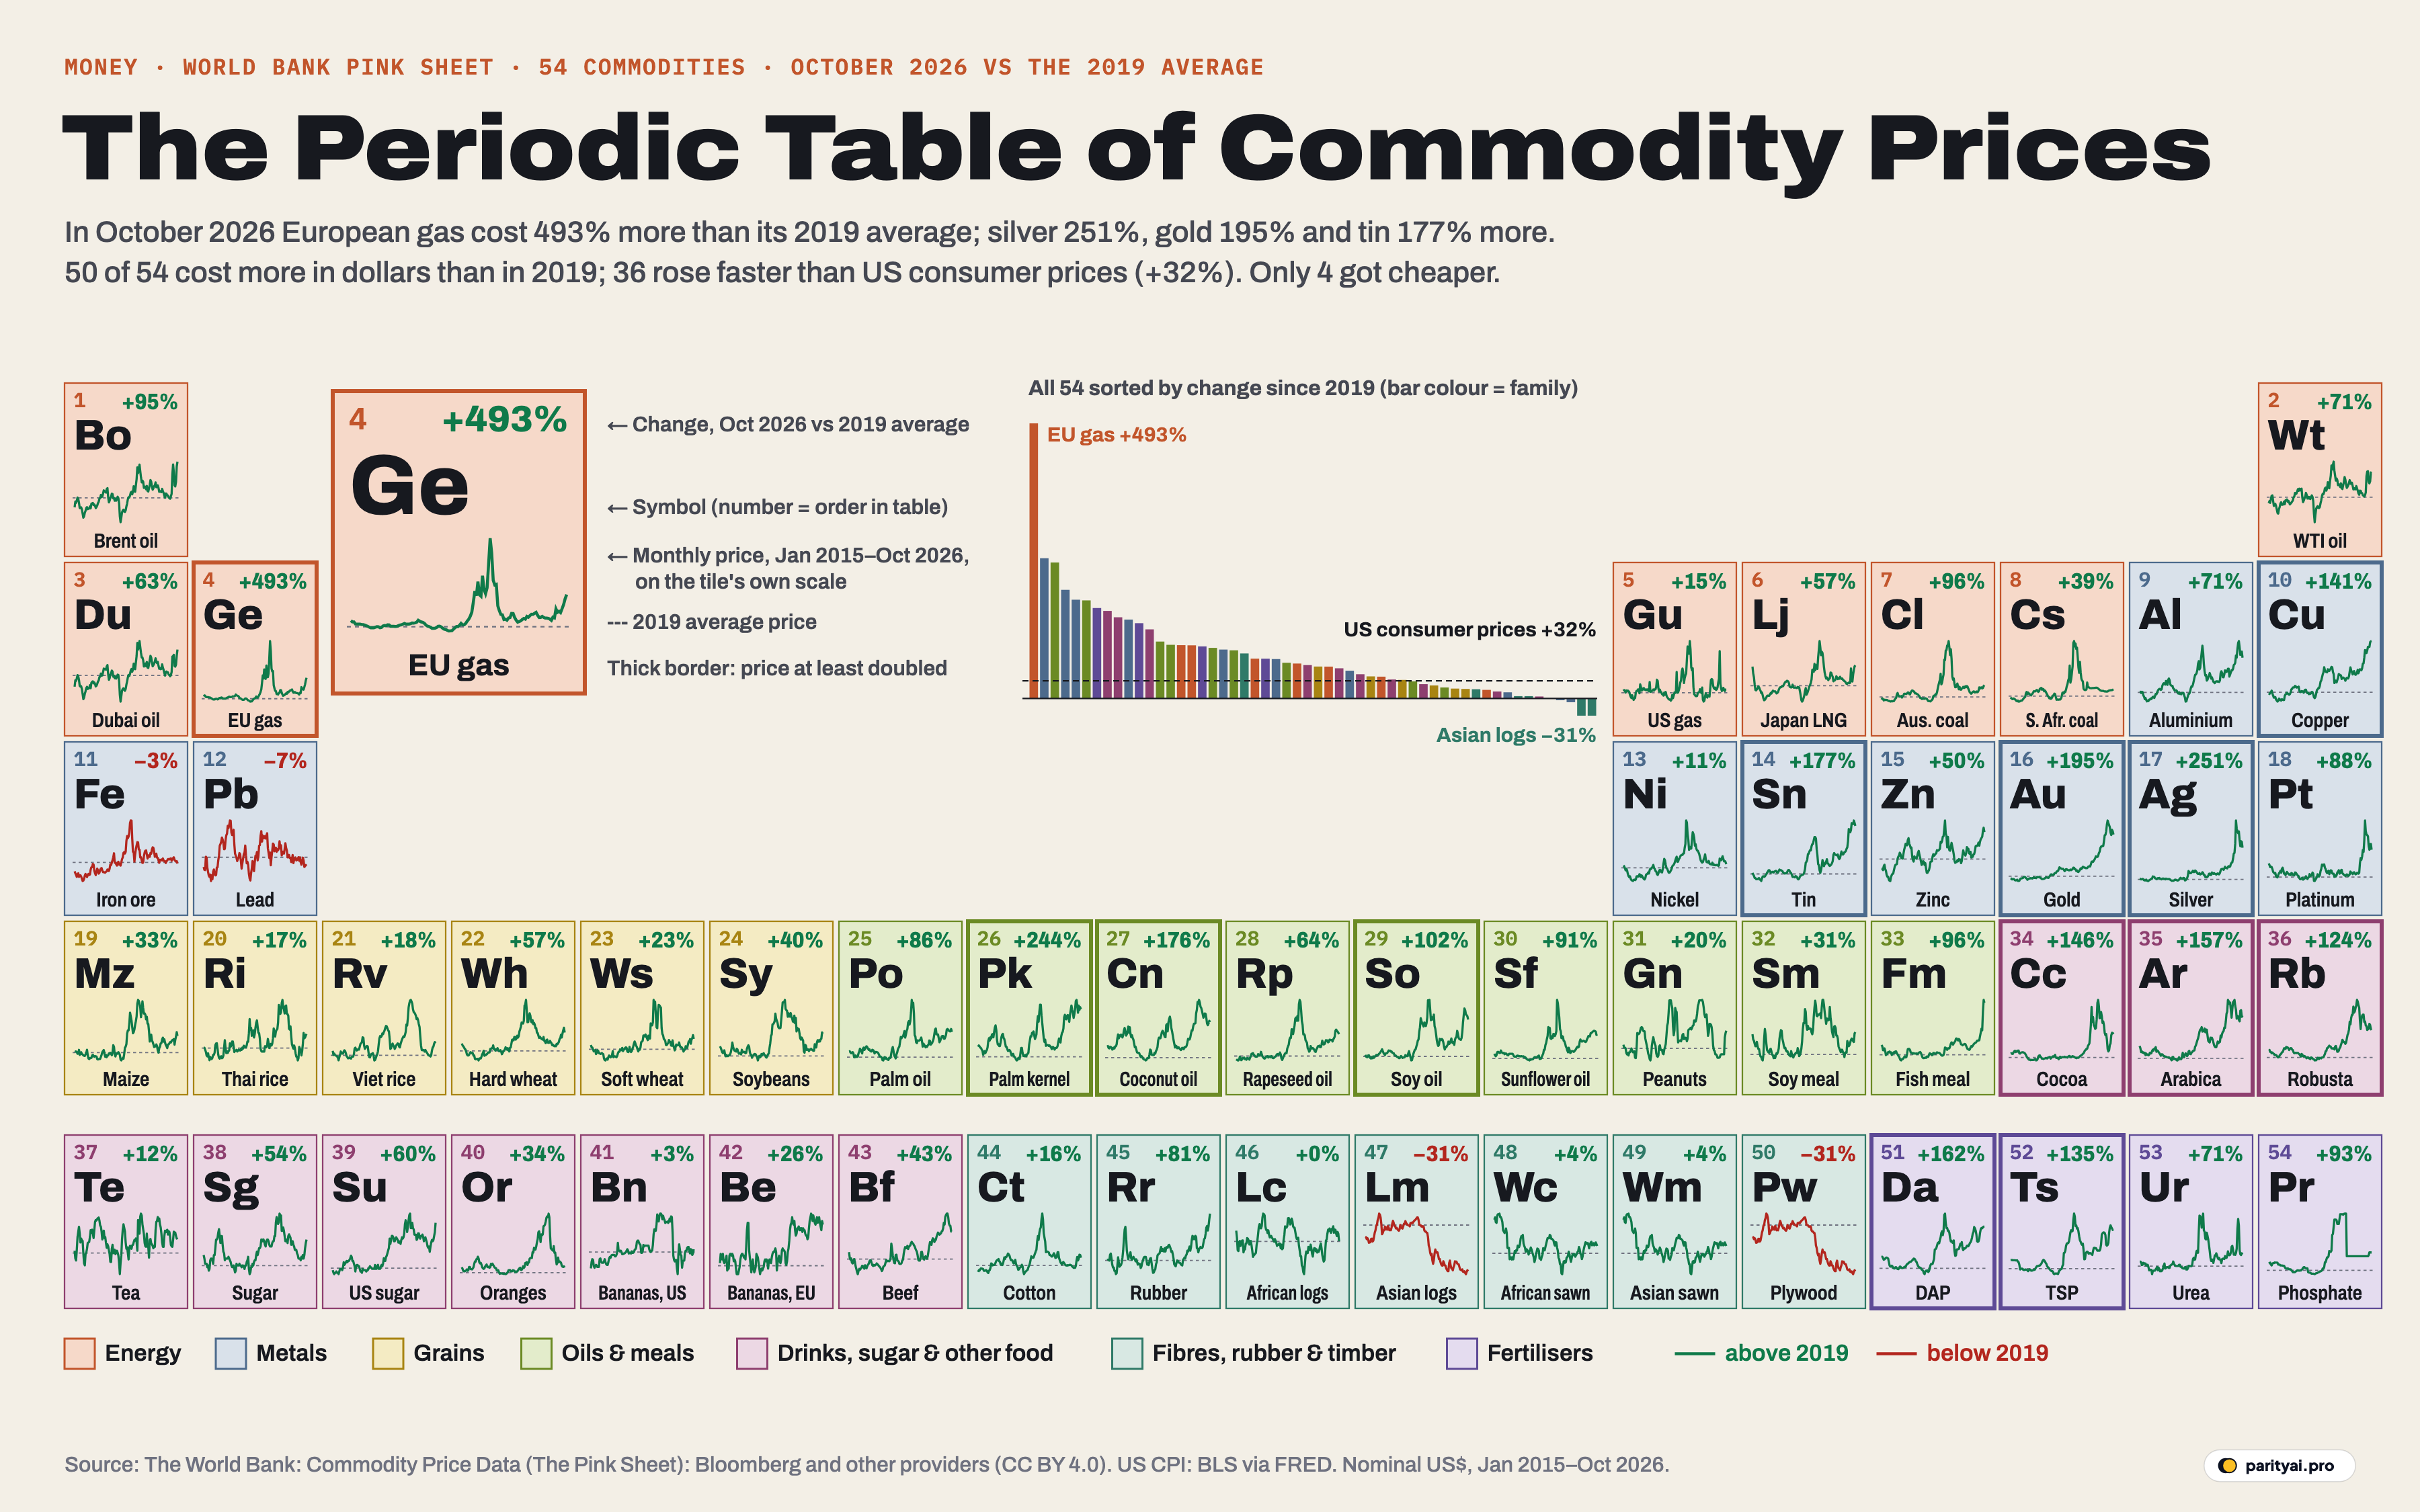
The chart above lays out 54 of those prices like the periodic table that hung on the wall of every school chemistry lab. Each tile is a commodity. Its colour is its family: energy, metals, grains, oils and meals, drinks and sugar and other food, the fibres, rubber and timber that end up in clothes and houses, and the fertilisers that grow the rest. The two-letter symbol is ours, invented for the table (the metals keep their real chemical symbols: Cu, Sn, Zn, Ni, Pb, Al, Fe, Au, Ag, Pt). The number in the corner of each tile compares the October 2026 price with the average for 2019, the last full year before the pandemic upended supply chains. The little line is the monthly price from January 2015 to October 2026, drawn on the tile's own scale, with a dashed line at the 2019 average.
The headline is simple. 50 of the 54 cost more in dollars than they did in 2019, and only 4 cost less. The median change is +58%. But US consumer prices also rose, by 32% between the 2019 average and September 2026 according to the Bureau of Labor Statistics, so a commodity has to beat that just to be more expensive in real terms. 36 did.
What follows is a walk through one day, from breakfast to bedtime, using the tiles you would touch along the way.
7:00 a.m., the coffee and the chocolate
Start with the cup. Arabica coffee averaged $9.05 a kilogram at its peak, first reached in February 2025, 214% above its 2019 average. It has eased since, but at $7.40 in October 2026 it is still 157% above 2019. Robusta, the other main coffee bean, is up 124%.
The reasons sit in the fields. Euronews reported in December 2024 that coffee had hit "a 47-year high" after Brazil suffered its worst drought in decades. Earlier that year the World Bank noted that robusta prices "surged to their highest point in three decades" in February 2024 on poor crops in Vietnam and Indonesia. In the United States, buyers also faced tariffs for part of 2025, until an executive order in November 2025 exempted coffee, tea, beef and other foods from the "reciprocal" tariffs and a second order removed the separate 40% tariff on Brazilian coffee.
Cocoa's tile tells one of the most dramatic food stories on the table. At its peak in January 2025 a kilogram of cocoa beans averaged $10.75, 359% above the 2019 average of $2.34. The International Cocoa Organization had forecast that global supply would fall by almost 11% in the 2023/24 season, and reported that Ivorian port arrivals were down 34% year on year, blaming "unfavourable weather conditions and diseases". The World Bank pinned part of the damage on "heavy rains linked to El Niño" in Côte d'Ivoire. Since then the price has fallen 47% from its peak, and by late 2025 the World Bank expected cocoa output to "rebound by more than 10 percent". Yet at $5.75 a kilogram in October 2026, cocoa still costs 146% more than in 2019.
The rest of the breakfast tray is calmer. Tea is up 12%, below inflation. World sugar is up 54%. Bananas shipped to the United States are the flattest fruit in the bowl, up just 3% on 2019 and therefore cheaper in real terms, while the same fruit landed in southern Europe is up 26%. Oranges had a wild ride. The Pink Sheet's orange price, the import price for Mediterranean navels in the European Union, spiked to 382% above 2019 in December 2024. It has since fallen 72% from that peak and sits 34% above 2019.
7:30 a.m., the frying pan
The oils and meals family has a median rise of 91%, second only to fertilisers. Palm kernel oil leads it at 244%, the third-largest rise of all 54, followed by coconut oil at 176% and soybean oil at 102%. Palm oil is up 86% and sunflower oil 91%.
Look along the row and you can see two different shapes. Palm, soybean and sunflower oil share a spike in the spring of 2022, when Russia's invasion of Ukraine choked off the Black Sea's sunflower-oil exports and the FAO's vegetable oil index rose 23.2% in a single month. Sunflower oil peaked 219% above 2019 in March 2022, and it has since fallen 40%.
Palm kernel and coconut oil, by contrast, set their highs far more recently: July 2025 for coconut and April 2026 for palm kernel, at 286% and 292% above 2019. Coconut oil is now 29% below that peak and palm kernel oil 12% below.
8:15 a.m., the commute
Brent crude, the world's main oil benchmark, averaged $125 a barrel in October 2026, 95% above its 2019 average of $64.03. In the Pink Sheet's records that is the highest monthly average since July 2008. West Texas Intermediate is up 71% and Dubai crude 63%. Over the past year Brent has risen 93%. Our Strait of Hormuz story followed what happened to tanker traffic through the Gulf after the war that began in March 2026.
The tile shows how jagged the year has been. Brent jumped in March and April, fell back through the summer, and then climbed again to October's high. It is also pulling away from its American and Gulf cousins: WTI and Dubai are still below the highs they set in June 2022, by 15% and 11%. Among energy tiles, Brent ranks third, a hair behind Australian coal, and the family's median change is 67%.
9:00 a.m., the thermostat
The biggest numbers on the whole table are in the corner where the heating comes from. European natural gas, priced at the Dutch TTF hub, cost $28.50 per million British thermal units in October 2026. Its 2019 average was $4.80. That is a rise of 493%, the largest of all 54 commodities. Liquefied natural gas imported by Japan is up a far gentler 57%.
Look closely at the EU gas tile and you will see two mountains. The first, in August 2022, came as Russia cut pipeline flows to Europe; at that peak the monthly average was 1358% above 2019. The price then fell sharply through 2023 and stayed between roughly $8 and $16 for the next three years. The second mountain is still forming. On March 2, 2026 QatarEnergy halted production of liquefied gas after attacks, and Dutch gas prices rose by as much as 45% in a day; Qatar supplies around 12% to 14% of Europe's LNG imports. Two weeks later, Iranian strikes put two of the 14 liquefaction trains at Ras Laffan, Qatar's export complex, out of action, roughly 17% of its capacity, and a Qatari official said repairs would take up to five years. European gas has more than doubled in the past year, rising 162%, though it is still 59% below the 2022 peak.
American gas tells the opposite story. Henry Hub, the US benchmark, is up just 15% on 2019, the smallest rise in the energy family, and it is 8% lower than a year ago. Gas is a regional market in a way oil is not, and the table shows it: the same molecule costs vastly different amounts on either side of the Atlantic.
Coal, the older heating fuel, has given back most of its 2022 surge. Australian thermal coal peaked 453% above 2019 in September 2022 and is now up 96%; South African coal peaked in April 2022 and is up 39%.
| # | Commodity | Family | Oct 2026 vs 2019 | 2015–2026 | Peak since 2020 vs 2019 |
|---|---|---|---|---|---|
| 1 | Natural gas, Europe (Netherlands TTF) | Energy | ▲ 493% | +1358% (August 2022) | |
| 2 | Silver | Metals | ▲ 251% | +468% (January 2026) | |
| 3 | Palm kernel oil | Oils & meals | ▲ 244% | +292% (April 2026) | |
| 4 | Gold | Metals | ▲ 195% | +260% (February 2026) | |
| 5 | Tin | Metals | ▲ 177% | +197% (August 2026) | |
| 6 | Coconut oil | Oils & meals | ▲ 176% | +286% (July 2025) | |
| 7 | DAP fertiliser (diammonium phosphate) | Fertilisers | ▲ 162% | +211% (April 2022) | |
| 8 | Coffee, arabica | Drinks, sugar & other food | ▲ 157% | +214% (February 2025) | |
| 9 | Cocoa beans | Drinks, sugar & other food | ▲ 146% | +359% (January 2025) | |
| 10 | Copper | Metals | ▲ 141% | +141% (October 2026) | |
| 11 | TSP fertiliser (triple superphosphate) | Fertilisers | ▲ 135% | +191% (April 2022) | |
| 12 | Coffee, robusta | Drinks, sugar & other food | ▲ 124% | +258% (February 2025) | |
| 13 | Soybean oil | Oils & meals | ▲ 102% | +156% (May 2022) | |
| 14 | Fish meal | Oils & meals | ▲ 96% | +101% (September 2026) | |
| 15 | Coal, Australian thermal | Energy | ▲ 96% | +453% (September 2022) | |
| 16 | Crude oil, Brent | Energy | ▲ 95% | +95% (October 2026) | |
| 17 | Phosphate rock | Fertilisers | ▲ 93% | +295% (September 2023) | |
| 18 | Sunflower oil | Oils & meals | ▲ 91% | +219% (March 2022) | |
| 19 | Platinum | Metals | ▲ 88% | +182% (January 2026) | |
| 20 | Palm oil | Oils & meals | ▲ 86% | +196% (March 2022) | |
| 21 | Rubber, TSR 20 | Fibres, rubber & timber | ▲ 81% | +81% (October 2026) | |
| 22 | Crude oil, West Texas Intermediate | Energy | ▲ 71% | +101% (June 2022) | |
| 23 | Urea | Fertilisers | ▲ 71% | +277% (April 2022) | |
| 24 | Aluminium | Metals | ▲ 71% | +104% (May 2026) | |
| 25 | Rapeseed oil | Oils & meals | ▲ 64% | +164% (April 2022) | |
| 26 | Crude oil, Dubai | Energy | ▲ 63% | +83% (June 2022) | |
| 27 | Sugar, US | Drinks, sugar & other food | ▲ 60% | +72% (November 2023) | |
| 28 | Wheat, US hard red winter | Grains | ▲ 57% | +159% (May 2022) | |
| 29 | Liquefied natural gas, Japan | Energy | ▲ 57% | +125% (September 2022) | |
| 30 | Sugar, world (ISA) | Drinks, sugar & other food | ▲ 54% | +108% (September 2023) | |
| 31 | Zinc | Metals | ▲ 50% | +71% (April 2022) | |
| 32 | Beef | Drinks, sugar & other food | ▲ 43% | +72% (March 2026) | |
| 33 | Soybeans | Grains | ▲ 40% | +100% (June 2022) | |
| 34 | Coal, South African thermal | Energy | ▲ 39% | +320% (April 2022) | |
| 35 | Oranges | Drinks, sugar & other food | ▲ 34% | +382% (December 2024) | |
| 36 | Maize (corn) | Grains | ▲ 33% | +105% (April 2022) | |
| 37 | Soybean meal | Oils & meals | ▲ 31% | +74% (January 2023) | |
| 38 | Bananas, Europe | Drinks, sugar & other food | ▲ 26% | +32% (June 2025) | |
| 39 | Wheat, US soft red winter | Grains | ▲ 23% | +111% (March 2022) | |
| 40 | Groundnuts (peanuts) | Oils & meals | ▲ 20% | +54% (January 2024) | |
| 41 | Rice, Vietnamese 5% broken | Grains | ▲ 18% | +80% (December 2023) | |
| 42 | Rice, Thai 5% broken | Grains | ▲ 17% | +58% (January 2024) | |
| 43 | Cotton, A Index | Fibres, rubber & timber | ▲ 16% | +110% (May 2022) | |
| 44 | Natural gas, US Henry Hub | Energy | ▲ 15% | +242% (August 2022) | |
| 45 | Tea, average of three auctions | Drinks, sugar & other food | ▲ 12% | +32% (August 2022) | |
| 46 | Nickel | Metals | ▲ 11% | +144% (March 2022) | |
| 47 | Sawnwood, Cameroon (sapele) | Fibres, rubber & timber | ▲ 4% | +10% (May 2021) | |
| 48 | Sawnwood, Malaysian (meranti) | Fibres, rubber & timber | ▲ 4% | +10% (May 2021) | |
| 49 | Bananas, US import price | Drinks, sugar & other food | ▲ 3% | +47% (December 2022) | |
| 50 | Logs, Cameroon (sapele) | Fibres, rubber & timber | 0% | +9% (January 2021) | |
| 51 | Iron ore | Metals | ▼ 3% | +128% (June 2021) | |
| 52 | Lead | Metals | ▼ 7% | +21% (August 2021) | |
| 53 | Plywood | Fibres, rubber & timber | ▼ 31% | +5% (January 2021) | |
| 54 | Logs, Malaysian (meranti) | Fibres, rubber & timber | ▼ 31% | +5% (January 2021) |
Highlighted rows rose by more than US consumer prices (+32%) over the same period. Nominal US dollars. Source: The World Bank: World Bank Commodity Price Data (The Pink Sheet), with the data providers listed in the CSV.
11:00 a.m., the things in your hands
The metals family has a median rise of 79%, but it splits in two. Tin is up 177%, the fifth-largest rise on the table, and its price in August 2026 was the highest monthly average in the Pink Sheet's records, which go back to 1960. Tin is the metal in solder, so every circuit board needs it. Tin reached a record of $56,800 a tonne on the London Metal Exchange on January 26, 2026, with traders pointing to mining in Myanmar's Wa State, which had been suspended for nearly three years, and to problems with Indonesian export permits.
Copper is up 141%, and October 2026 is its highest month in the series, at $14,508 a tonne. On September 7, three-month copper on the LME set a record of $14,533 a tonne as traders bet that Washington would extend tariffs to refined copper, exchange stocks ran low, and mine supply struggled to keep pace with demand from data centres and power grids. Aluminium is up 71%, and it hit its own high in May 2026.
Then there is whatever is on your finger. Silver has the second-largest rise of all 54, at 251%, and gold is fourth at 195%. Both set their highest monthly averages at the start of this year: silver $92.10 a troy ounce in January 2026, gold $5,020 in February 2026. Since then silver has fallen 38% and gold 18%, so even the two best performers in the family are well off their highs. Platinum, peaking in the same month as silver, is up 88%.
The other half of the family has drifted back to earth. Nickel spiked in March 2022, 144% above its 2019 level, and has since fallen 54%; it is now up just 11%. The US Geological Survey estimates that Indonesia mined 62% of the world's nickel in 2024. Iron ore, the raw material for steel, is down 3%, and lead is down 7%. They are two of the four tiles below 2019, and the only two metals in that group.
1:00 p.m., lunch
Grains rose less than you might guess from the headlines of 2022. The family's median change is 28%. Hard red winter wheat peaked in May 2022 at 159% above 2019, as Russia and Ukraine together accounted for around 30% of world wheat exports, but it has since fallen 39% from that peak and is now up 57%. Soft red winter wheat, the other American wheat on the table, is up only 23%. Maize is up 33% and soybeans 40%.
Rice had a separate shock. In July 2023 India banned exports of non-basmati white rice to protect domestic supply, as retail prices had risen 11.5% in a year. The Pink Sheet's Thai rice price peaked in January 2024, 58% above 2019, and Vietnamese rice peaked a month earlier. They are now up 17% and 18%, less than inflation.
The purple tiles at the end of the bottom row show what the farmers who grew all this had to buy. Fertilisers have the highest median rise of any family, 114%. DAP, a phosphate fertiliser, is up 162%, and TSP, another, is up 135%. Phosphate rock, the raw material behind them, is up 93%, and urea, the nitrogen fertiliser, 71%. Three of the four peaked in April 2022. Urea has since fallen 55% from that peak, but DAP has fallen only 16%: at $803 a tonne it is closer to its peak than any tile in the grains family is to its own.
7:00 p.m., dinner
Beef sits with the other foods on the bottom row, up 43%. The American cattle herd has been shrinking since 2019, and on January 1, 2026 it numbered 86.2 million head, which Clemson University's livestock specialists called a 75-year low in cattle inventory. The tile's highest monthly price since 2020 came in March 2026, at $8.21 a kilogram, and it has slipped 17% since.
The fish on the plate shows up indirectly. Fish meal, used in animal feed, is up 96%, and it hit its highest price since 2020 as recently as September 2026. Soybean meal, the other feed on the table, is up 31%. The family table below puts all of this side by side.
| Family | Items | Median change | Biggest rise | Smallest rise or biggest fall |
|---|---|---|---|---|
| Fertilisers | 4 | DAP fertiliser (diammonium phosphate) +162% | Urea +71% | |
| Oils & meals | 9 | Palm kernel oil +244% | Groundnuts (peanuts) +20% | |
| Metals | 10 | Silver +251% | Lead −7% | |
| Energy | 8 | Natural gas, Europe (Netherlands TTF) +493% | Natural gas, US Henry Hub +15% | |
| Drinks, sugar & other food | 10 | Coffee, arabica +157% | Bananas, US import price +3% | |
| Grains | 6 | Wheat, US hard red winter +57% | Rice, Thai 5% broken +17% | |
| Fibres, rubber & timber | 7 | Rubber, TSR 20 +81% | Logs, Malaysian (meranti) −31% |
Median of each family's changes, October 2026 against the 2019 average.
10:00 p.m., the shirt and the bookshelf
The fibres, rubber and timber family has the smallest median rise of all: 4%. Cotton is up 16%, and well below its May 2022 high. Rubber is the exception, up 81%, and October 2026 is its highest month of the 2020s.
Timber is where the table turns red. Malaysian logs and plywood are both 31% below their 2019 averages, the largest falls of all 54. Their neighbours barely moved: Cameroonian logs are flat on 2019, and sawn timber from both Cameroon and Malaysia is up 4%. Even the scramble for building materials in 2021 left only a small bump here. The sawnwood tiles peaked in May 2021 at 10% above 2019, a rounding error next to European gas.
What the tiles don't show
The table has limits worth spelling out. Every price is in nominal US dollars. A rise of 32% or less is no rise at all once US inflation is counted (the latest consumer price figure is for September 2026, a month behind the commodity prices), and for buyers who pay in euros, yen or rupees, exchange rates move the cost further. These are wholesale benchmark prices at a port or an exchange, not what anyone pays in a shop: a jar of coffee or a bar of chocolate contains labour, packaging, transport and margins that dilute a commodity's swing. Each tile's line is drawn on its own vertical scale, so a tile with a dramatic-looking line may have moved less in percentage terms than a flatter neighbour; read the number, not the slope. And comparing one month with a year's average is a snapshot. Choose a different month and the ranking would shift, as the gap between each commodity's peak and its current price shows.
The table is also limited by what the World Bank publishes. Uranium, olive oil, pork, salmon and wool are not in the Pink Sheet at all. Barley, sorghum, shrimp and tobacco appear but do not run to October 2026, so they are left out. Lamb, chicken, potash and groundnut oil are left out for a different reason: the series switched to another product or origin after 2019, and a comparison across that switch would not be like for like. Beef, palm oil and fish meal were replaced too, more recently and with closer equivalents, so treat those three tiles with a little more caution.
| Commodity | Peak month | Peak vs 2019 | Now vs 2019 | Now vs peak |
|---|---|---|---|---|
| Oranges | December 2024 | +382% | +34% | ▼ 72% |
| Coal, South African thermal | April 2022 | +320% | +39% | ▼ 67% |
| Natural gas, US Henry Hub | August 2022 | +242% | +15% | ▼ 66% |
| Coal, Australian thermal | September 2022 | +453% | +96% | ▼ 65% |
| Natural gas, Europe (Netherlands TTF) | August 2022 | +1358% | +493% | ▼ 59% |
| Iron ore | June 2021 | +128% | −3% | ▼ 58% |
| Urea | April 2022 | +277% | +71% | ▼ 55% |
| Nickel | March 2022 | +144% | +11% | ▼ 54% |
| Phosphate rock | September 2023 | +295% | +93% | ▼ 51% |
| Cocoa beans | January 2025 | +359% | +146% | ▼ 47% |
| Cotton, A Index | May 2022 | +110% | +16% | ▼ 45% |
| Wheat, US soft red winter | March 2022 | +111% | +23% | ▼ 42% |
The 12 commodities furthest below their highest monthly price since January 2020.
The day, priced
Add the day up and the pattern is clear. Many of the biggest jumps since 2019 are in things that are hard to replace quickly when supply fails: gas that has to travel by pipe or tanker, tin and copper that come from a handful of mines, cocoa and coffee that take years to grow back after drought and disease. Gold and silver are their own category, and fertilisers sit quietly behind the food. The items cheaper than in 2019 are a small group: Malaysian logs, plywood, lead and iron ore. 13 commodities have at least doubled, and only one of them, copper, is at its highest price of the whole period. The periodic table on a classroom wall never changes; this one will look different by next spring.
Sources and method
- The World Bank: World Bank Commodity Price Data (The Pink Sheet): Bloomberg Finance L.P., S&P Global and the other data providers named for each series in this story's CSV. Monthly averages in nominal US dollars, January 2015 to October 2026, from the update of November 3, 2026, retrieved November 5, 2026. Used under CC BY 4.0. Parity selected the series and calculated the averages, changes and rankings shown here; the World Bank has not endorsed this use
- World Bank Terms of Use for Datasets. Anyone reusing this data must keep the same attribution
- Creative Commons Attribution 4.0 International
- US Bureau of Labor Statistics, Consumer Price Index for All Urban Consumers (CPIAUCSL, via FRED)
Each price is the monthly average benchmark price in the World Bank's Pink Sheet, in nominal US dollars (for example cocoa beans per kilogram, Brent per barrel, EU gas per million British thermal units). The change compares October 2026 with the average of the 12 months of 2019, the last full year before the pandemic. Price lines run from January 2015 to October 2026 and are drawn on each tile's own scale; the dashed line is the 2019 average. Prices are not adjusted for inflation; US consumer prices rose by the amount given in the article between 2019 and September 2026, the latest month published, so a commodity has to beat that to have risen in real terms. Barley, sorghum, shrimp and tobacco are left out because their series stop before October 2026. Lamb, chicken, potash and groundnut oil are left out because the Pink Sheet moved them to a different product or origin after 2019, so a comparison with 2019 would not be like for like. Benchmarks can still change definition: the World Bank replaced the beef series in January 2024, palm oil in January 2026 and fish meal in July 2026, and several oils and oilseeds changed delivery point over the period. The two latest months of Japanese LNG are World Bank estimates.
Charts like this, from your own numbers.
Connect a spreadsheet or the tools you run on, and Parity builds the dashboard and writes the report, with every number checked.
Try Parity free

