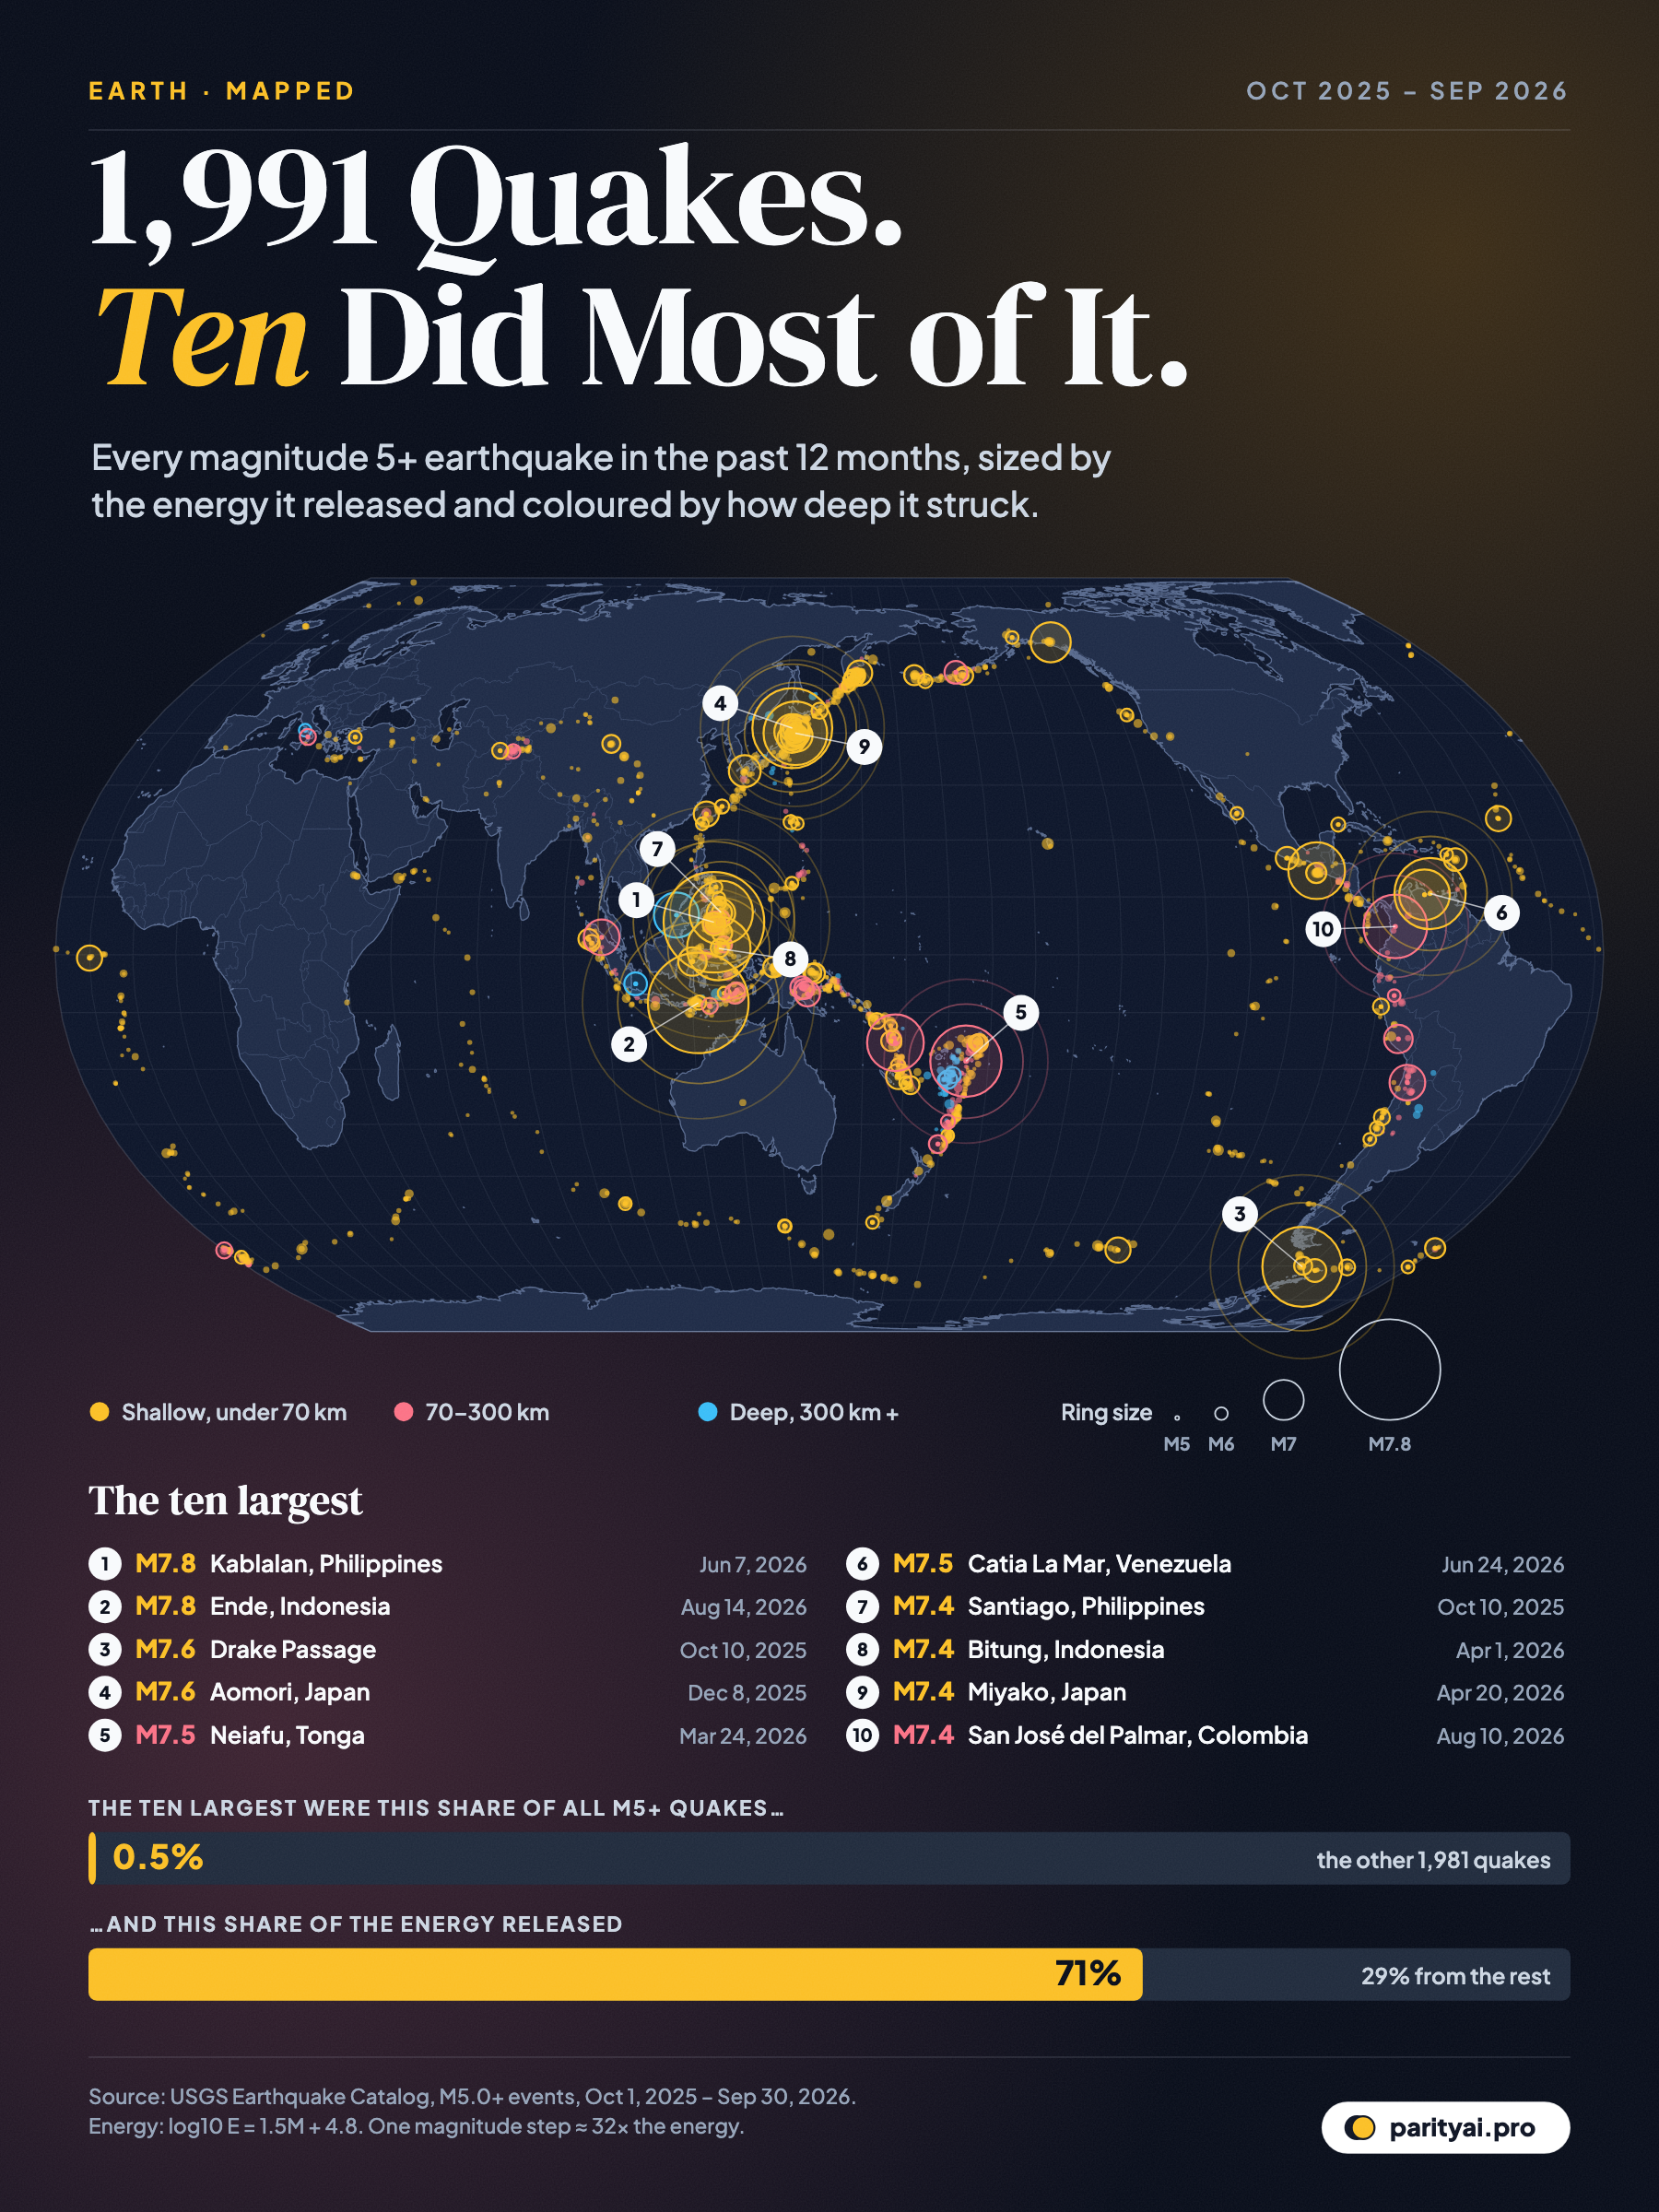
Earthquakes are counted like raindrops, but they behave like a lottery. Most of the 1,991 magnitude 5+ quakes on the map above passed with little damage: a magnitude 5.0 releases roughly as much energy as 500 tonnes of TNT, and most struck under the sea floor or far from any town. A handful of large ruptures did almost all the work.
The graphic plots every event in the USGS earthquake catalog from October 1, 2025 to September 30, 2026 that reached magnitude 5.0. Each ring is centred on the epicentre, and its radius grows with the size of the seismic waves. The colour shows depth: amber for shallow quakes in the top 70 km of the crust, rose for intermediate depths, and blue for the deep events more than 300 km down. The ten largest are numbered. The bars at the bottom answer the question the map raises: how much of the shaking came from so few quakes?
Why ten quakes dominate the total
The answer lies in how magnitude works. Magnitude is a logarithmic scale. According to the USGS, each whole-number step means a tenfold increase in the measured wave amplitude and about 32 times more energy. Two steps mean roughly 1,000 times the energy.
That compounding is what the bottom of the graphic shows. Of the 1,991 events, 1,855 were between magnitude 5.0 and 5.9. They made up 93% of the quakes but only about 6% of the energy. The 15 quakes of magnitude 7 or more were less than 1% of the count, yet they released roughly 81% of it.
At the very top, the two M7.8 events each released about 15.1% of the year's estimated seismic energy. We estimate energy with the Gutenberg–Richter relation (log₁₀ E = 1.5M + 4.8, with E in joules). On that formula each M7.8 quake released energy on the order of 502 Hiroshima bombs, and the whole year's M5+ activity came to roughly 3,300. These are order-of-magnitude comparisons, not precise measurements. Most of the energy goes into heat and fracturing rock, not into the waves that shake buildings.
The ten largest earthquakes
| # | Magnitude | Location (USGS) | Date (UTC) | Depth | Share of the year's energy | PAGER |
|---|---|---|---|---|---|---|
| 1 | 7.8 | 25 km SW of Kablalan, Philippines | 2026-06-07 | 57 km | Orange | |
| 2 | 7.8 | 66 km NNW of Ende, Indonesia | 2026-08-14 | 10 km | Orange | |
| 3 | 7.6 | Drake Passage | 2025-10-10 | 6 km | Green | |
| 4 | 7.6 | 2025 Aomori Prefecture, Japan Earthquake | 2025-12-08 | 41 km | Yellow | |
| 5 | 7.5 | 158 km W of Neiafu, Tonga | 2026-03-24 | 234 km | Green | |
| 6 | 7.5 | 20 km W of Catia La Mar, Venezuela | 2026-06-24 | 10 km | Red | |
| 7 | 7.4 | 12 km E of Santiago, Philippines | 2025-10-10 | 59 km | Green | |
| 8 | 7.4 | 129 km ESE of Bitung, Indonesia | 2026-04-01 | 35 km | Green | |
| 9 | 7.4 | 102 km ENE of Miyako, Japan | 2026-04-20 | 25 km | Green | |
| 10 | 7.4 | 2 km SE of San José del Palmar, Colombia | 2026-08-10 | 108 km | Red | |
| 11 | 7.3 | 51 km ENE of Luganville, Vanuatu | 2026-03-30 | 121 km | Green | |
| 12 | 7.3 | 60 km WSW of Puerto Madero, Mexico | 2026-07-17 | 22 km | Yellow | |
| 13 | 7.2 | 20 km E of San Felipe, Venezuela | 2026-06-24 | 10 km | Red | |
| 14 | 7.1 | 57 km NNW of Kota Belud, Malaysia | 2026-02-22 | 629 km | Green | |
| 15 | 7.0 | 2025 Hubbard Glacier Earthquake | 2025-12-06 | 10 km | Green |
Ties are ordered by date. Highlighted rows drew a red PAGER alert (estimated 1,000+ deaths or $1 billion+ losses). The CSV has all 1,991 events.
Eight of the ten struck around the Pacific. That is no coincidence. The USGS estimates that about 81% of the planet's largest earthquakes happen along the Ring of Fire, the chain of subduction zones where oceanic plates dive beneath their neighbours. The exceptions were the M7.6 quake in the Drake Passage, between South America and Antarctica, and the M7.5 quake on Venezuela's Caribbean coast.
The two largest came within ten weeks of each other in the summer of 2026. On June 7, 2026 (June 8 local time), an M7.8 quake struck off Mindanao in the southern Philippines at a depth of about 57 km. Waves of up to 1.4 metres were recorded in the coastal town of Kiamba, according to Cotality. The Philippines' disaster council later counted 78 deaths and more than 13,000 homes destroyed, as reported by The Philippine Star. Then on August 14, 2026, a shallow quake struck the island of Flores in Indonesia, 66 km north-northwest of Ende. USGS rates it M7.8; Indonesian agencies put it at 7.7. About 1.5 million people were exposed to strong or severe shaking, according to early reports. News compilations citing Indonesia's disaster agency put the death toll above 100, with more than 180,000 people displaced.
The deadliest quakes were not the biggest
Rank by energy and you get one list. Rank by human cost and you get a very different one.
The USGS runs a system called PAGER that estimates, within minutes, how many people are likely to die and how much damage to expect. A red alert means an estimated 1,000 or more deaths or at least $1 billion in losses, the level that calls for an international response. Orange means 100 to 999 deaths or $100 million to $1 billion. In the twelve months covered here, PAGER issued 4 red alerts and 6 orange ones among M5+ events.
The two M7.8 quakes drew orange alerts. Three of the four reds went to quakes in northern South America that sit lower down the energy ranking.
On June 24, 2026, two large quakes struck Venezuela within about a minute of each other: an M7.2 near San Felipe and an M7.5 near Catia La Mar. They were centred in Carabobo state, about 20 km from Caracas, according to EarthSky. The M7.5 was the strongest to hit Venezuela since a magnitude 7.7 quake in 1900. Both were shallow, about 10 km deep, under one of the most densely populated parts of the country. A month later, AFP reported 5,278 deaths and more than 16,000 injuries, via Eyewitness News. By energy, the Venezuelan pair together released less than either of the two M7.8 events.
Seven weeks later, on August 10, 2026, an M7.4 quake struck near San José del Palmar in western Colombia, at a depth of about 108 km. Colombia's disaster agency later reported 312 deaths and more than 4,000 injuries, according to Adnkronos. On the map it is one ring among dozens along the Andes.
The fourth red alert went to an M6.8 quake in Japan's Kumamoto region on July 28, 2026. It is too small to make the top ten, but PAGER's models flagged its potential for losses because of where it struck.
The lesson is the one disaster researchers repeat after every event: magnitude sets the energy, but depth, distance to cities, soil and building quality set the toll. A shallow M7.5 under a capital region can be far deadlier than a deeper M7.8 offshore.
Japan: a warning that did not come true
On December 8, 2025, an M7.6 quake struck off Aomori Prefecture in northern Japan (the Japan Meteorological Agency measured it at 7.5). It produced tsunami waves of up to 70 cm and injured more than 40 people, according to AFP. Because large quakes are sometimes followed by larger ones, the agency issued an advisory warning of a raised chance of a magnitude 8 or greater quake in the following week. The advisory put that chance at about 1%. It was lifted on December 16 without a larger event.
Japan appears twice more in the top ten, with an M7.4 quake off Miyako in April 2026. Overall, the USGS catalog lists 145 M5+ events in or near Japan over the twelve months. That puts it fourth by place name, behind Indonesia (250), the Philippines (173) and Russia (159).
Russia's high count is mostly a long tail of aftershocks. On July 29, 2025, two months before our window opens, an M8.8 quake struck off the Kamchatka Peninsula. It was one of the largest recorded anywhere in decades, and its aftershocks kept the catalog busy around Petropavlovsk-Kamchatsky and the Kuril Islands well into 2026.
Deep quakes: the blue rings
Most earthquakes happen close to the surface. In this data, 83% of M5+ events were shallower than 70 km, the boundary the USGS uses between shallow and intermediate quakes.
The blue rings are the exceptions. 55 quakes struck 300 km or more below the surface, and the deepest reached 666 km. According to the USGS, all quakes deeper than 70 km happen inside slabs of ocean floor that are sinking into the mantle. On the map, the deep events cluster under Tonga and Fiji, where the Pacific plate plunges steeply, and beneath parts of Indonesia and the western Pacific.
At those depths, rock should be hot and soft enough to flow rather than break, and seismologists still debate exactly how such quakes rupture. The M7.5 quake west of Neiafu, Tonga, in March 2026 struck at about 234 km. Because the shaking had hundreds of kilometres to fade before reaching the surface, a quake that size caused little damage.
Was this an unusual year?
By count, it was busier than recent years. Using the same USGS catalog, calendar years 2020 through 2024 averaged 1,738 quakes of M5+ (2020: 1,450; 2021: 2,227; 2022: 1,726; 2023: 1,780; 2024: 1,507). Calendar 2025 jumped to 2,129, largely because of the Kamchatka aftershock sequence. Our window, which starts in October 2025, sits between the two at 1,991.
By large quakes, it was ordinary. The window had 15 quakes of magnitude 7 or more. Calendar years 2020 to 2024 averaged 13.6, and USGS long-term records suggest about 16 major quakes in a typical year. There was no quake of magnitude 8 or more, against roughly one in an average year. The USGS also notes that rising counts over the decades mostly reflect more seismometers, not more earthquakes.
That makes the energy picture more striking. Even in a year without a great quake, ten events released close to three-quarters of the energy. In a year with an M8.8 like Kamchatka, a single quake would dwarf everything else on this map. One M8.8 releases roughly 30 times the energy of an M7.8.
What the catalog can't tell you
A few caveats matter if you reuse the numbers:
- Magnitudes mix methods. The USGS reports a preferred magnitude for each event. Large quakes almost always use moment magnitude, which best reflects energy. Many smaller ones use body-wave or other magnitudes. Energy shares for the M5 to M6 group are therefore approximate. The dominance of the largest events does not depend on that detail.
- The catalog keeps changing. Magnitudes and locations are revised as analysts review events, and agencies sometimes disagree. Indonesia's Flores quake (7.7 locally, 7.8 at USGS) and Japan's Aomori quake (7.5 at JMA, 7.6 at USGS) are examples.
- The tsunami flag is not a tsunami. In the raw data, 52 events carry a USGS "tsunami" flag. The flag marks large oceanic events for which tsunami information may have been issued, not confirmed waves.
- Place names are the nearest named location, which is why some quakes are labelled by small towns.
Energy is not the same as harm
Seismic hazard is a story of extremes. Planning around the average year misses the point, because the average is set by a few rare, enormous events. For the people living through them, though, the size that matters is not the magnitude on the map. It is how close the shaking comes and how well the buildings around them were made. Venezuela and Colombia, neither of them at the top of the energy ranking, carried most of this year's human cost.
Sources and method
- USGS Earthquake Catalog (ComCat), FDSN event API. All events with magnitude ≥ 5.0 from 2025-10-01 to 2026-09-30 UTC, retrieved October 8, 2026
- USGS: How much bigger is a magnitude 8.7 earthquake than a magnitude 5.8?
- Natural Earth land (via world-atlas)
Energy per quake is estimated with the Gutenberg–Richter relation, log10 E = 1.5 M + 4.8 (E in joules), applied to the catalog's preferred magnitude. The catalog mixes magnitude types (mostly moment magnitude for larger events, body-wave magnitude for many smaller ones), so energy shares are estimates; the ranking of the largest events does not depend on that choice. The catalog is revised as events are reviewed, so counts can move slightly after this date.
Charts like this, from your own numbers.
Connect a spreadsheet or the tools you run on, and Parity builds the dashboard and writes the report, with every number checked.
Try Parity free

