Charts like this, from your own numbers.
Connect a spreadsheet or the tools you run on, and Parity builds the dashboard and writes the report, with every number checked.
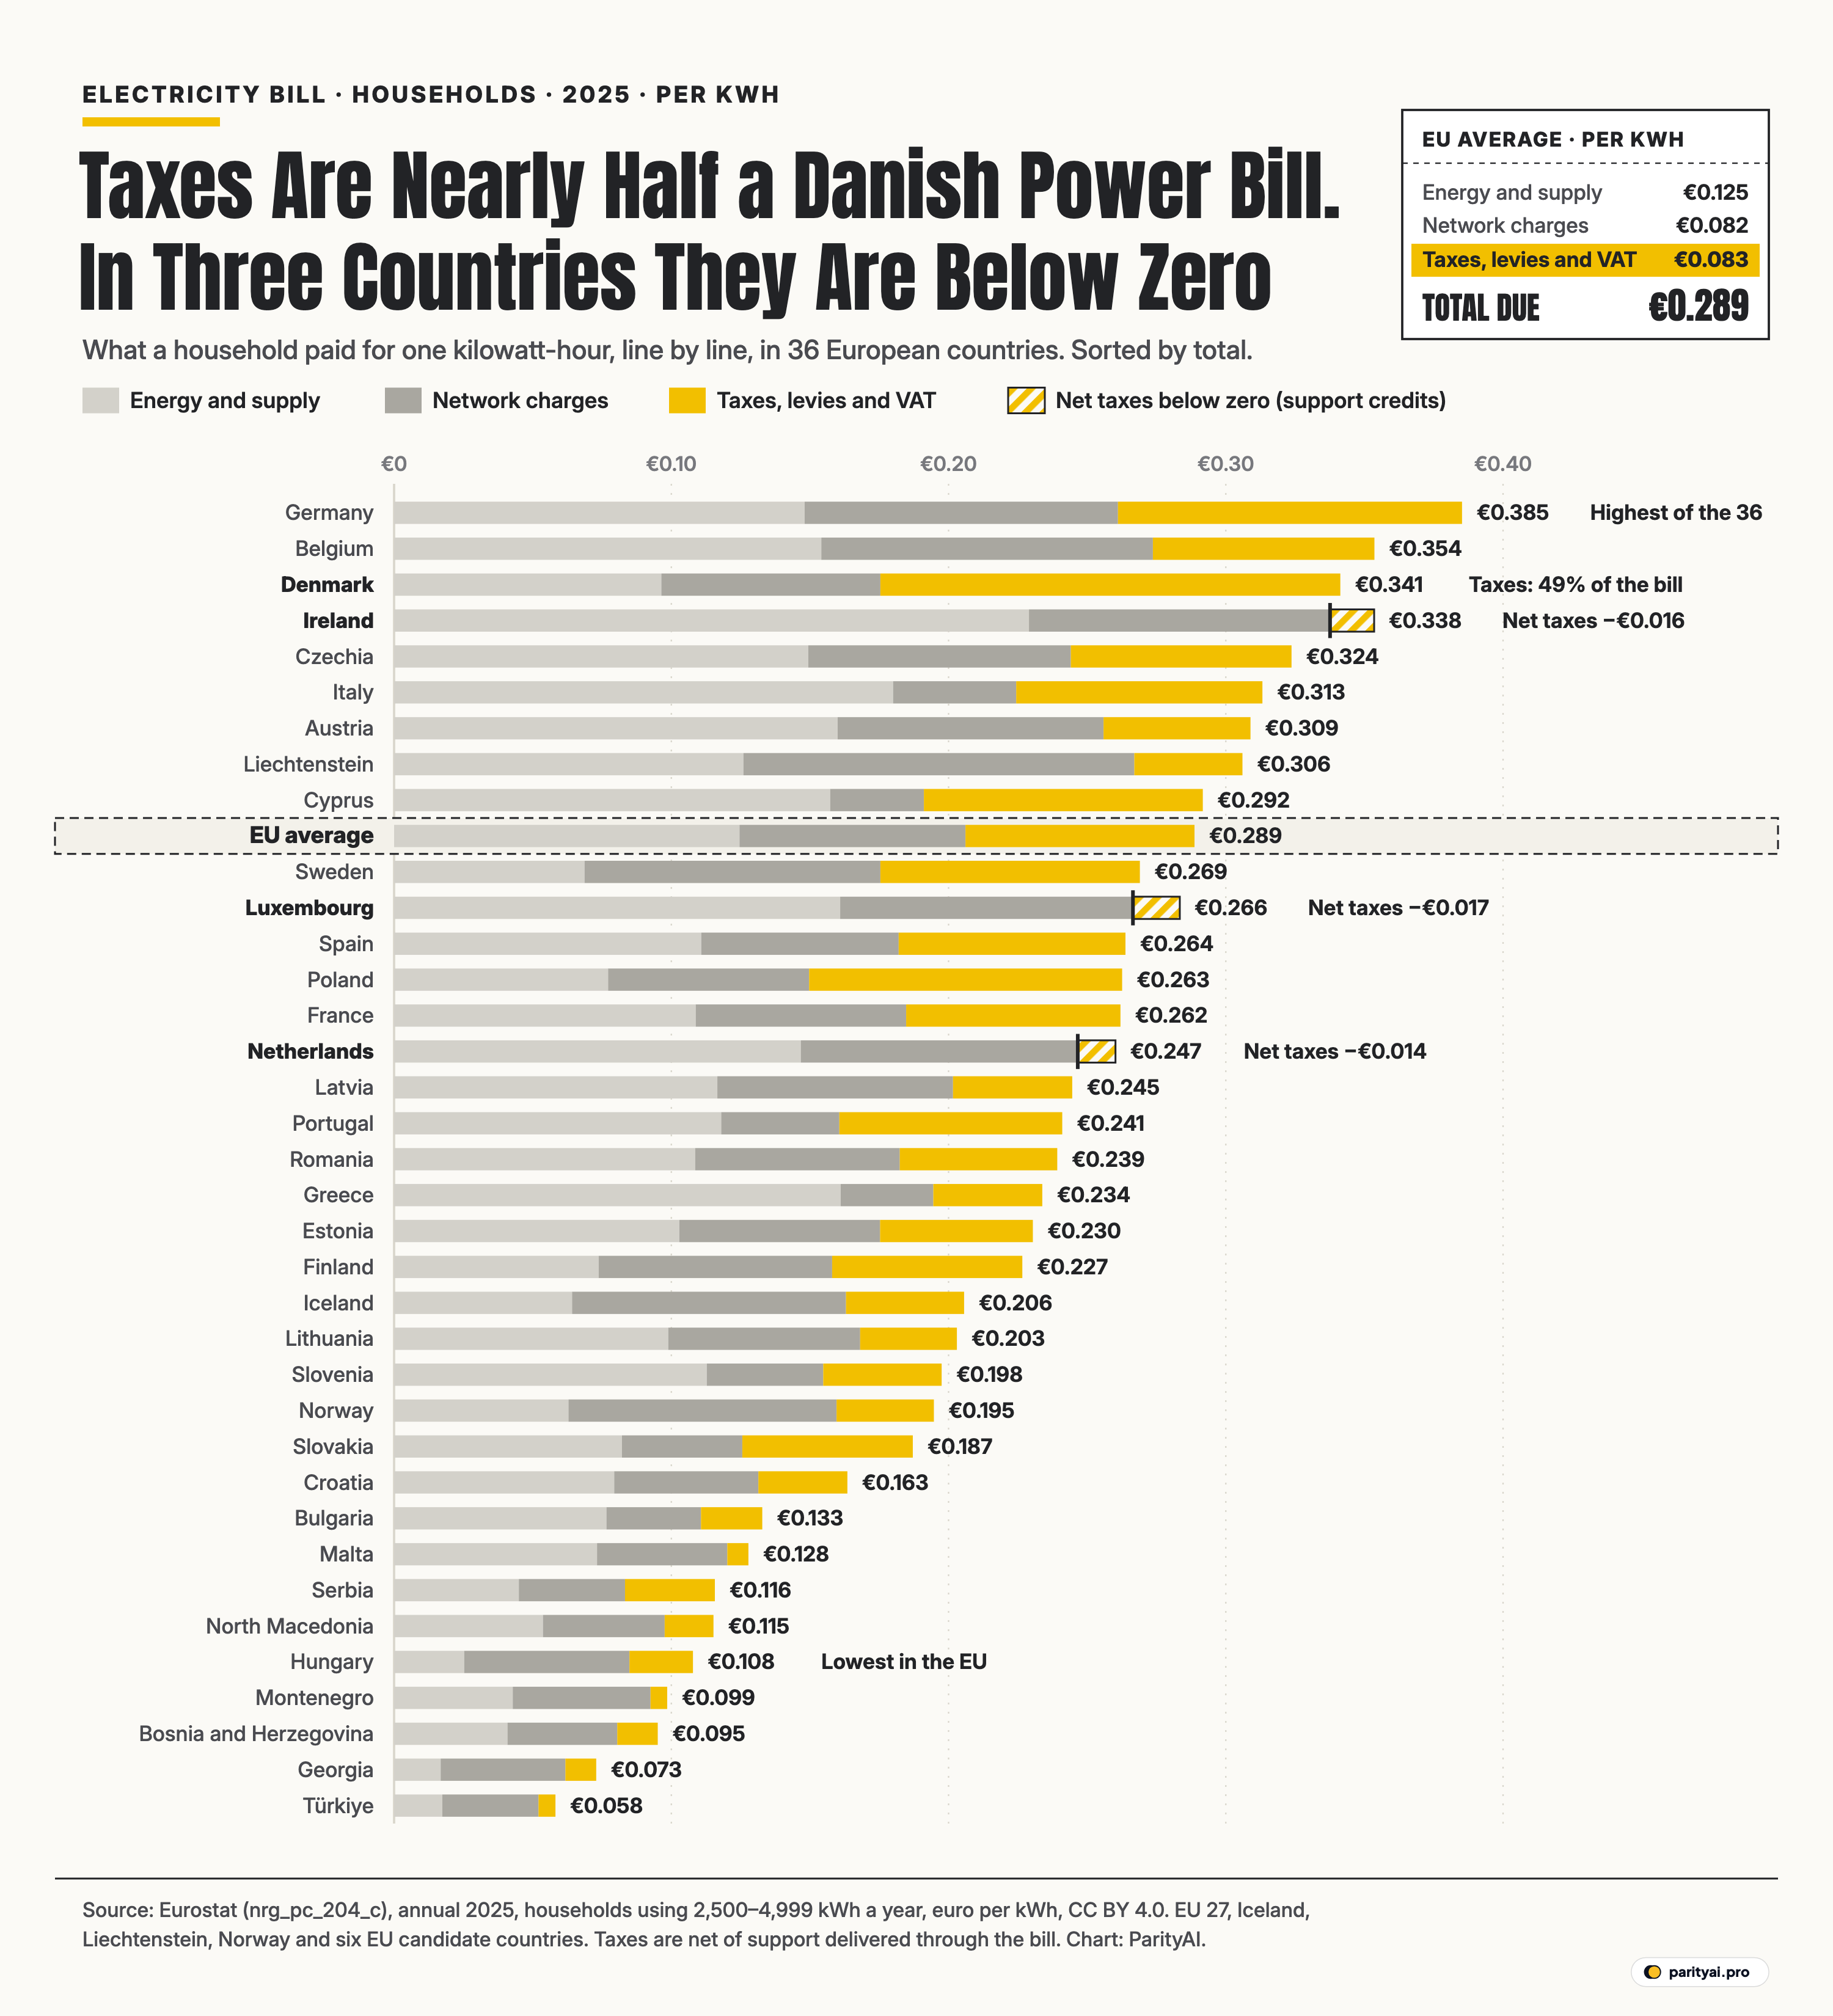
Try Parity freeA kilowatt-hour is the same thing in Berlin and in Budapest. It boils the same kettle and runs the same fridge for the same few hours. In 2025 a German household paid €0.385 for one, and a Hungarian household paid €0.108. That is 3.6 times as much for an identical unit of energy.
Part of that gap is the power itself, and part is the wires that carry it. A large part sits on the lines of the bill that governments write: taxes, levies and VAT. Of the €0.277 that separates the German price from the Hungarian one, €0.101, or 36%, is the difference in taxes alone. In Denmark taxes were 49% of the price. In three countries, Ireland, Luxembourg and the Netherlands, the tax line came out below zero: support paid through the bill was larger than every tax on it.
The numbers come from Eurostat's annual breakdown of household electricity prices (dataset nrg_pc_204_c), published in October 2026 with figures for 2025. It splits the price of a kilowatt-hour into the same pieces a bill does. So this piece is laid out like a bill too, one line at a time, ending where every bill ends: the total due.
Account details
The chart above has one bar per country, 36 in all: the 27 EU members, Iceland, Liechtenstein and Norway, and six EU candidate countries. Each bar is the price of one kilowatt-hour in euro, cut into three pieces. The light grey part is energy and supply: generating or buying the power and running the retail business. The darker grey part is network charges, for the transmission and distribution grids. The yellow part is taxes, levies and VAT. Bars are sorted by the total, the most expensive at the top. The dashed row is the EU average.
Three bars end differently. For Ireland, Luxembourg and the Netherlands the grey bars run past the black line that marks the total, and the overhang is striped. The stripes are the amount by which net taxes are negative: the household paid less than the energy and network costs alone.
All prices are for Eurostat's standard household, a home using between 2,500 and 4,999 kWh a year (band DC). Eurostat's own price articles use the same band, which it describes as "medium-sized consumers". Prices are annual averages for 2025, converted to euro at the average exchange rate of the period.
The EU average bill, in the box at the top right, reads like this: €0.125 for energy and supply (43% of the total), €0.082 for the network (28%), €0.083 for taxes, levies and VAT (29%), and €0.289 in total. Only 9 of the 36 countries paid more than that average.
Line 1: Energy and supply
This is the line people usually mean when they talk about the price of electricity: what the supplier pays for power on the wholesale market or from its own plants, plus its costs and margin. It is also the line that varies the most from country to country.
Ireland had the most expensive energy line of any country on the chart, €0.229 per kWh, ahead of Italy at €0.180. Hungary had the cheapest in the EU, €0.025. That Hungarian figure is not a market price in any normal sense. Since August 2022 Hungarian households have paid a regulated tariff, which Eurofound records as HUF 36 per kWh up to a limit of 2,523 kWh a year and HUF 70.1 above it. The limit sits right at the bottom of the standard household band, and that regulated tariff is the background to the figure on the chart.
Malta's prices are also held by policy. Eurofound's record of Malta's measure says the government decided that prices for households and businesses would stay unchanged, an open-ended policy that the 2025 budget continued. Malta's energy line in 2025 was €0.073.
The Nordic countries sit at the other end of the scale. Sweden's energy line was €0.069, Finland's €0.074 and Norway's €0.063. All three are less than half of Germany's €0.148. In all three, though, the grid costs more than the power, as the next line shows.
Line 2: Network charges
Grids cost money whether the power flowing through them is cheap or dear. The network line pays for poles, cables, substations and the companies that run them, and it is the line households can do least about.
The highest network charge on the chart belonged to Liechtenstein, €0.141 per kWh, followed by Ireland at €0.124. Germany paid €0.113, Belgium €0.120. Greece and Cyprus, by contrast, paid only €0.033 and €0.034.
In 9 countries the network line was bigger than the energy line: Liechtenstein, Sweden, Finland, Iceland, Norway, Hungary, Montenegro, Georgia, Türkiye. In Sweden, for example, the grid took €0.107 against €0.069 for the power. In Hungary, with its regulated energy price, the network is also the larger part. Eurostat notes that network costs are mostly distribution, the local grid that reaches each home, and that less densely populated countries need relatively more transmission.
Between Germany and Hungary, the network line explains €0.053 of the gap, and the energy line €0.123. Both are large. But neither is as large as the third line in the case of Denmark.
Line 3: Taxes and levies
Denmark is the clearest example on the chart of a bill shaped by tax. Its energy line, €0.096, and network line, €0.079, add up to €0.175, which would rank 15th of the 27 EU members on price before taxes. Taxes, levies and VAT then added €0.166, the largest tax line of any country, and lifted Denmark to the 3rd most expensive in the EU at €0.341. The Danish tax line on its own is larger than the whole Hungarian bill.
Most of that was not VAT. Of Denmark's €0.166, VAT was €0.070; the rest, €0.096, was other taxes, in Denmark's case almost all of it the electricity tax that Eurostat files as environmental. BDO put that tax at 72 øre per kWh, about €0.10, in 2025. Eurostat's national note for Denmark says no subsidies affected 2025 prices.
Two countries had a tax share of 40% or more: Denmark, Poland. Poland's 43% is the second-highest share, and its total of €0.263 ranked 12th in the EU, but its price before taxes, €0.150, ranked only 22nd. Eurostat's note for Poland says a maximum household price of 500 złoty per MWh, before excise and VAT, applied through the end of 2025. Sweden, at 35%, had the third-highest share.
Germany's tax line, €0.124, was the second largest on the chart after Denmark's, 32% of its price. VAT was €0.061 of it, other taxes and levies €0.063. Eurostat lists several German levies that rose in 2025, among them an offshore grid levy of 0.816 cents per kWh and a levy under the electricity network charges ordinance, the StromNEV levy, of 1.558 cents. Across the EU, 10 of the 27 members had a tax share above the EU average of 29%.
At the other end, some countries taxed household power very lightly. Malta's whole tax line was €0.008, 6% of the price; Montenegro's was €0.006, 6%. Bulgaria's tax line, €0.022, was nothing but VAT.
Line 4: VAT
VAT is the one tax every country on the chart charges. At the EU level VAT was €0.044 per kWh in 2025, 15% of the price.
The share ranged from 21% in Hungary to 5% in Malta. Hungary is a curious case: VAT alone is 21% of its bill, so its tax share of 21% is entirely VAT, even though its total is the lowest in the EU.
Ireland shows how much a rate cut matters. Eurostat's note says Irish VAT on electricity was cut from 13.5% to 9% in May 2022, and the lower rate has been extended to December 2030. Irish VAT came to €0.032 per kWh in 2025, against €0.061 in Germany.
Line 5: Allowances
On a paper bill, an allowance is the line printed in brackets, with a minus sign. Eurostat collects these too. In the 2025 figures, support paid through the bill is netted into the tax line: add up each country's tax items and the total matches the tax line, allowances included. That is how the line can turn negative. Eurostat also publishes the allowances as separate memo items, but their signs are not consistent from country to country, so this chart uses only the net tax line.
| Country | VAT | Other taxes and levies, net (cents) | Net tax line (cents) | Price before taxes |
|---|---|---|---|---|
| Netherlands | €0.043 | ▼ 5.64 | ▼ 1.36 | |
| Ireland | €0.032 | ▼ 4.77 | ▼ 1.59 | |
| Luxembourg | €0.020 | ▼ 3.66 | ▼ 1.69 | |
| Montenegro | €0.018 | ▼ 1.15 | 0.6 | |
| Norway | €0.037 | ▼ 0.23 | 3.51 | |
| Lithuania | €0.035 | 0 | 3.49 | |
| Bulgaria | €0.022 | 0 | 2.21 | |
| North Macedonia | €0.018 | 0 | 1.76 | |
| Hungary | €0.023 | 0 | 2.29 | |
| Georgia | €0.011 | 0 | 1.11 |
The ten countries with the lowest non-VAT tax line in 2025, band DC. VAT is still charged in every one of them; it is the other levies, net of support delivered through the bill, that go below zero. Values in euro cents per kWh except VAT and price before taxes, which are in euro per kWh.
In three countries the allowances were larger than the taxes they were netted against.
The Netherlands. The Netherlands levies an energy tax on every kilowatt-hour, at €0.10154 in 2025 before VAT according to the Meijburg summary of the 2026 tax plan. They also give every household connection a fixed tax reduction, €519.80 in 2026 after a €5.15 cut. Eurostat's note says this reduction is a fixed annual discount "regardless of the amount" consumed. For a household in the standard band, the reduction outweighs the tax: the environmental tax line came to −€0.056 per kWh, and with VAT of €0.043 the net tax line was −€0.014. A fixed discount fits an odd pattern across consumption bands. A small Dutch user (under 1,000 kWh) paid €0.102 per kWh, while a large one (15,000 kWh or more) paid €0.269. In 31 of the 36 countries it is the other way round; the exceptions are Netherlands, Romania, Hungary, Georgia, Türkiye.
Ireland. Ireland's price before taxes, €0.354, was the highest of any country on the chart. The net tax line, −€0.016, made of VAT of €0.032 and other items of −€0.048, pulled the total down to €0.338. Eurostat's note lists the Irish government's electricity credits, the last of them €125 in January or February 2025. Even so, Ireland's total rose by €0.048 from €0.289 in 2024.
Luxembourg. Luxembourg's renewable-energy line, normally a charge, was −€0.038 per kWh in 2025, which left net taxes at −€0.017 despite VAT of €0.020. Its price before taxes, €0.283, was the second highest in the EU after Ireland's. Luxembourg's economy ministry says that from 2026 the state budget, not electricity customers, pays the contribution to the renewables compensation mechanism.
Put the three side by side and the effect is plain. The five EU countries with the highest prices before tax were Ireland, Luxembourg, Belgium, Germany, Netherlands. On the final bill, Ireland was 4th in the EU and the Netherlands 14th, with Luxembourg between them.
Total due
| # | Country | Energy and supply | Network | Taxes, levies and VAT | Total due | Tax share | Change vs 2024 (cents) | Total 2017–2025 |
|---|---|---|---|---|---|---|---|---|
| 1 | Germany | €0.148 | €0.113 | €0.124 | 32% | ▼ 1 | ||
| 2 | Belgium | €0.154 | €0.120 | €0.080 | 23% | 2 | ||
| 3 | Denmark | €0.096 | €0.079 | €0.166 | 49% | ▼ 3.2 | ||
| 4 | Ireland | €0.229 | €0.124 | −€0.016 | -5% | 4.8 | ||
| 5 | Czechia | €0.149 | €0.095 | €0.080 | 25% | ▼ 0.9 | ||
| 6 | Italy | €0.180 | €0.044 | €0.089 | 28% | ▼ 0.6 | ||
| 7 | Austria | €0.160 | €0.096 | €0.053 | 17% | 5 | ||
| 8 | Liechtenstein | €0.126 | €0.141 | €0.039 | 13% | ▼ 1.2 | ||
| 9 | Cyprus | €0.157 | €0.034 | €0.101 | 34% | ▼ 3.3 | ||
| 10 | EU average | €0.125 | €0.082 | €0.083 | 29% | ▼ 0.1 | ||
| 11 | Sweden | €0.069 | €0.107 | €0.094 | 35% | 3.1 | ||
| 12 | Luxembourg | €0.161 | €0.122 | −€0.017 | -6% | |||
| 13 | Spain | €0.111 | €0.071 | €0.082 | 31% | 2.5 | ||
| 14 | Poland | €0.077 | €0.072 | €0.113 | 43% | 3.3 | ||
| 15 | France | €0.109 | €0.076 | €0.077 | 30% | ▼ 2.7 | ||
| 16 | Netherlands | €0.147 | €0.114 | −€0.014 | -6% | 1.2 | ||
| 17 | Latvia | €0.117 | €0.085 | €0.043 | 18% | 0.3 | ||
| 18 | Portugal | €0.118 | €0.043 | €0.080 | 33% | ▼ 1.1 | ||
| 19 | Romania | €0.109 | €0.074 | €0.057 | 24% | 5.2 | ||
| 20 | Greece | €0.161 | €0.033 | €0.039 | 17% | 0.7 | ||
| 21 | Estonia | €0.103 | €0.072 | €0.055 | 24% | 0.5 | ||
| 22 | Finland | €0.074 | €0.084 | €0.069 | 30% | ▼ 1.4 | ||
| 23 | Iceland | €0.064 | €0.099 | €0.043 | 21% | 2.9 | ||
| 24 | Lithuania | €0.099 | €0.069 | €0.035 | 17% | ▼ 2 | ||
| 25 | Slovenia | €0.113 | €0.042 | €0.043 | 22% | ▼ 0.9 | ||
| 26 | Norway | €0.063 | €0.097 | €0.035 | 18% | 0.2 | ||
| 27 | Slovakia | €0.082 | €0.043 | €0.061 | 33% | 0.8 | ||
| 28 | Croatia | €0.079 | €0.052 | €0.032 | 20% | 1.6 | ||
| 29 | Bulgaria | €0.077 | €0.034 | €0.022 | 17% | 1.3 | ||
| 30 | Malta | €0.073 | €0.047 | €0.008 | 6% | ▼ 0.1 | ||
| 31 | Serbia | €0.045 | €0.038 | €0.032 | 28% | 0.6 | ||
| 32 | North Macedonia | €0.054 | €0.044 | €0.018 | 15% | 0 | ||
| 33 | Hungary | €0.025 | €0.060 | €0.023 | 21% | 0.3 | ||
| 34 | Montenegro | €0.043 | €0.050 | €0.006 | 6% | 0 | ||
| 35 | Bosnia and Herzegovina | €0.041 | €0.040 | €0.015 | 15% | 0.7 | ||
| 36 | Georgia | €0.017 | €0.045 | €0.011 | 15% | 0.3 | ||
| 37 | Türkiye | €0.017 | €0.035 | €0.006 | 10% | 0.4 |
Euro per kWh, Eurostat band DC (2,500 to 4,999 kWh a year), annual 2025. Tax share is taxes, levies and VAT divided by the total; it is negative where support delivered through the bill outweighs the taxes. Change is in euro cents per kWh; a red arrow means the bill per kWh went up. Luxembourg has no 2024 figure. Ranks include the EU average row.
Germany's total, €0.385, was the highest of the 36 countries, followed by Belgium at €0.354, Denmark at €0.341 and Ireland at €0.338. The cheapest in the EU were Hungary, Malta, Bulgaria, at €0.108, €0.128 and €0.133. Outside the EU, the candidate countries were cheaper still: Türkiye was lowest of all at €0.058, and Georgia paid €0.073.
Compared with 2024, the total rose in 15 of the 26 EU members with figures for both years and fell in 11. Romania had the largest rise, €0.052 per kWh, followed by Austria at €0.050. In Austria, Eurostat's note says the cut in the electricity levy and a cap on the energy price both ran until the end of 2024. Cyprus had the largest fall, €0.033, then Denmark at €0.032.
The small print
Euro is not purchasing power. A euro buys more in Bucharest than in Copenhagen. Eurostat also publishes prices in Purchasing Power Standard (PPS), which adjust for this. Measured that way the ranking changes a lot: Romania, Czechia and Poland were the most expensive in the EU, and Malta, Hungary and Finland the cheapest. Germany falls to 4th. Poland, 12th in euro, is 3rd in PPS. The euro ranking tells you what a kilowatt-hour costs; the PPS ranking comes closer to how much it hurts.
| Country | Euro per kWh | PPS per kWh | Places moved (PPS rank vs euro rank) |
|---|---|---|---|
| Romania | €0.239 | 16 | |
| Czechia | €0.324 | 3 | |
| Poland | €0.263 | 9 | |
| Germany | €0.385 | ▼ 3 | |
| Italy | €0.313 | 1 | |
| Cyprus | €0.292 | 2 | |
| Belgium | €0.354 | ▼ 5 | |
| Latvia | €0.245 | 7 | |
| Spain | €0.264 | 2 | |
| Portugal | €0.241 | 6 | |
| Greece | €0.234 | 7 | |
| Ireland | €0.338 | ▼ 8 | |
| Austria | €0.309 | ▼ 6 | |
| Denmark | €0.341 | ▼ 11 | |
| Lithuania | €0.203 | 6 | |
| Estonia | €0.230 | 3 | |
| France | €0.262 | ▼ 4 | |
| Slovakia | €0.187 | 5 | |
| Slovenia | €0.198 | 3 | |
| Croatia | €0.163 | 4 | |
| Sweden | €0.269 | ▼ 12 | |
| Bulgaria | €0.133 | 3 | |
| Netherlands | €0.247 | ▼ 9 | |
| Luxembourg | €0.266 | ▼ 14 | |
| Finland | €0.227 | ▼ 5 | |
| Hungary | €0.108 | 1 | |
| Malta | €0.128 | ▼ 1 |
EU countries only, sorted by price in Purchasing Power Standard (PPS), which adjusts for what money buys in each country. A green arrow means the country ranks as more expensive in PPS than in euro. Annual 2025, band DC.
The band matters. Bills carry fixed charges, so a household using little power pays more per kWh. Across the EU, a household using under 1,000 kWh a year paid €0.479 per kWh in 2025, against €0.251 for one using 15,000 kWh or more. In Germany the same two bands paid €0.590 and €0.328. Everything on the chart is for one band, 2,500 to 4,999 kWh, so a country's place can shift for homes that use much more or much less.
Negative taxes are a recording choice. The support behind the stripes is real money, but where it appears depends on how it is paid. Support paid through the bill reduces the reported price. Support paid in other ways, such as Ireland's fuel allowance, which Eurostat notes is not counted in prices, does not. Two countries with the same help for households can look very different on this chart.
Who is on the chart. Eurostat's data are free to reuse under its copyright notice for the EU, EFTA members and official candidate countries. Kosovo, a potential candidate, is left out for that reason. Albania (energy price flagged as low reliability) and Moldova (tax breakdown incomplete) are left out too, and there are no 2025 figures for Ukraine or the United Kingdom.
Next billing period
The 2025 bill is already out of date in places. Eurostat's first-half 2026 figures show Denmark's household price down 31.7% on a year earlier, the largest fall in the EU. That follows the cut BDO describes: from January 2026 the Danish electricity tax dropped to 0.8 øre per kWh, the EU minimum, for two years. Romania's price rose 51.9%, the largest increase. Poland's price cap ended with 2025. Luxembourg moved part of the cost onto its budget.
In early 2026 Ireland had the highest household price in the EU, €0.3871 per kWh, ahead of Germany and Belgium, and Hungary, Malta and Bulgaria were still the cheapest. The tax line, Eurostat says, was 28.4% of the EU average price, down from 28.9% in the second half of 2025. The power, the wires and the tax change at different speeds, and each country sets its own mix. Of the five lines on the bill, the one that can change fastest is the one written by governments.
Sources and method
- Eurostat (2026), Electricity prices components for household consumers - annual data (nrg_pc_204_c), DOI 10.2908/NRG_PC_204_C. Consumption band DC (2,500 to 4,999 kWh a year), euro and PPS, 2017 to 2025; data updated October 19, 2026, accessed November 13, 2026 through the Eurostat dissemination API. Source: Eurostat. Licensed CC BY 4.0. Modified by ParityAI: components combined into three bill lines and countries filtered; Eurostat is not responsible for this reuse.
- Eurostat, Statistics Explained: Electricity price statistics (data extracted October 2026). First-half 2026 prices, tax shares and national notes on support measures.
- Eurostat copyright notice and free re-use of data
Prices are Eurostat's annual 2025 averages for household consumers in consumption band DC (2,500 to 4,999 kWh a year), the band Eurostat uses as its standard household, in euro per kWh at the average exchange rate of the period. Three bill lines are drawn: energy and supply (NRG_SUP), network costs (NETC), and taxes, fees, levies and charges including VAT (TAX_FEE_LEV_CHRG). The total is their sum. Eurostat publishes the tax line net of support measures delivered through the bill, so it can be negative; allowance items are also published separately, with signs that differ by country, and are not added again here. The EU average is Eurostat's EU27 aggregate. Countries shown are the EU 27, three EFTA members (Iceland, Liechtenstein, Norway) and six official EU candidate countries with complete 2025 data. Eurostat's reuse licence does not extend to countries outside the EU, EFTA and official candidates, so Kosovo, a potential candidate, is left out; Albania (2025 energy price flagged low reliability) and Moldova (tax breakdown incomplete) are left out too; there are no 2025 figures for Ukraine or the United Kingdom. PPS prices use the same components in Purchasing Power Standard. Luxembourg has no 2024 figure in this dataset, so it has no year-on-year change.
Charts like this, from your own numbers.
Connect a spreadsheet or the tools you run on, and Parity builds the dashboard and writes the report, with every number checked.
Try Parity free

