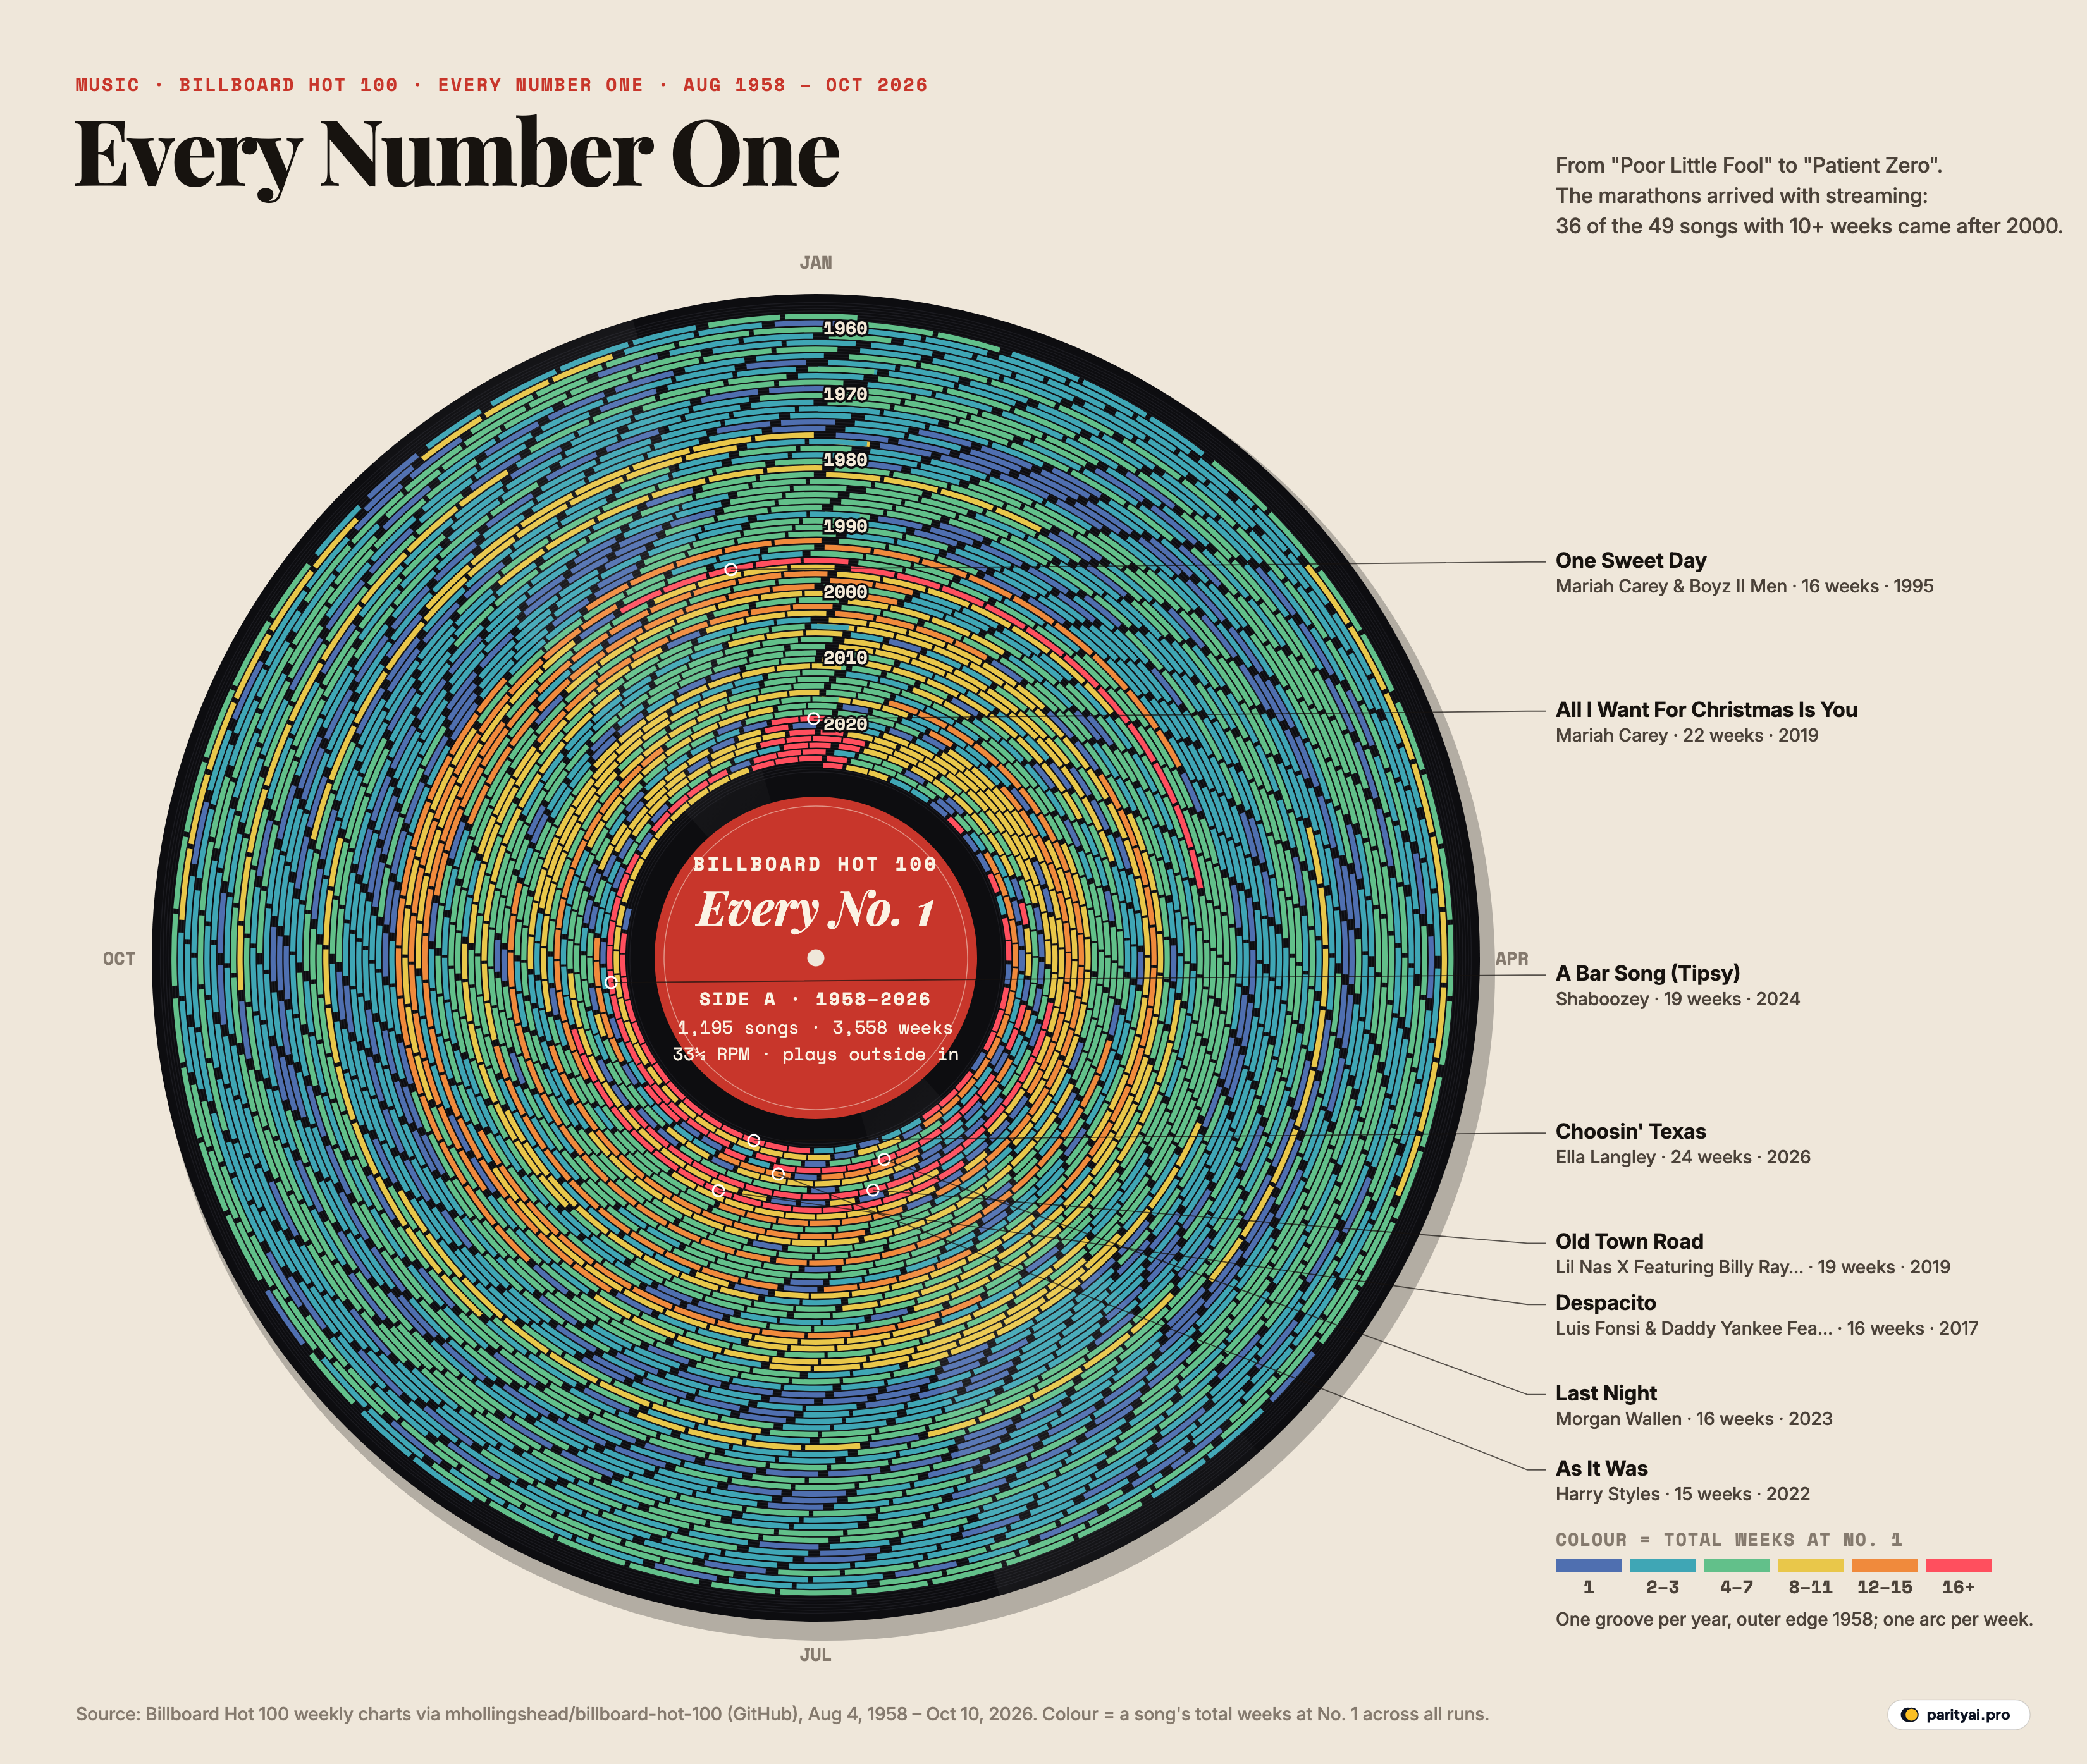
On August 4, 1958, Billboard magazine published the first Hot 100, a single weekly ranking of the most popular songs in America. At the top was Ricky Nelson's "Poor Little Fool". Sixty-eight years and 3,558 charts later, on October 10, 2026, the number one was Taylor Swift's "Patient Zero", which entered the chart at the top. In between, 1,195 different songs have spent at least one week at number one.
The record above holds all of them. Like a real vinyl LP, it plays from the outside in: the outermost groove is 1958, and each groove inward is a year, down to 2026 next to the label. Each week at number one is a short arc in that year's groove, starting at the top in January and running clockwise. The colour of an arc shows how long that song spent at number one in total: cool blue for a song that held the top spot for a week or two, through green and yellow, to red for the rare songs that stayed for 16 weeks or more.
Look at the record from a distance and its whole history is in the colour. The outer grooves are a busy patchwork of blues and greens, songs passing through the top spot for a week or two before being replaced. The inner grooves glow yellow, orange and red. Number ones last much longer than they used to.
What follows are liner notes for the record, one track at a time.
Track 1: The outer edge, 1958–1969
The first decade of the Hot 100 was a churn. In the 1960s, an average of 21.2 different songs reached number one each year, counting every song that held the top spot at any point in the calendar year. Records were cheap, radio played new singles constantly, and the chart was compiled from a combination of record-store sales reports and radio playlists that rewarded whatever was newest.
This was the era of the British Invasion and Motown. The Beatles went on to collect 20 number ones, still the most of any act, and The Supremes 12. Yet even the biggest songs rarely stayed on top for long. In the outer grooves, most arcs are blue: of all 1,195 number ones in the record, 435 spent just a single week at the top, and many of them are here.
Track 2: The busiest grooves, the 1970s
If anything, the turnover sped up. The 1970s averaged 25.9 different number ones a year, the highest of any decade, and 1974 had 36, the most of any year in the data. On the record, the grooves for the mid-1970s are the most finely chopped of all, a stripe of tiny blue arcs.
Part of the reason was the way the chart was built. Billboard relied on rankings reported by shops and radio stations rather than on actual sales counts, and a song that was hot one week could be replaced the next by whatever stations and stores were promoting.
Track 2½: The video decade
The 1980s grooves are still mostly blue and green. The decade averaged 24.1 different number ones a year, barely fewer than the 1970s, and the biggest stars collected number ones rather than long runs. Michael Jackson reached the top 13 times in his career and Madonna 12 times, most of them in the 1980s, yet neither has a song among the longest-reigning number ones. MTV, which launched in 1981, made music videos a new route to the top of the chart, but the chart itself still rewarded a steady stream of new singles over a few enduring ones. That would change abruptly at the start of the next decade.
Track 3: The needle jumps, 1991
In late 1991 Billboard changed how it measured the Hot 100, switching to actual point-of-sale data from Nielsen SoundScan along with monitored radio airplay. The effect is visible on the record. In the grooves after 1991, the arcs suddenly get longer and warmer.
With real sales data, it turned out that the most popular songs stayed popular for much longer than the old reports had suggested. The 1990s averaged 14.9 different number ones a year, down from 24.1 in the 1980s. This was the decade of the long-running ballad: I Will Always Love You by Whitney Houston held the top spot for 14 weeks, I'll Make Love To You by Boyz II Men for 14, and One Sweet Day, by Mariah Carey and Boyz II Men, for 16, a record at the time. Macarena (Bayside Boys Mix) stayed for 14 weeks in 1996.
Track 4: The streaming groove
The next change came gradually. Billboard began counting digital downloads in the 2000s and added streaming data in stages: on-demand streams from services such as Spotify in 2012, and YouTube views in February 2013. The first number one after YouTube was added was "Harlem Shake", a song driven almost entirely by viral videos.
Streaming rewards songs that people play over and over, not just buy once. On the record, that shows up as long, hot arcs in the inner grooves. Of the 49 songs that spent ten weeks or more at number one, 36 reached the top after 2000. Despacito ran for 16 weeks in 2017. Old Town Road by Lil Nas X and Billy Ray Cyrus broke the all-time record in 2019 with 19 weeks, the longest single unbroken run in the data. A Bar Song (Tipsy) by Shaboozey matched it in 2024.
| # | Song | Artist | First week at #1 | Weeks at #1 |
|---|---|---|---|---|
| 1 | Choosin' Texas | Ella Langley | February 14, 2026 | |
| 2 | All I Want For Christmas Is You | Mariah Carey | December 21, 2019 | |
| 3 | Old Town Road | Lil Nas X Featuring Billy Ray Cyrus | April 13, 2019 | |
| 4 | A Bar Song (Tipsy) | Shaboozey | July 13, 2024 | |
| 5 | One Sweet Day | Mariah Carey & Boyz II Men | December 2, 1995 | |
| 6 | Despacito | Luis Fonsi & Daddy Yankee Featuring Justin Bieber | May 27, 2017 | |
| 7 | Last Night | Morgan Wallen | March 18, 2023 | |
| 8 | As It Was | Harry Styles | April 16, 2022 | |
| 9 | I Will Always Love You | Whitney Houston | November 28, 1992 | |
| 10 | I'll Make Love To You | Boyz II Men | August 27, 1994 | |
| 11 | Macarena (Bayside Boys Mix) | Los Del Rio | August 3, 1996 | |
| 12 | Candle In The Wind 1997/Something About The Way You Look Tonight | Elton John | October 11, 1997 | |
| 13 | We Belong Together | Mariah Carey | June 4, 2005 | |
| 14 | I Gotta Feeling | The Black Eyed Peas | July 11, 2009 | |
| 15 | Uptown Funk! | Mark Ronson Featuring Bruno Mars | January 17, 2015 | |
| 16 | End Of The Road (From "Boomerang") | Boyz II Men | August 15, 1992 | |
| 17 | The Boy Is Mine | Brandy & Monica | June 6, 1998 | |
| 18 | Luther | Kendrick Lamar & SZA | March 1, 2025 | |
| 19 | Smooth | Santana Featuring Rob Thomas | October 23, 1999 | |
| 20 | Lose Yourself | Eminem | November 9, 2002 |
Total weeks at number one across all runs. Billboard Hot 100 weekly charts.
Track 5: The song that comes back every December
One of the reddest arcs on the record keeps reappearing in the same place: the last weeks of one year and the first of the next, either side of the top of each groove. All I Want For Christmas Is You, first released by Mariah Carey in 1994, spent its first quarter-century without reaching number one on the Hot 100: for years it wasn't even eligible, because it was never released as a commercial single, and its burst of holiday listening was too short to carry it to the top. Streaming changed that. It finally reached number one in December 2019 and has returned there every holiday season since. On this record it has spent 22 weeks at number one in total, more than any other song until 2026.
That makes Mariah Carey the act with by far the most total weeks at number one, 101, ahead of Rihanna with 60 and The Beatles with 59.
Track 6: Inside the label, 2026
The innermost groove, the 2026 groove, is the reddest on the record. Choosin' Texas by Ella Langley first reached number one in February 2026. By the autumn it had spent 24 weeks at the top, in several runs, passing Mariah Carey's holiday standard to set the all-time record for total weeks at number one.
The year also brought a milestone for Drake, whose 14th number one in May 2026 put him level with Rihanna on 14. And it ended its latest chart with a familiar name: Taylor Swift, whose "Patient Zero" debuted at number one on October 10, 2026, her 16th number one, the third-most of any act after The Beatles (20) and Mariah Carey (19).
| # | Artist | Number ones | Total weeks at #1 |
|---|---|---|---|
| 1 | The Beatles | 59 | |
| 2 | Mariah Carey | 101 | |
| 3 | Taylor Swift | 50 | |
| 4 | Rihanna | 60 | |
| 5 | Drake | 58 | |
| 6 | Michael Jackson | 37 | |
| 7 | Madonna | 32 | |
| 8 | The Supremes | 22 | |
| 9 | Whitney Houston | 31 | |
| 10 | Ariana Grande | 24 | |
| 11 | Usher | 47 | |
| 12 | Bruno Mars | 40 | |
| 13 | Katy Perry | 33 | |
| 14 | Bee Gees | 27 | |
| 15 | Stevie Wonder | 22 |
Featured credits count. A duet's weeks are credited to both artists.
The fewest and the most
The number of different songs that reach number one each year is a simple measure of how fast popular taste moves, and the record shows it changing in waves. The fewest in any full year was 2005, with 8. The 2000s averaged 13.8 a year and the 2010s 12.5. The 2020s have averaged 17.0 so far, a little higher, partly because superstar album releases now regularly send a new song straight to number one for a single week before the longer-running hits return.
There are two ways to count these, and they give slightly different answers. The figures here count every song that held the top spot at any point in a calendar year, including songs that carried over from the year before. Counting only songs that reached number one for the first time gives smaller numbers; by that measure, 2002 had the fewest new number ones, seven.
| Year | Different number ones |
|---|---|
| 2026 (to Oct 10) | |
| 2025 | |
| 2024 | |
| 2023 | |
| 2022 | |
| 2021 | |
| 2020 | |
| 2019 | |
| 2018 | |
| 2017 | |
| 2016 | |
| 2015 | |
| 2014 | |
| 2013 | |
| 2012 | |
| 2011 | |
| 2010 | |
| 2009 | |
| 2008 | |
| 2007 | |
| 2006 | |
| 2005 | |
| 2004 | |
| 2003 | |
| 2002 | |
| 2001 | |
| 2000 | |
| 1999 | |
| 1998 | |
| 1997 | |
| 1996 | |
| 1995 | |
| 1994 | |
| 1993 | |
| 1992 | |
| 1991 | |
| 1990 | |
| 1989 | |
| 1988 | |
| 1987 | |
| 1986 | |
| 1985 | |
| 1984 | |
| 1983 | |
| 1982 | |
| 1981 | |
| 1980 | |
| 1979 | |
| 1978 | |
| 1977 | |
| 1976 | |
| 1975 | |
| 1974 | |
| 1973 | |
| 1972 | |
| 1971 | |
| 1970 | |
| 1969 | |
| 1968 | |
| 1967 | |
| 1966 | |
| 1965 | |
| 1964 | |
| 1963 | |
| 1962 | |
| 1961 | |
| 1960 | |
| 1959 | |
| 1958 (from Aug 4) |
How to read the record
- Outside in. The outermost groove is 1958 (from August 4); the innermost is 2026 (to October 10).
- One arc per chart week. Each groove holds about 52 arcs, starting at the top for the first chart of January and running clockwise.
- Colour is a song's career at number one, not just one run. A song that returned to the top in later years has the same colour every time.
- Credits as printed. Songs are identified by title and the credited artist. In the artist table, every credited act, including featured artists, gets the weeks.
Run-out groove
At the end of a vinyl record, the needle drifts into the smooth run-out groove and clicks quietly around the label. This record doesn't have one yet: the Hot 100 will publish another chart next week, and the week after that. The inner grooves will keep filling, and if the last few years are any guide, they will keep running hot, with fewer songs holding the top spot for longer. Whether that reflects deeper loyalty to a handful of hits, or simply the mechanics of counting streams, is one of the arguments the record can't settle.
Sources and method
- Billboard Hot 100 weekly charts, 1958–2026, compiled by mhollingshead/billboard-hot-100 (GitHub). All 3,558 weekly charts from August 4, 1958 to October 10, 2026, retrieved October 12, 2026
- Billboard, Hot 100 chart
Each weekly Hot 100 chart in the dataset is dated by its chart week. The song at position 1 that week is drawn as one arc of the groove for its calendar year, starting at the top and running clockwise through the year. A song's colour reflects its total weeks at number one across all its runs, including returns in later years (as with holiday songs). Songs are identified by title and credited artist as printed on the chart; artist counts in the tables split credits on 'Featuring', '&', 'x' and ',' so that every credited act gets the week.
Charts like this, from your own numbers.
Connect a spreadsheet or the tools you run on, and Parity builds the dashboard and writes the report, with every number checked.
Try Parity free