Few places on Earth have a climate record as long, or as beautiful, as Kyoto's. For more than 1,200 years, people in Japan's old imperial capital have written down when the cherry trees bloomed: courtiers in their diaries, monks in temple chronicles, poets in verse, and in modern times local newspapers. Gathered together, those notes form one of the longest records of spring anywhere in the world.
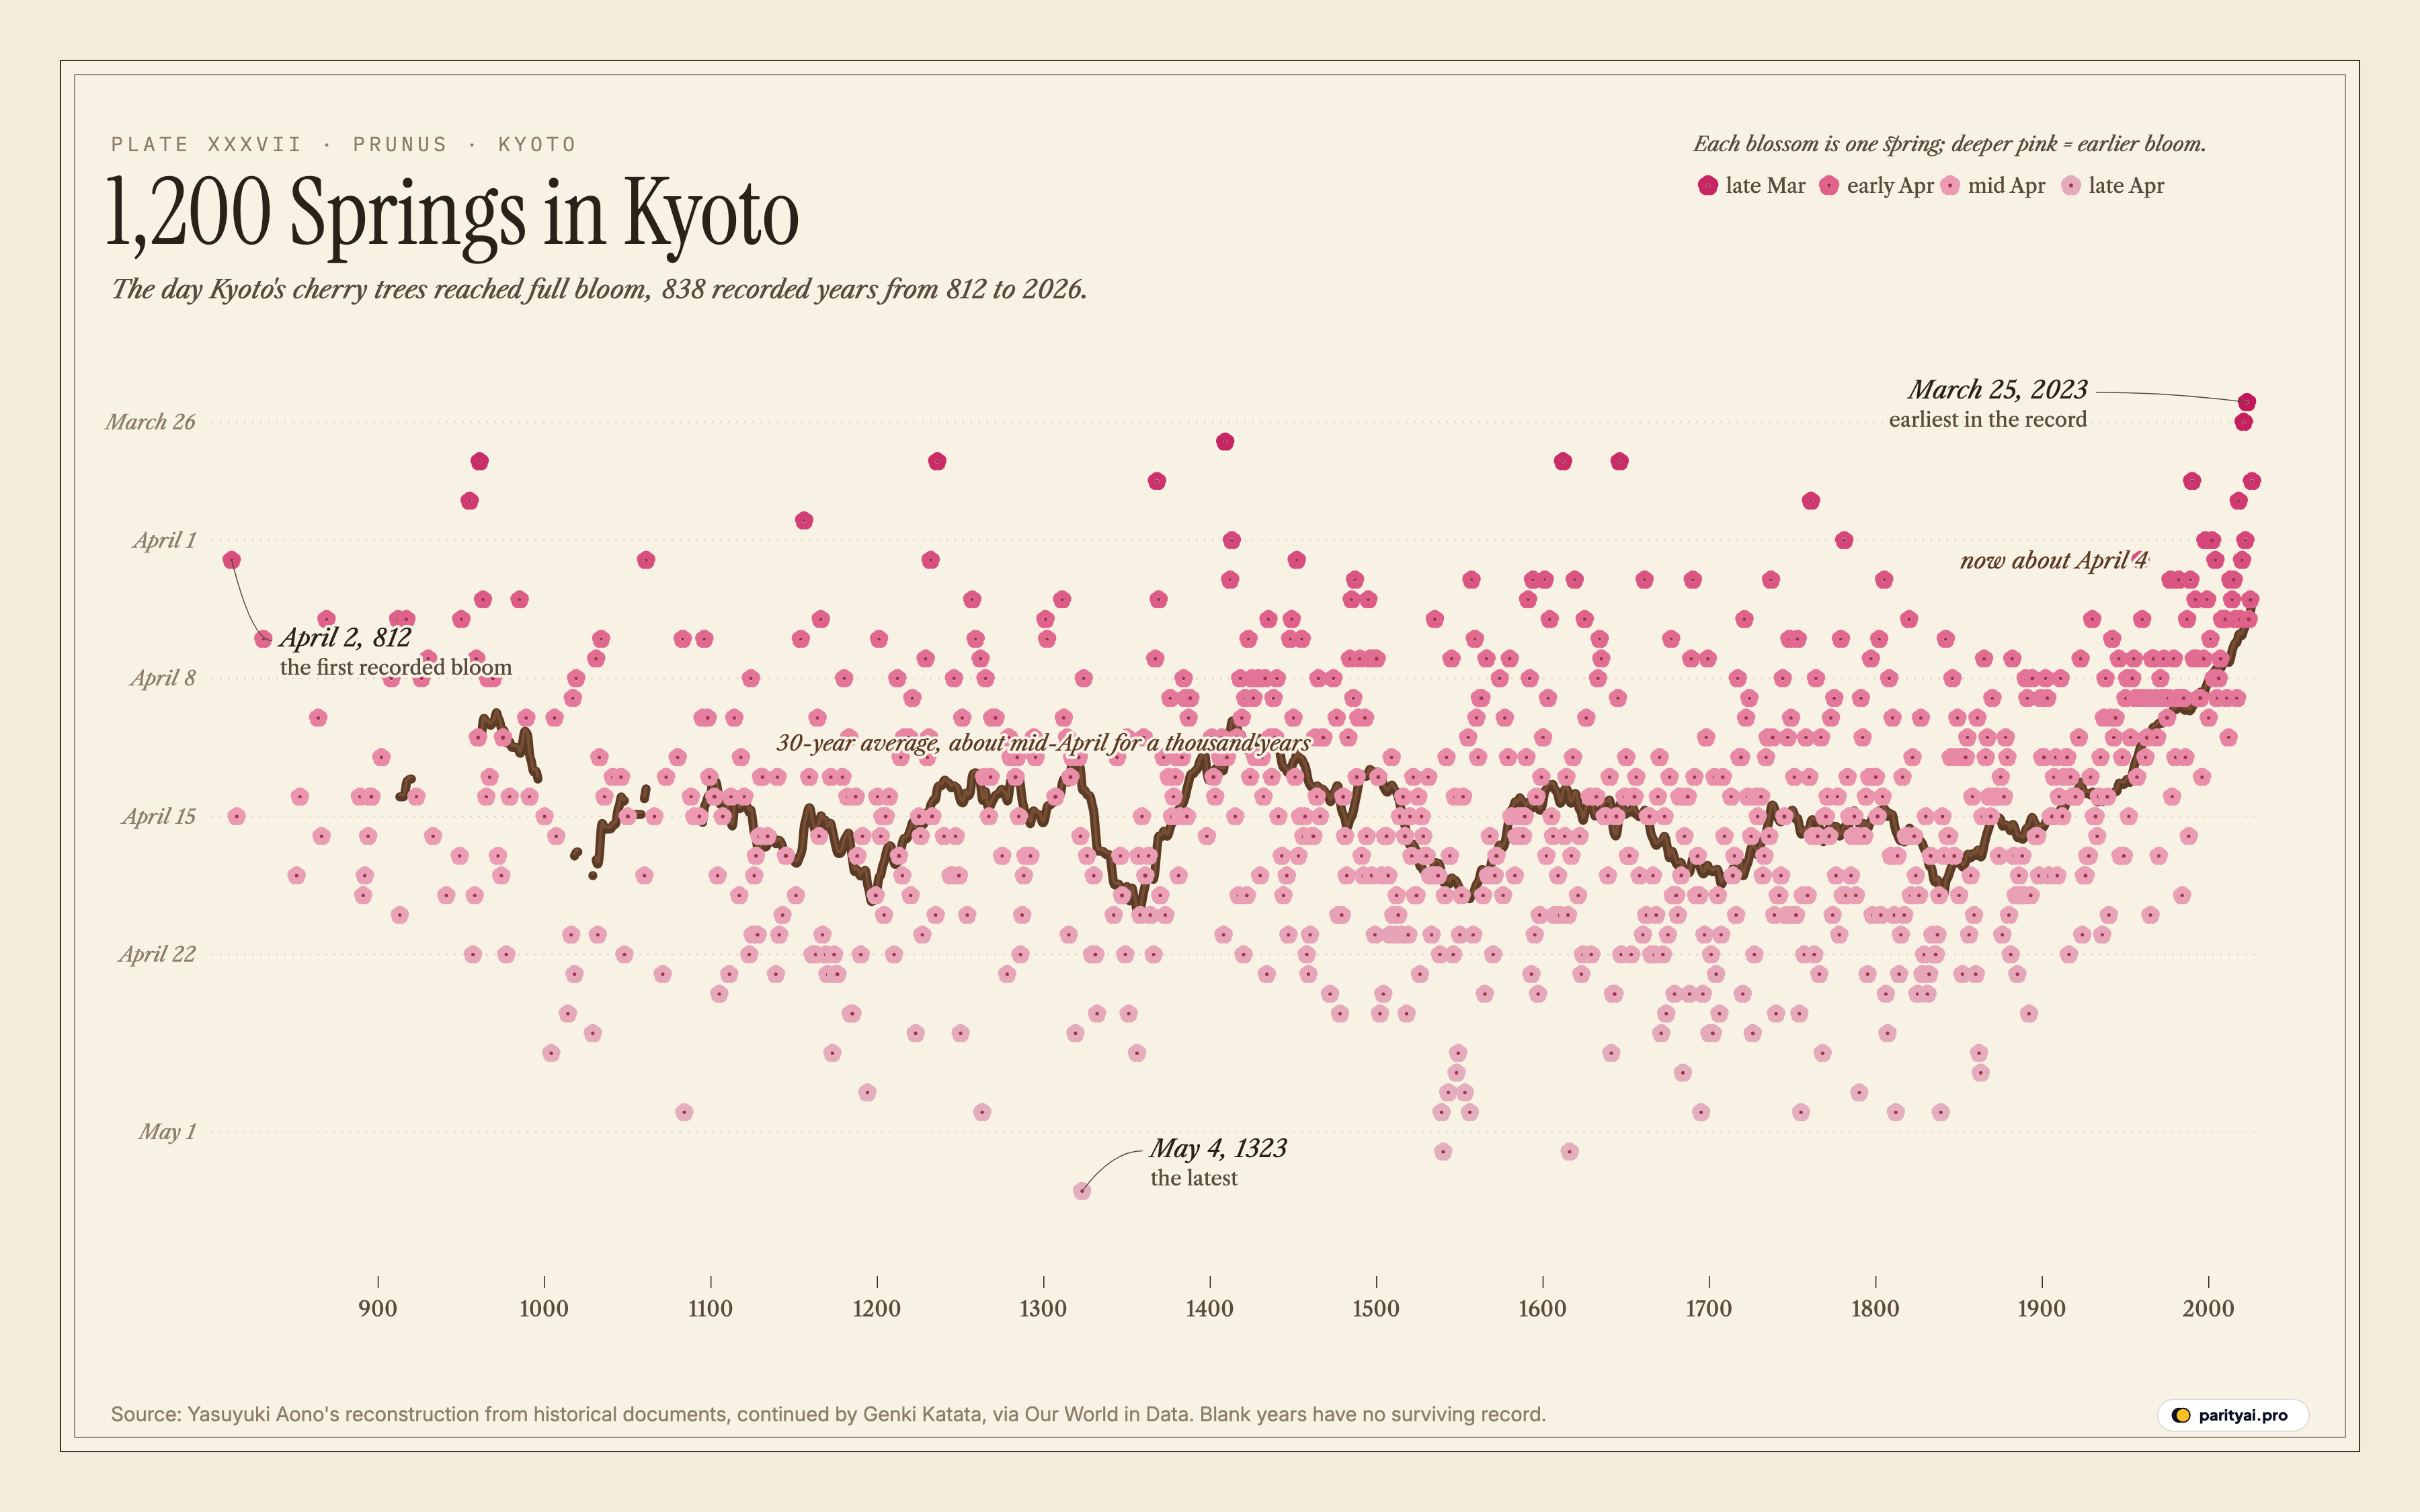
The plate above draws every year in it. Each pink blossom is one spring, placed by the date Kyoto's cherry trees reached full bloom: higher up for an earlier spring, lower for a later one, and a deeper pink the earlier the bloom. The brown branch running through them is the 30-year average. The record has 838 years with a known date, between 812 and 2026; the gaps, 377 years in all, are springs for which no document survives.
The record was assembled by the climatologist Yasuyuki Aono, who spent decades searching historical sources for mentions of the blossoms. After his death, the series, published by Our World in Data, has been continued by Genki Katata.
How a diary becomes a dataset
Turning scattered mentions into a date for each year is painstaking work. Aono and his colleagues read court diaries, the chronicles of temples and shrines, and collections of poems written at blossom-viewing parties, looking for any line that says the trees were in full flower on a given day. Their reconstructions, published in two papers covering the 9th to 14th and the 15th to 21st centuries, converted the old lunar-calendar dates into the modern calendar. For recent decades, the record draws on local newspapers' reports of the trees at Arashiyama, on the city's western edge.
The result is not a measurement in the way a thermometer reading is. Each early date depends on someone having written something down, and on that page surviving centuries of fires and wars. That is why the plate has gaps, and why the 30-year branch, which averages out the noise of single years, is the better guide to how spring has moved.
The best way to read the plate is by a handful of dates.
April 2, 812
The first blossom on the far left belongs to the year 812, when the trees reached full bloom on April 2. It is tied to a famous occasion: a flower-viewing banquet held that spring by the Emperor Saga at the Shinsen-en garden in Kyoto, often described as the origin of hanami, the Japanese custom of gathering to admire the blossoms, although the chronicle that records the feast doesn't say which flowers the court admired.
For the next two centuries the record is patchy, with only 45 recorded years before 1000. The blossoms that do survive cluster around mid-April. In the 900s, the average full-flowering date was about April 11.
May 4, 1323
The lowest blossom on the plate, the latest bloom in the entire record, came on May 4, 1323. It came just before the first of several cold spells that Aono identified in the record, between about 1330 and 1350. Across the 1300s, the trees bloomed on average around April 15.
Medieval Kyoto saw the blossom date wander from year to year by weeks, as the weather of a single spring always does. But across centuries the branch barely moves. By the 1200s the average was about April 14; in the 1500s, about April 17. For roughly a thousand years, Kyoto's cherry trees reached full bloom, on average, somewhere in the middle of April.
March 27, 1409
There were unusually early springs long before modern warming. The highest blossom before the 20th century belongs to 1409, when the trees bloomed on March 27. That date stood as the earliest in the whole record for more than six centuries.
It is worth dwelling on, because it shows what a single year can and can't tell you. One early spring in 1409 was an anomaly. What has happened since the 1800s is different: not one freak year, but the whole cloud of blossoms rising together.
Spring, 1850
The branch reaches its lowest stretch in the early 19th century. In the 30 years to 1850, the average full-flowering date was about April 18, among the latest in the record. Aono's work picks out four cold spells in the record, around 1330–50, 1520–50, 1670–1700 and 1825–30, which are often linked to the cooler centuries known as the Little Ice Age. The last of them shows up on the plate as a dip in the branch just before it turns.
Then the branch turns. From the second half of the 1800s, it begins to climb, slowly at first and then steeply. By the 30 years to 2026, the average full-flowering date had moved to about April 4, roughly 13 days earlier than in the decades before 1850. That is the earliest the 30-year average has ever been.
| # | Year | Full bloom | Days before the 1821–1850 average |
|---|---|---|---|
| 1 | 2023 | March 25 | |
| 2 | 2021 | March 26 | |
| 3 | 1409 | March 27 | |
| 4 | 1646 | March 28 | |
| 5 | 1612 | March 28 | |
| 6 | 1236 | March 28 | |
| 7 | 961 | March 28 | |
| 8 | 2026 | March 29 | |
| 9 | 1990 | March 29 | |
| 10 | 1368 | March 29 |
Full-flowering dates in Kyoto. The 1821–1850 average, the last decades before industrial-era warming, was about April 18.
March 26, 2021
In 2021, Kyoto's cherry trees reached full bloom on March 26, beating the 1409 record that had stood for 612 years. The date drew headlines around the world, and it prompted scientists to ask how much of the shift could be blamed on human activity.
A study by Nikolaos Christidis of the UK Met Office, working with Aono and Peter Stott, concluded that human influence had moved Kyoto's flowering about 11 days earlier, and that roughly half of that shift came from urban warming: Kyoto has grown into a large city, and cities are warmer than the countryside around them. The rest is attributed to climate change. The researchers found that a spring as early as 2021's had become about 15 times more likely.
March 25, 2023
The record did not last long. In 2023, the trees reached full bloom on March 25, the earliest date in the whole series. Of the ten earliest springs on the plate, 4 have come since 1990, visible as a cluster of deep pink blossoms at the top right.
The plate also shows how the spread of dates has shifted. In the old record, a late April bloom was ordinary. In the last few decades, almost every blossom sits above the old average line, and the very latest recent springs would have counted as early ones a few centuries ago.
March 29, 2026
The newest blossom, at the far right, is this year's. In 2026, the trees in Kyoto's Arashiyama district reached full bloom on March 29, according to the continued record. The Japan Meteorological Agency, which has observed a single sample tree in Kyoto since 1953 and declares full bloom when 80% of its buds are open, recorded March 30, five days earlier than its own normal date. The two observations measure different trees and differ by a day or two in most years.
| Century | Years with a record | Average full bloom | Earliest |
|---|---|---|---|
| 2000s | 27 | April 4 | March 25, 2023 |
| 1900s | 97 | April 11 | March 29, 1990 |
| 1800s | 98 | April 16 | April 3, 1805 |
| 1700s | 96 | April 16 | March 30, 1761 |
| 1600s | 90 | April 16 | March 28, 1612 |
| 1500s | 94 | April 17 | April 3, 1557 |
| 1400s | 87 | April 13 | March 27, 1409 |
| 1300s | 56 | April 15 | March 29, 1368 |
| 1200s | 60 | April 14 | March 28, 1236 |
| 1100s | 54 | April 17 | March 31, 1156 |
| 1000s | 34 | April 15 | April 2, 1061 |
| 900s | 31 | April 11 | March 28, 961 |
| 800s | 14 | April 13 | April 2, 812 |
The same story, elsewhere
Kyoto is not the only place where the blossoms are keeping an unusual diary. In Washington, DC, where the National Park Service has tracked the peak bloom of the Yoshino cherry trees around the Tidal Basin for about a century, the Environmental Protection Agency reports that peak bloom has shifted earlier by about eight days since 1921. The earliest peak on record there was March 15, 1990, and in 2026 the trees peaked on March 26.
What makes Kyoto special is the length of its baseline. Most climate records start in the 19th or 20th century, when thermometers became common. Kyoto's gives a millennium of springs before industrialisation, so the recent shift can be compared not just with the last hundred years but with everything that came before.
The timing matters beyond the postcards. Cherry blossom season drives one of Japan's busiest tourist periods, and festivals planned around the old calendar now regularly find the petals already falling. For plants and the insects that pollinate them, an earlier spring can also mean a mismatch: flowers that open before their pollinators are active, or buds exposed to a late frost after a warm spell tricks them into opening.
How to read the plate
- Full bloom, not first bloom. The dates mark when the trees were in full flower, the moment most often noted by diarists and recorded by observers.
- Gaps are real gaps. A blank year means no surviving document mentions the blossoms, not that they failed to bloom.
- Day of the year. Dates are calculated as days since January 1 and shown as calendar dates assuming a non-leap year, so a few may be a day off in leap years.
- The branch is an average. It is the mean of the available dates in each 30-year window, drawn only where at least ten years in that window have a record.
- City and climate together. The modern shift reflects both global warming and the growth of Kyoto itself.
The record goes on
Every spring, someone in Kyoto will note the day the cherry trees reach full bloom, and the plate will gain another blossom on its right-hand edge. For a thousand years those blossoms fell in a broad band around mid-April. Today they open, on average, at the beginning of the month. The trees haven't changed. The springs have.
Sources and method
- Our World in Data, Date of the peak cherry tree blossom in Kyoto, based on Yasuyuki Aono's reconstruction. 812–2026, retrieved October 12, 2026
Each point is the day of the year on which the cherry trees of Kyoto were recorded in full bloom, from historical documents (court diaries, chronicles and poetry) and, for modern years, local records, compiled by the late Yasuyuki Aono and continued from 2026 by Genki Katata. Recent dates refer to the trees at Arashiyama and can differ by a day or so from the Japan Meteorological Agency's single sample tree. Years with no surviving record are blank. Dates are shown as calendar days assuming a non-leap year. The branch is the 30-year trailing average of available years, drawn only where at least ten years in the window have data.
Charts like this, from your own numbers.
Connect a spreadsheet or the tools you run on, and Parity builds the dashboard and writes the report, with every number checked.
Try Parity free