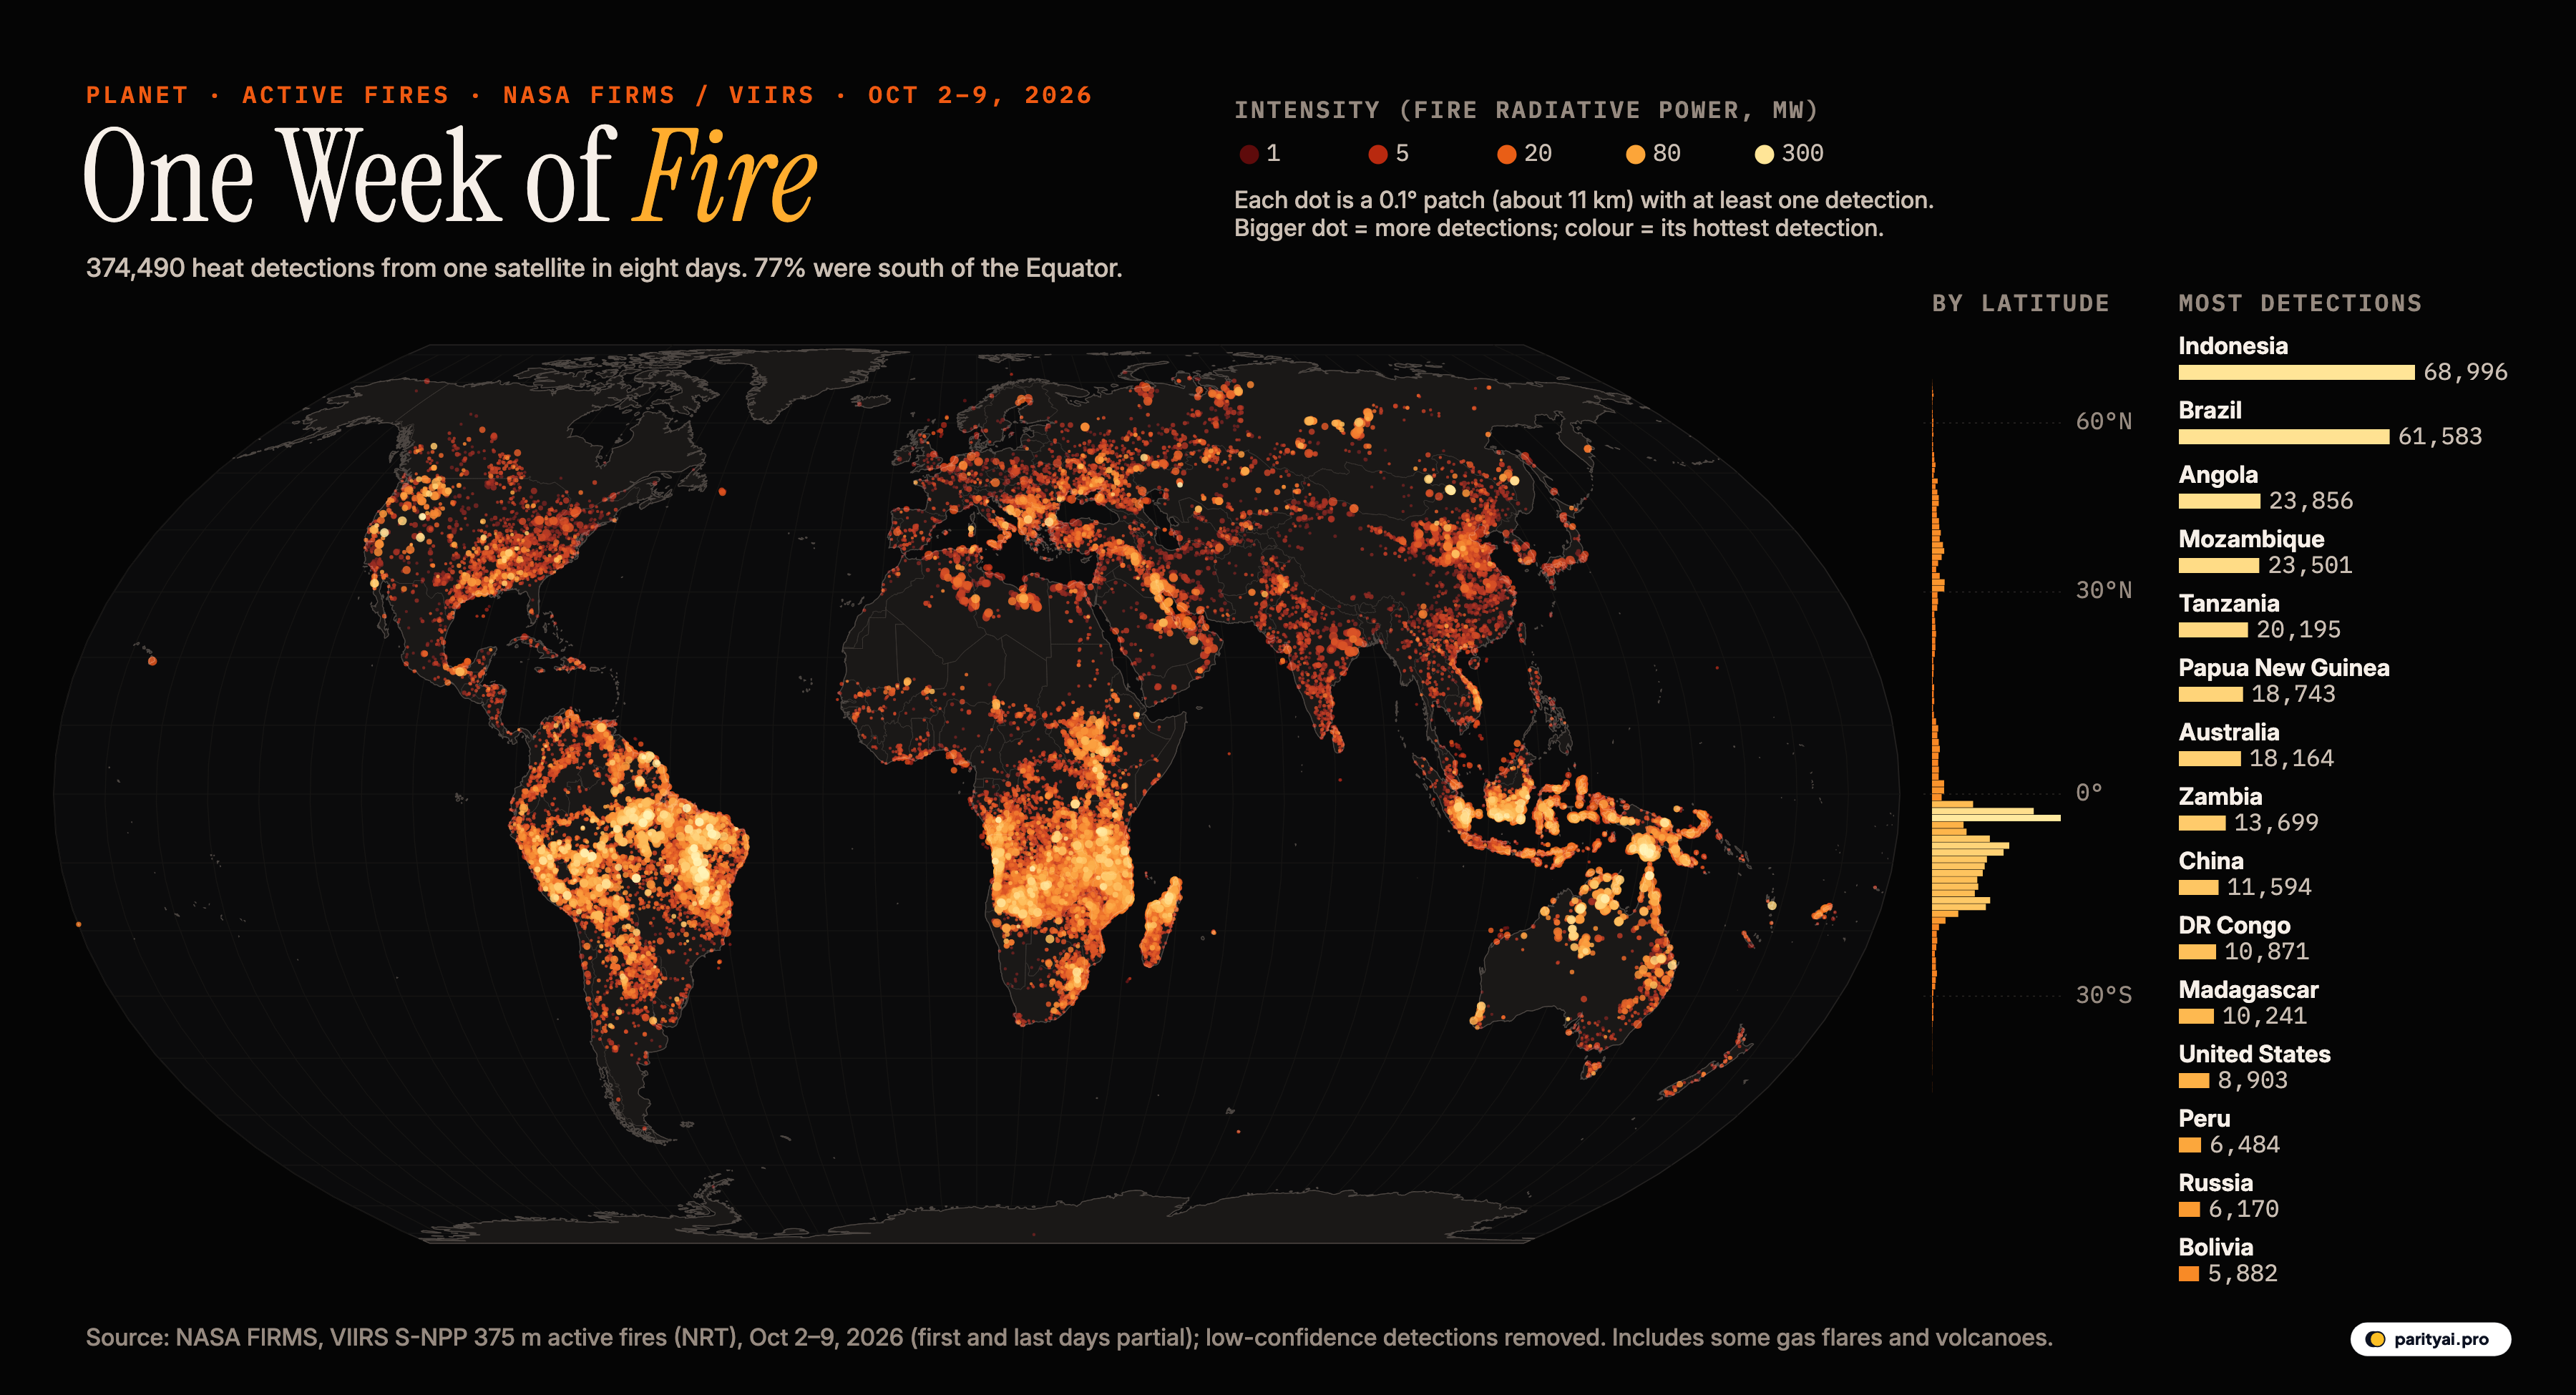
Twice a day, a satellite called Suomi NPP passes over every part of the planet and looks for heat. Its VIIRS instrument divides the ground into squares about 375 metres across, and when one of those squares is much hotter than its surroundings, NASA's Fire Information for Resource Management System, FIRMS, records it as an active fire. Within about three hours, anyone can download the result.
The map above is one week of those downloads: every nominal- and high-confidence detection between October 2 and October 9, 2026. There are 374,490 of them. Each dot is a patch of ground about 11 kilometres square that held at least one detection; bigger dots held more, and the colour runs from dull red to white-hot according to the intensity of the hottest fire in the patch, measured as fire radiative power.
The bars on the right of the map count detections by latitude. Read them from top to bottom and you get the shape of the week: a thin scatter across the north, then a great bulge just south of the Equator. 77% of all detections were in the Southern Hemisphere, and 83% were in the tropics.
So let's travel down the map the same way, from north to south.
The far north: a quiet week
At the top of the profile, above 50° north, the bars are almost flat. In early October the boreal forests of Canada and Russia are past their fire season. Canada recorded only 723 detections all week, a tiny number for a country where about 8.8 million hectares burned in 2025, its second-worst season on record, and about 15 million in 2023, more than seven times its historic average.
Russia had 6,170 detections, many of them across its farm belt in the south and west.
30° to 50° north: fields and flares
Lower down, the dots thicken over farmland. Much of the scatter across the US Midwest, Ukraine (1,190 detections), southern Russia, Kazakhstan (896) and eastern China (11,594) sits on cropland, where farmers in many places burn stubble after the harvest.
Not every dot in this band is a fire in the ordinary sense. FIRMS cannot tell a wildfire from other hot spots, and it also picks up volcanoes and the flares that burn off gas at oil wells. That is the most likely explanation for clusters in oil-producing regions with little vegetation to burn, such as Iraq, which had 2,652 detections.
The United States recorded 8,903 detections, many of them across the agricultural Midwest and South and in the West. The single most intense detection anywhere in the world this week, at 675 megawatts, was also in the United States, on 2026-10-02. For comparison, the median detection on the map was just 4.9 megawatts.
The northern tropics: between seasons
From about 20° north down to the Equator, the map is surprisingly dark for so much land. West Africa's Sahel and savanna, which burn heavily later in the year, are still green at the end of the rainy season. Nigeria, which will light up in December and January, had only 561 detections. Mainland Southeast Asia is quiet too: Myanmar and Thailand recorded fewer than 100 each, far fewer than they produce in their own dry season, from about February to April.
This is the key to reading any single week of fire data: the world's fires follow the seasons, and the seasons are opposite on either side of the Equator. What is quiet now will be ablaze in six months, and vice versa.
Just south of the Equator: Indonesia burns
The tallest bar in the latitude profile, and the brightest cluster in Asia, belongs to the islands just south of the Equator. Indonesia had more detections than any other country this week, 68,996, or 18% of the world total. Its neighbour Papua New Guinea, on the island of New Guinea, had 18,743.
Indonesia is having a severe fire year. Forecasters had warned that El Niño, which tends to bring drier weather to the region, would raise the risk, and by early October, hotspots remained high and haze from the fires was persisting in neighbouring Malaysia. The heaviest activity, according to IQAir, has been in Kalimantan and Sumatra, with another front in South Papua.
Many of these fires burn in drained peatland, which can smoulder underground for weeks and release enormous amounts of smoke and carbon. They are often started to clear land for plantations and farms, then spread out of control in dry conditions.
| # | Country | Detections, Oct 2–9 | Share of world |
|---|---|---|---|
| 1 | Indonesia | 18% | |
| 2 | Brazil | 16% | |
| 3 | Angola | 6% | |
| 4 | Mozambique | 6% | |
| 5 | Tanzania | 5% | |
| 6 | Papua New Guinea | 5% | |
| 7 | Australia | 5% | |
| 8 | Zambia | 4% | |
| 9 | China | 3% | |
| 10 | DR Congo | 3% | |
| 11 | Madagascar | 3% | |
| 12 | United States | 2% | |
| 13 | Peru | 2% | |
| 14 | Russia | 2% | |
| 15 | Bolivia | 2% | |
| 16 | South Sudan | 1% | |
| 17 | India | 1% | |
| 18 | Iran | 1% | |
| 19 | South Africa | 1% | |
| 20 | Iraq | 1% |
Nominal- and high-confidence VIIRS S-NPP detections. A detection is a hot 375 m pixel, not a separate fire.
10° to 20° south: the burning belt
Below Indonesia, the profile stays high across a band that wraps around the planet. This is the southern tropics at the end of their dry season, and it holds most of the light on the map.
Brazil had 61,583 detections, second only to Indonesia. Fire activity in the Amazon typically peaks in early September and mostly stops by November, and much of what remains in October is in the Cerrado savanna and on the agricultural frontier south and east of the rainforest. Bolivia added 5,882, Venezuela 2,180 and Paraguay 1,038.
Across the Atlantic, southern Africa is lit almost solidly from coast to coast. Angola (23,856), Mozambique (23,501), Tanzania (20,195), Zambia (13,699), DR Congo (10,871) and Madagascar (10,241) are all in the top dozen. September and October are the end of the dry season here, when grasses are at their driest, and most of the fires are probably set by people who use fire to clear fields, renew pasture and keep bush from taking over grassland. Together, the countries of central and southern Africa account for about 32% of the week's detections.
Australia had 18,164 detections, nearly all of them across the tropical north, where the savanna burns late in the May-to-October dry season.
South of 30°: the fires fade
Below the tropic of Capricorn the profile drops away again. South Africa (2,884) and Argentina (1,393) show scattered clusters, and southern Australia, New Zealand and Patagonia are nearly dark. Their fire seasons come in the southern summer, from December to March.
Fires as a record of what people do
It is tempting to read a map like this as a map of disasters. Mostly it isn't. Most of the detections on it are deliberate, small and short-lived: farmers burning crop residue, herders refreshing pasture, land being cleared. A single hot pixel can be a burning field the size of a football pitch.
But the same tools also record the fires that become disasters, and in recent years those have been growing. The World Resources Institute found that in 2024 fires caused nearly half of all tropical primary forest loss, the first time they overtook agriculture as the leading cause, and that tropical primary forest loss reached 6.7 million hectares, nearly twice the 2023 figure. Brazil and Bolivia were hit hardest. Losses fell back by more than a third in 2025, but the record shows how quickly a drought can turn routine burning into forest destruction.
| Date (UTC) | Detections |
|---|---|
| 2026-10-02 (partial) | |
| 2026-10-03 | |
| 2026-10-04 | |
| 2026-10-05 | |
| 2026-10-06 | |
| 2026-10-07 | |
| 2026-10-08 | |
| 2026-10-09 (partial) |
Day and night
The satellite crosses each place once in the early afternoon and once after midnight, local time. 33% of this week's detections came from the night passes. That gap is itself a clue to what is burning. Agricultural and land-clearing fires are usually lit in the heat of the day and burn out by evening, so they show up mostly in the afternoon pass. Large wildfires, smouldering peat and gas flares keep burning through the night.
The daily totals also rose through the week, peaking at 60,275 detections on 2026-10-08. The rise came from almost everywhere at once, from Indonesia and southern Africa to South America, though day-to-day changes also reflect how much cloud covered each region on a given pass.
What a dot is, and isn't
- A hot pixel, not a fire. Each detection is the centre of a 375-metre square flagged as containing one or more fires. One large fire can produce hundreds of detections; several small fires can share one.
- Not burned area. Counts show where and how often the satellite saw heat, not how much land burned.
- One satellite, two passes a day. Fires that start and end between overpasses, or burn under thick cloud or smoke, can be missed. Suomi NPP is one of three VIIRS satellites, and NASA plans to stop delivering its observations after November 2, 2026, in favour of its newer siblings NOAA-20 and NOAA-21.
- Partial days. The file covers parts of October 2 and October 9; on the six full days in between, there were about 48,617 detections a day.
- Not only fires. Gas flares, volcanoes and some industrial sites also show up.
Next week's map will look different
A week from now, Indonesia's fires may be put out by the first monsoon rains, or they may get worse. The southern African belt will start to fade as the rains arrive in November. Within a few months the brightest part of the map will be north of the Equator, across the Sahel and mainland Southeast Asia.
The planet burns all year round. What changes is where.
Sources and method
- NASA FIRMS, VIIRS (S-NPP) 375 m active fire product, Collection 2 near real-time, global 7-day file. Detections acquired October 2–9, 2026, downloaded October 9, 2026
- NASA FIRMS frequently asked questions
- Natural Earth country shapes via world-atlas
Each detection is the centre of a 375-metre pixel that the VIIRS instrument on the Suomi NPP satellite flagged as containing at least one active fire or other hot spot during an overpass. Low-confidence detections are excluded. One fire can produce several detections, and one detection can hold several fires, so counts are not the number of fires or the area burned. Detections include some non-fire heat sources such as gas flares and volcanoes, which FIRMS does not label. Colour shows fire radiative power (megawatts), a measure of how intensely a fire is burning. Detections are assigned to countries by their location within Natural Earth country borders. The first and last days in the file are partial.
Charts like this, from your own numbers.
Connect a spreadsheet or the tools you run on, and Parity builds the dashboard and writes the report, with every number checked.
Try Parity free

