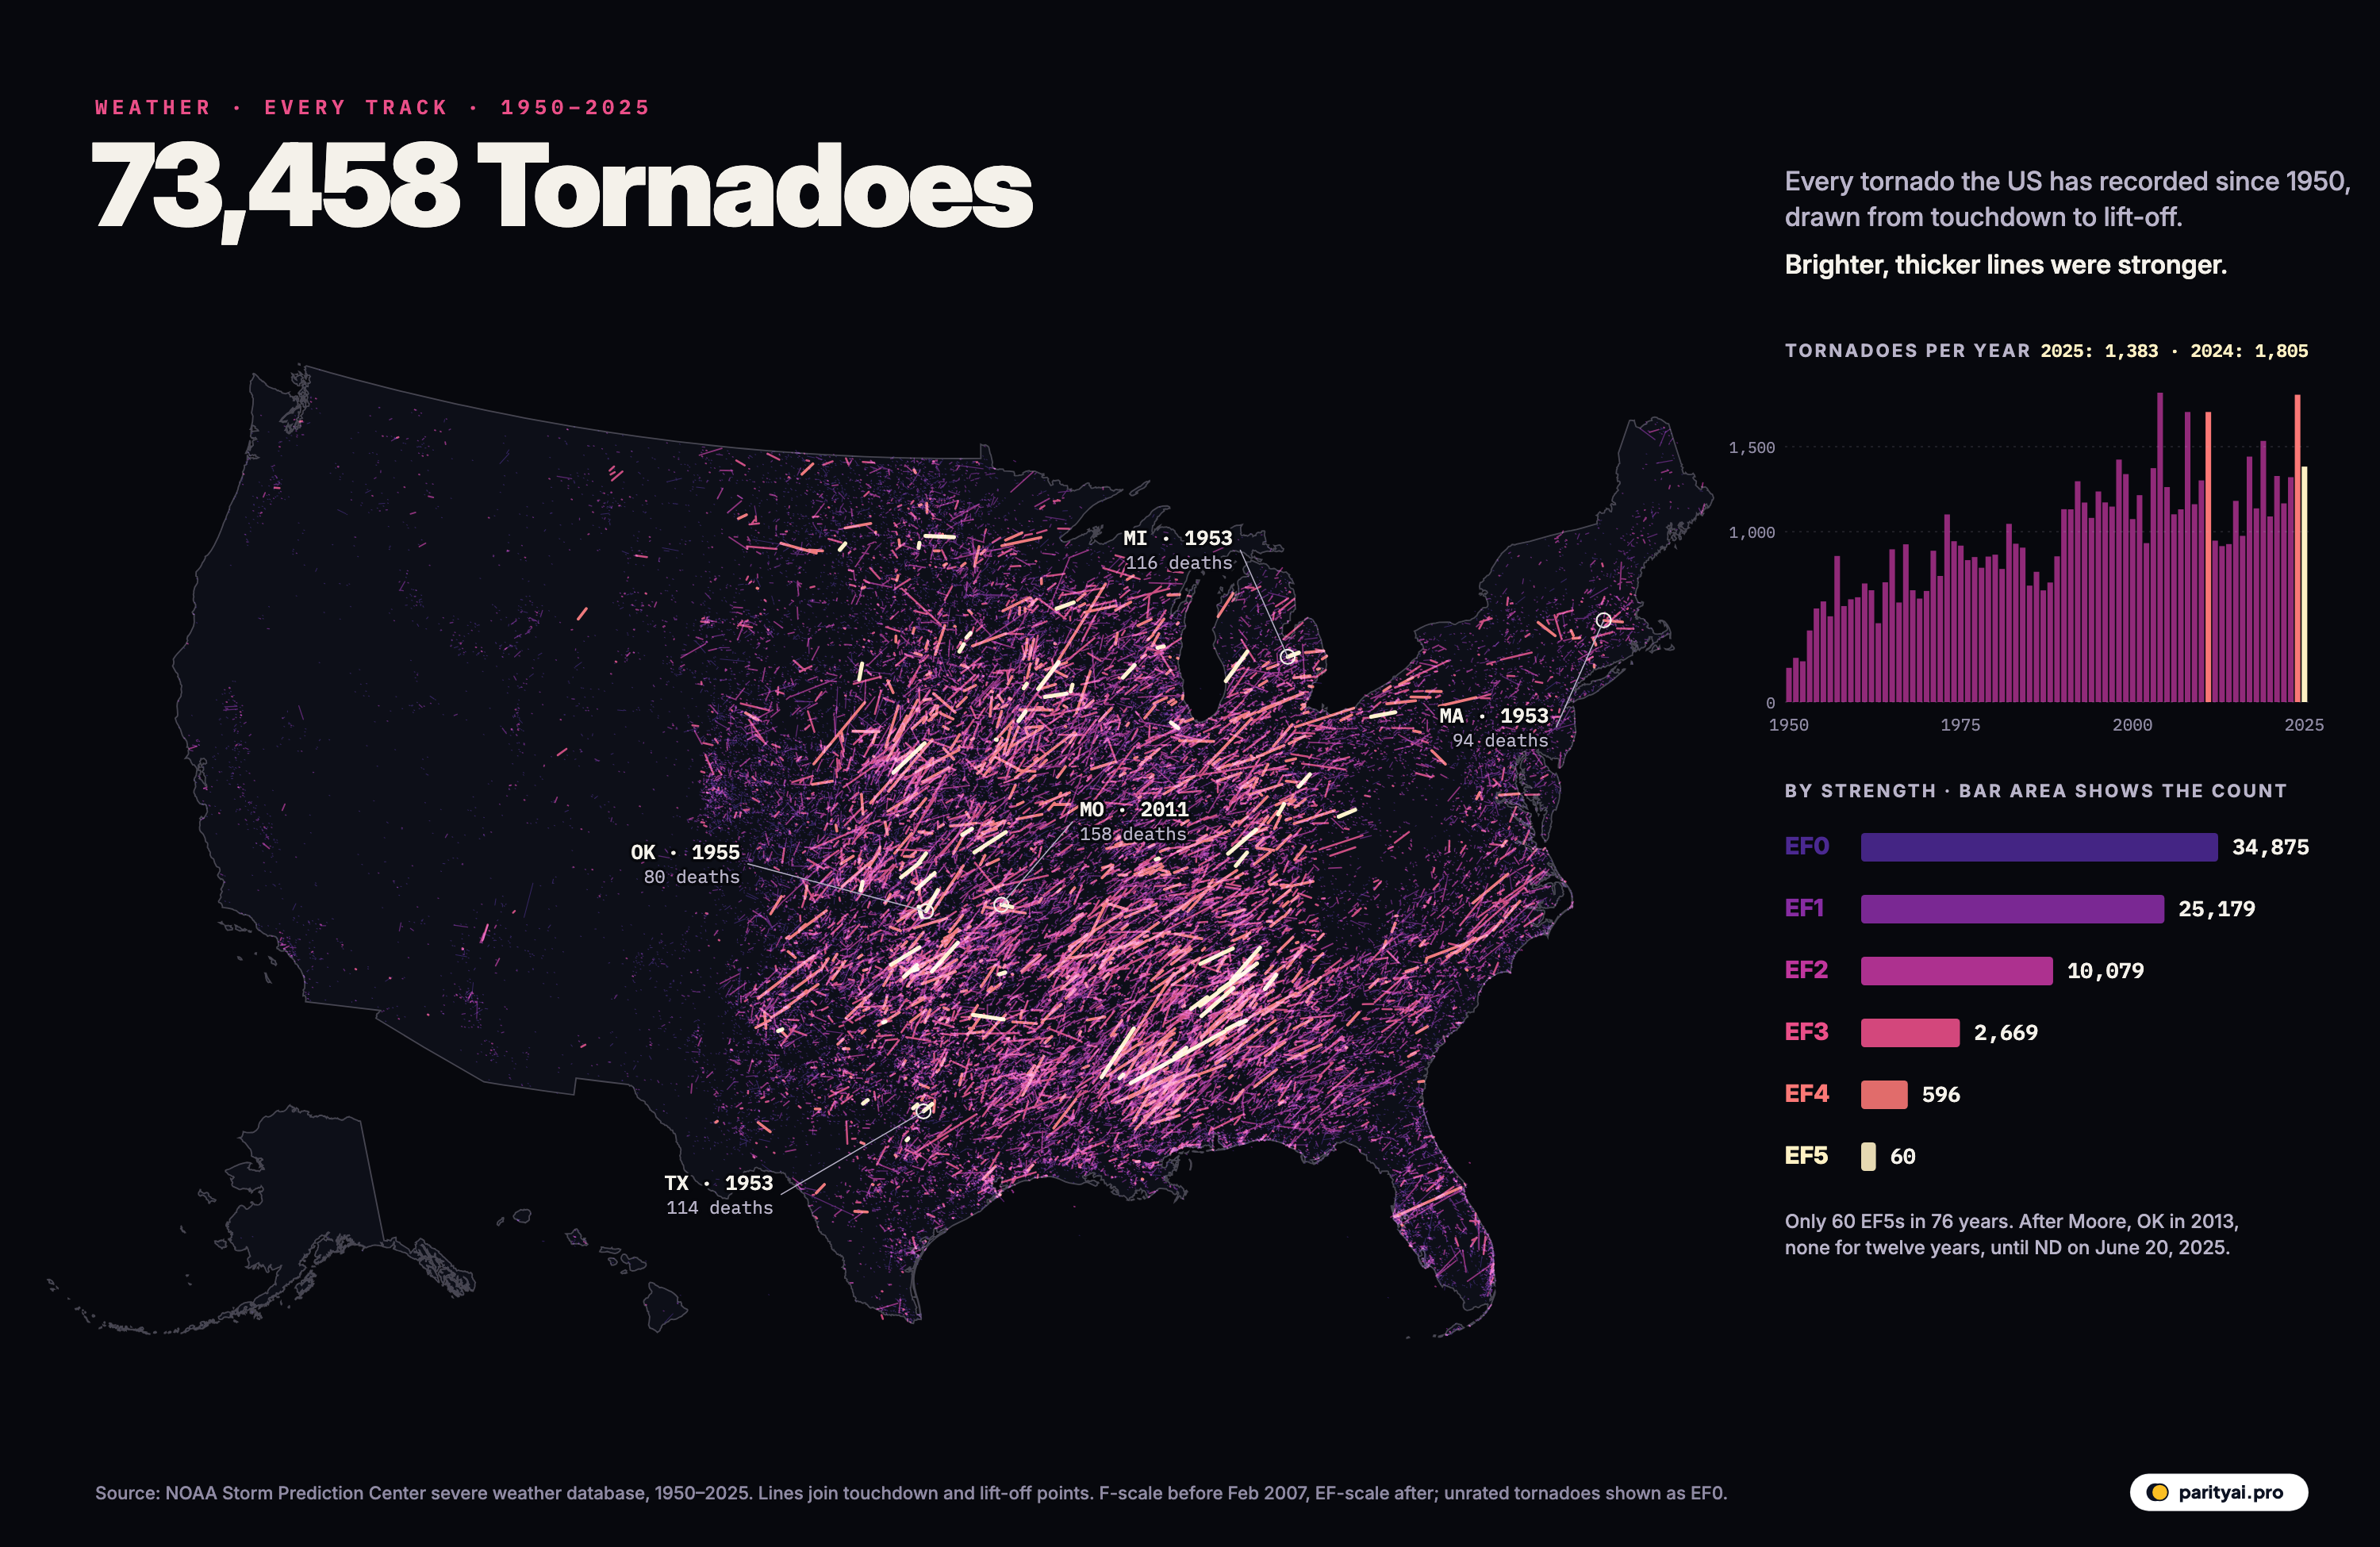
Every line on the map above is a tornado. There are 73,458 of them, every one the US National Weather Service has recorded from 1950 through 2025, drawn from the point where it touched down to the point where it lifted. Weak tornadoes are faint violet threads. The strongest are thick, bright and almost white.
Seen all at once, the record looks less like a set of disasters and more like weather on a continental scale. Most of the eastern two-thirds of the country is crosshatched. The densest knots sit across the southern Plains and the Deep South. West of the Rockies the map goes almost blank.
The data come from the Storm Prediction Center's severe weather database, the official record kept by NOAA. It is one of the longest and most detailed hazard records in the world, and it gets several popular beliefs about tornadoes wrong. Here are seven of them, tested against the data.
Myth 1: "Tornadoes are getting more common"
The column chart in the corner seems to say so. In 1950 the database records 201 tornadoes. In 2024 it records 1,805, the second-highest count in its history, behind only 2004 with 1,817. The 1950s averaged 479 tornadoes a year; the 1990s averaged 1,214.
But most of that rise is in what we can see, not in what happens. In the 1950s, a weak tornado that crossed empty farmland often went unreported. Since the 1990s, a national network of Doppler radars has been able to spot rotation inside storms, more people live in once-rural areas, and storm spotters and smartphones catch tornadoes that would once have been missed. The decade table below shows where the growth came from: the count of strong tornadoes, rated EF3 or higher, has stayed fairly steady, while weak ones have multiplied.
Once detection caught up, the totals levelled off. The 2010s averaged 1,207 a year, about the same as the 1990s. Year-to-year swings are large, from quiet seasons to record ones like 1,704 tornadoes in 2011, but there is no steady climb.
| Decade | Average per year | EF3+ per year | Deaths per year | Year by year |
|---|---|---|---|---|
| 1950s | 50 | 142 | ||
| 1960s | 57 | 94 | ||
| 1970s | 62 | 100 | ||
| 1980s | 37 | 52 | ||
| 1990s | 43 | 58 | ||
| 2000s | 32 | 56 | ||
| 2010s | 33 | 91 | ||
| 2020s (to 2025) | 32 | 68 |
Weak tornadoes were heavily under-reported in early decades, so the rise in total counts mostly reflects better detection. Counts of strong (EF3+) tornadoes are steadier.
Myth 2: "Most tornadoes are monsters"
Pictures of tornadoes tend to show the giant ones. The record is dominated by small ones. Of the 73,458 tornadoes on the map, 34,875 were rated EF0, the weakest category, with winds that can peel shingles and snap branches. Another 25,179 were EF1. Together they make up more than four in five tornadoes.
The violent end of the scale is rare. There were 2,669 EF3s, 596 EF4s and just 60 EF5s, the category for winds above 200 mph that can sweep a well-built house off its foundation. Tornadoes rated EF3 or higher make up only 4.5% of the total, but they cause most of the deaths. That is why the bright lines on the map, though few, matter most.
The scale itself changed during the record. Tornadoes before February 2007 were rated on the original Fujita scale, and those since on the Enhanced Fujita scale, which ties ratings more closely to the damage done to specific types of buildings and trees. The two are designed to line up, so this map treats them as one series.
Myth 3: "EF5s happen every few years"
For most of the record, they did. EF5s, or F5s before 2007, struck in 31 different years. Then they stopped. After the tornado that hit Moore, Oklahoma, on May 20, 2013, the United States went twelve years without an EF5 rating.
That streak ended in North Dakota. On the night of June 20, 2025, a tornado near Enderlin carved a path about 12 miles long and more than a mile wide. It was first rated EF3. In October 2025 the National Weather Service in Grand Forks upgraded it to EF5, with estimated peak winds of more than 210 mph, after studying the train cars it had thrown. One empty tanker car was tossed about 475 feet. Three people were killed. It was, as Fox 9 reported, the first EF5 in the United States in 12 years.
The long gap was partly a matter of rating rules. To earn an EF5, a tornado has to hit something sturdy enough to show what EF5 winds can do. Many violent tornadoes cross open country and get lower ratings because nothing they struck could prove otherwise.
Myth 4: "Tornado Alley is in Kansas and Oklahoma"
It is, partly. Texas has recorded more tornadoes than any other state, 9,610, followed by Kansas with 4,582. But look at where the bright, long tracks cluster on the map, and much of the violence sits farther east: in Mississippi, Alabama, Tennessee and Arkansas.
Meteorologists sometimes call that region Dixie Alley. Its tornadoes are often wrapped in rain, move fast, strike at night and cross wooded, hilly country where they are hard to see. A study by Vittorio Gensini and Harold Brooks in npj Climate and Atmospheric Science found significant trends in tornado frequency since 1979: decreases in parts of the central and southern Great Plains, and increases in parts of the Midwest and Southeast. In other words, the centre of activity appears to be drifting east, toward places with more people, more mobile homes and more forest.
Myth 5: "Modern warnings have made tornadoes harmless"
Warnings have saved many lives. But the deadliest tornado in the whole record is not from the 1950s. It is the EF5 that struck Joplin, Missouri, on May 22, 2011, killing 158 people according to the database. Three weeks earlier, on April 27, 2011, Alabama was hit by an outbreak in which a single EF5 killed 72 and an EF4 killed 64. In 2011 tornadoes killed 553 people in all.
The other entries at the top of the list are from the 1950s, before modern radar and warning systems: 116 deaths in Michigan on June 8, 1953, 114 in Waco, Texas, on May 11, 1953, and 94 in Worcester, Massachusetts, the next day.
Recent years are calmer, but not safe. The database records 67 tornado deaths in 2025 and 52 in 2024. On May 16, 2025, an EF4 tornado tore through London, Kentucky, killing 19 people, the deadliest tornado in the history of the National Weather Service office in Jackson. The same afternoon, an EF3 struck St. Louis. In 2024, according to the NWS, 33 of the 54 tornado deaths happened in mobile or manufactured homes.
Forecasting is also under strain. By March 2025, 55 of the weather service's 122 field offices had vacancy rates above 20%, according to staffing data verified by the AP.
| # | Date | State | Rating | Deaths | Injuries | Path length |
|---|---|---|---|---|---|---|
| 1 | May 22, 2011 | MO | EF5 | 1,150 | 21.6 mi | |
| 2 | June 8, 1953 | MI | F5 | 844 | 18.9 mi | |
| 3 | May 11, 1953 | TX | F5 | 597 | 20.9 mi | |
| 4 | June 9, 1953 | MA | F4 | 1,228 | 34.9 mi | |
| 5 | May 25, 1955 | OK | F5 | 273 | 56.4 mi | |
| 6 | April 27, 2011 | AL | EF5 | 145 | 132.0 mi | |
| 7 | April 27, 2011 | AL | EF4 | 1,500 | 80.7 mi | |
| 8 | March 3, 1966 | MS | F5 | 518 | 202.5 mi |
Deaths and injuries as recorded in the SPC database for each tornado segment. Ratings before February 2007 use the original Fujita scale.
Myth 6: "Tornado season is spring"
Mostly true, with an important asterisk. In this record, May is the busiest month, with 22% of all tornadoes, followed by June and April. March to June together account for 62%. Spring is when warm, humid air from the Gulf of Mexico collides most often with cold, dry air from the north and west, the recipe for the rotating thunderstorms that produce tornadoes.
The asterisk is time of day. About 74% of tornadoes touched down between noon and 9 p.m. Central Standard Time, the time zone the database uses, when the day's heating has made the air most unstable. But 16% struck between 9 p.m. and 6 a.m., when people are asleep and can't see the sky. Night tornadoes are disproportionately deadly, and they are more common in the Southeast than on the Plains. The Enderlin EF5 struck just after 11 p.m., when most people in its path would have been indoors, many of them asleep.
Myth 7: "A tornado is a point on a map"
Each of these lines was a path, and some were very long. The longest single track in the database, 235 miles, crossed LA on March 22, 1953. Most of the lines on the map are much shorter, a mile or two. The longest ones show how a single storm can carve a scar across several counties in under an hour.
The map also simplifies. Each tornado is drawn as a straight line from touchdown to lift-off, but real tornadoes wobble and curve. Width isn't shown: some of the most violent tornadoes are more than a mile across. And tornadoes that cross state lines are recorded as segments, so the database counts each piece where it falls. Still, the overall picture is accurate: where tornadoes happen, how often, and how rarely they reach the top of the scale.
Reading the map
Take one more look at the bright lines. Almost every one of the brightest tracks crosses the band from Oklahoma through Arkansas, Mississippi, Alabama and Tennessee. That band is where to pay attention in spring, and increasingly in autumn and winter too. The faint threads everywhere else are a reminder that a weak tornado can turn up almost anywhere east of the Rockies, on almost any day the atmosphere is unstable enough.
Seventy-six years of records come down to two lessons. Most tornadoes are small, short and survivable. The few that aren't account for most of the damage and deaths, and nobody can yet say ahead of time which storm will produce one.
Sources and method
- NOAA Storm Prediction Center, Severe Weather Database: tornadoes 1950–2025 (actual tornado tracks). 1950-2025_actual_tornadoes.csv, retrieved October 9, 2026
- US state boundaries (us-atlas, from the Census Bureau's cartographic files)
Each tornado is drawn as a straight line from its recorded touchdown point to its lift-off point. Tracks that cross state lines are stored once in this file. Ratings are the Fujita scale before February 2007 and the Enhanced Fujita scale since; tornadoes with an unknown rating (−9 in the database) are drawn as EF0. Counts and records from the 1950s are not comparable with today's, because many weak tornadoes went unreported before Doppler radar and storm-spotter networks.
Charts like this, from your own numbers.
Connect a spreadsheet or the tools you run on, and Parity builds the dashboard and writes the report, with every number checked.
Try Parity free

