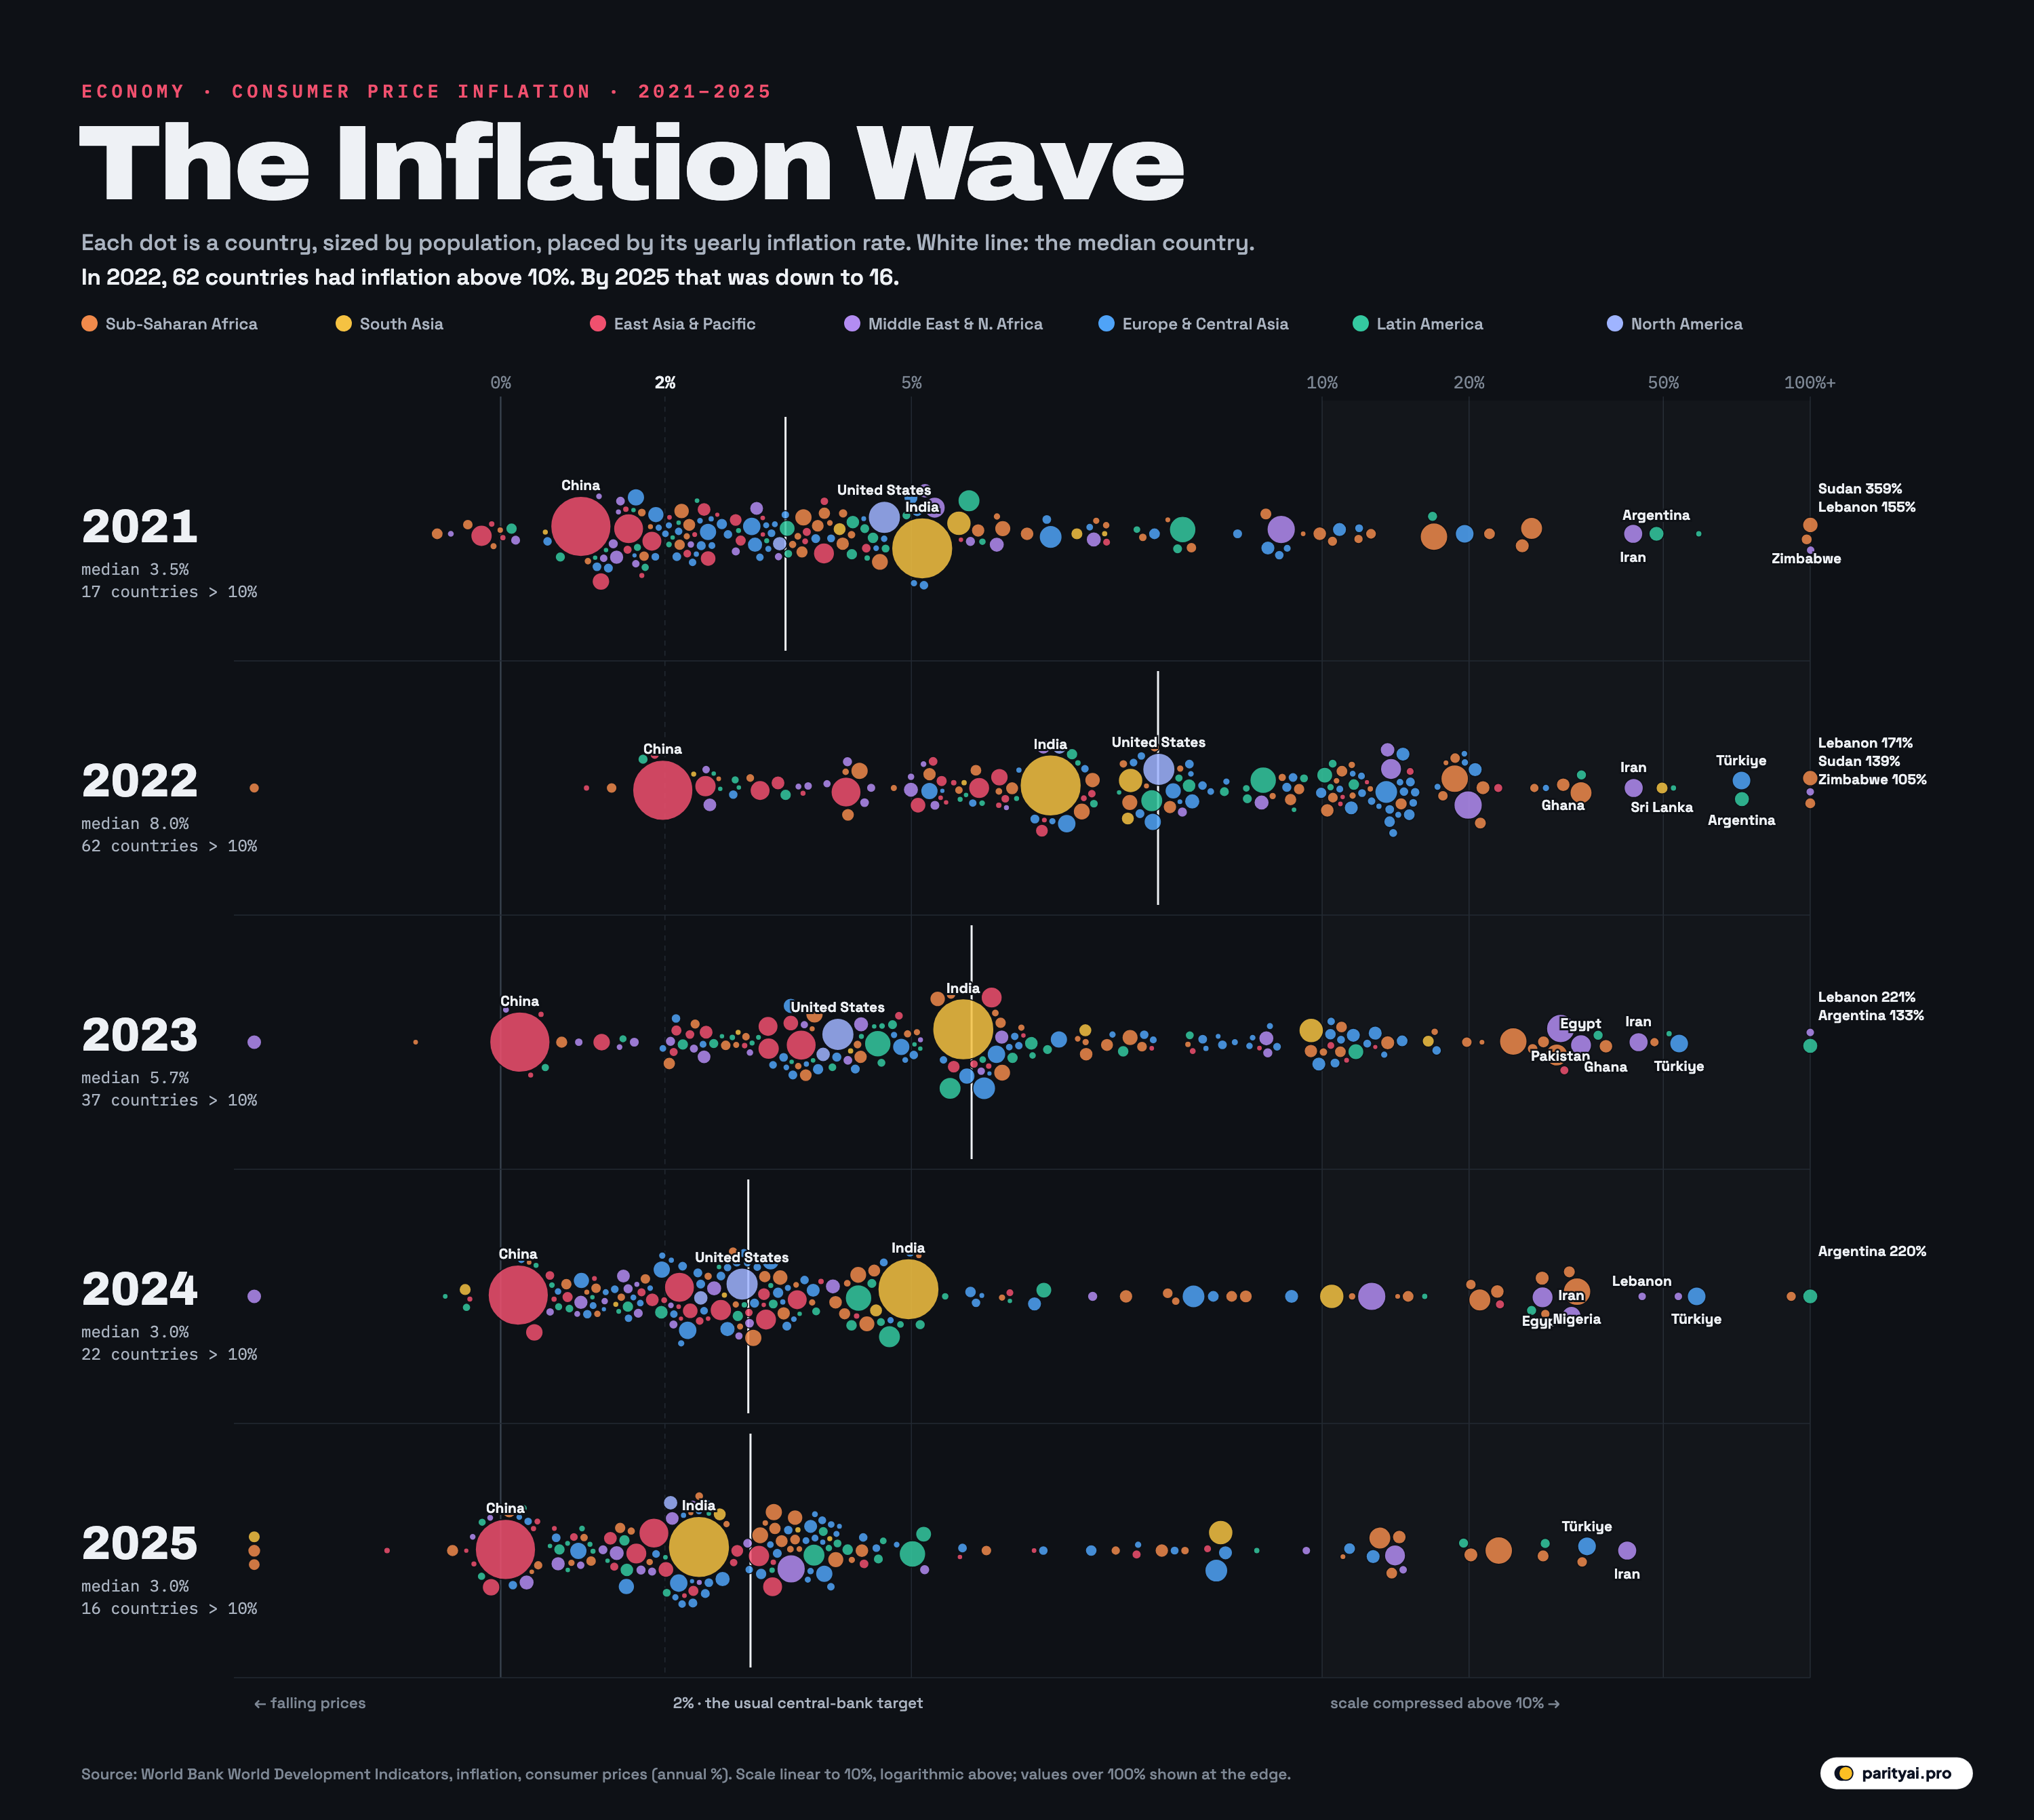
Every few decades, inflation stops being a local problem and becomes a global one. The early 2020s were one of those times. In 2021 prices began rising almost everywhere at once. In 2022 the wave crested. By 2025 it had mostly receded, leaving a few countries still struggling in its wake.
The chart above shows that wave one year at a time. Each of the five rows is a year, from 2021 to 2025. Each dot is a country, placed by its consumer price inflation that year, sized by its population and coloured by region. The white line in each row marks the median country, the one in the middle. Up to 10%, the horizontal scale is even. Beyond that it is compressed, so countries with very high inflation still fit on the page. The data come from the World Bank's inflation series, which mostly draws on IMF and national statistics.
This is the story of a wave, in four parts: how it built, how it broke, how it pulled back, and what it left behind.
The build: 2021
In the top row, most of the swarm still sits to the left of 5%. The median country's inflation in 2021 was 3.5%, and 75 of 179 countries were at 3% or below. Only 17 had inflation above 10%.
But the pressure was building. Economies were reopening after the pandemic. Households had saved money during lockdowns and governments had spent heavily to support them, so demand came back fast. Supply didn't. Factories, ports and shipping lines were jammed, and shortages of everything from computer chips to shipping containers pushed prices up. The United States ended the year at 4.7%, its highest annual inflation in three decades.
A few countries were already in crisis for reasons of their own. Sudan had inflation of 359.1%, and Lebanon 154.8%, both after the collapse of their currencies. Zimbabwe was at 98.5%.
The crest: 2022
In the second row the whole swarm lurches right. That is the clearest picture of a global inflation shock you'll find. The median country's inflation more than doubled to 8.0%. The number of countries with inflation above 10% jumped from 17 to 62. Only 16 countries kept inflation at 3% or less.
The trigger was Russia's invasion of Ukraine in February 2022. Russia is a huge exporter of oil and gas; Russia and Ukraine together are major exporters of wheat, maize and fertiliser. Energy and food prices soared, and because energy and food feed into the cost of almost everything else, inflation spread.
Rich countries saw rates they hadn't seen since the 1980s: United States 8.0%, United Kingdom 7.9%, Germany 6.9%. Developing countries with weak currencies and big import bills were hit harder. Pakistan reached 19.9%, Ghana 31.3%, Egypt 13.9%. Sri Lanka, which ran out of foreign currency to pay for fuel and food imports, hit 49.7%. Türkiye, whose central bank kept cutting interest rates as prices rose, reached 72.3%.
Two big countries stand out on the left of the 2022 row. China (2.0%) and Japan (2.5%) had inflation far below everyone else's: China because its economy was still largely closed by zero-COVID lockdowns, and Japan because it was emerging from decades of near-zero inflation.
The retreat: 2023–2024
By 2023 the swarm had begun moving back left, and by 2024 most of it was home. The median fell to 5.7% in 2023 and 3.0% in 2024. Countries above 10% fell to 37 and then 22.
Three forces pushed inflation down. Energy prices fell from their 2022 peaks. Supply chains untangled. And central banks raised interest rates faster than at any time in decades, cooling demand. By 2024 inflation was 2.9% in the United States, 3.3% in the UK and 2.3% in Germany, close to the 2% target most rich-country central banks aim for.
Some of the hardest-hit countries recovered dramatically. Sri Lanka, after a default, an IMF programme and a sharp rise in interest rates, went from 49.7% in 2022 to -0.4% in 2024: prices actually fell. Pakistan fell from 30.8% in 2023 to 12.6%.
Others got worse before they got better. Argentina's inflation reached 133.5% in 2023 and 219.9% in 2024 on the World Bank's annual-average measure, before the government of Javier Milei slashed spending and devalued the peso. By the end of 2025, its December-to-December inflation had fallen to 31.5%, the lowest since 2017, the Buenos Aires Herald reported. The World Bank hadn't published Argentina's 2025 annual figure yet, so it doesn't appear in the bottom row.
The aftermath: 2025
The bottom row is the calmest of the five. The median country's inflation was 3.0%. 83 of 169 countries with data had inflation of 3% or less, and only 16 were above 10%. 12 countries saw prices fall.
India (2.4%) had its lowest inflation in years, and China (0.1%) was flirting with deflation. China's consumer prices were unchanged over 2025 as a whole, a sign of weak demand at home rather than a success. Sri Lanka recorded the lowest figure on the chart, -4.8%.
At the right edge, the stragglers remain. Among countries with 2025 data, the highest inflation was in Iran (42.2%), Türkiye (34.9%), Burundi (34.1%), Haiti (28.6%) and Malawi (28.4%).
Türkiye shows how slowly inflation can come down even when policy changes. After the central bank reversed course in 2023 and raised rates steeply, annual-average inflation fell from 58.5% in 2024 to 34.9% in 2025, according to official data reported by Anadolu. That is still more than ten times the median country's.
| # | Country | 2021 | 2022 | 2023 | 2024 | 2025 | Path |
|---|---|---|---|---|---|---|---|
| 1 | Iran | 43.4% | 43.5% | 44.6% | 32.5% | ||
| 2 | Türkiye | 19.6% | 72.3% | 53.9% | 58.5% | ||
| 3 | Burundi | 8.4% | 18.8% | 26.9% | 20.2% | ||
| 4 | Haiti | 16.8% | 34.0% | 36.8% | 26.9% | ||
| 5 | Malawi | 9.3% | 21.0% | 28.8% | 32.2% | ||
| 6 | Nigeria | 17.0% | 18.8% | 24.7% | 33.2% | ||
| 7 | Angola | 25.8% | 21.4% | 13.6% | 28.2% | ||
| 8 | Bolivia | 0.7% | 1.7% | 2.6% | 5.1% | ||
| 9 | Lebanon | 154.8% | 171.2% | 221.3% | 45.2% | ||
| 10 | Ghana | 10.0% | 31.3% | 38.1% | 22.8% | ||
| 11 | Egypt | 5.2% | 13.9% | 33.9% | 28.3% | ||
| 12 | Zambia | 22.0% | 11.0% | 10.9% | 15.0% | ||
| 13 | Ethiopia | 26.8% | 33.9% | 30.2% | 21.0% | ||
| 14 | Ukraine | 9.4% | 20.2% | 12.8% | 6.5% | ||
| 15 | Kazakhstan | 8.0% | 15.0% | 14.5% | 8.7% | ||
| 16 | Sao Tome and Principe | 8.1% | 18.0% | 21.3% | 14.4% | ||
| 17 | West Bank and Gaza | 1.2% | 3.7% | 5.9% | 53.7% | ||
| 18 | Suriname | 59.1% | 52.4% | 51.6% | 16.2% | ||
| 19 | Uzbekistan | 10.8% | 11.4% | 10.0% | 9.6% | ||
| 20 | Bangladesh | 5.5% | 7.7% | 9.9% | 10.5% |
Annual average consumer price inflation. A dash means no figure published for that year.
The wave by region
The colours in the chart show that the wave hit every region, though not equally.
Measured by the median country in each region, Europe and Central Asia were hit hardest in 2022, at 10.8%. Europe was the most exposed to the loss of Russian gas, and the economies of Central Asia and the Caucasus trade heavily with Russia. Sub-Saharan Africa's median country reached 9.5%, and Latin America's 8.1%. South Asia reached 7.2%. East Asia and the Pacific (5.5%) and the Middle East and North Africa (5.2%) saw smaller rises at the median, though both contain some of the chart's biggest outliers, such as Lebanon, Egypt and Iran.
By 2025 the medians had come down everywhere: 3.7% in Europe and Central Asia, 3.4% in Sub-Saharan Africa, 3.1% in South Asia, 2.1% in Latin America, and 2.0% in both East Asia and the Pacific and the Middle East and North Africa. Latin America's recovery is notable. Several of its central banks, including Brazil's, began raising interest rates in 2021, well before most rich countries moved, and the region was among the first to bring inflation back toward normal levels.
The spread within each region still matters more than the median. A region can look calm while one or two countries in it are in crisis, which is why the swarm, showing every country, tells more than any average.
The next wave?
The calm at the bottom of the chart may not last. The war that began in the Persian Gulf in late February 2026 pushed oil prices up sharply. In April, the IMF projected that global headline inflation would rise modestly in 2026 before resuming its decline in 2027, in a report titled "Global Economy in the Shadow of War".
Iran, at the top of the 2025 list, is already seeing a new spike. Its consumer prices were 88.6% higher in early summer 2026 than a year earlier, Euronews reported, as the rial fell to record lows. Elsewhere, central banks in Europe, the US and Australia have started raising interest rates again to stop higher energy costs spreading into other prices.
A 2026 row on this chart will show whether those efforts worked.
| Year | Median country | Above 10% | 3% or less | Falling prices | Countries |
|---|---|---|---|---|---|
| 2021 | 17 | 75 | 7 | 179 | |
| 2022 | 62 | 16 | 1 | 179 | |
| 2023 | 37 | 34 | 2 | 177 | |
| 2024 | 22 | 88 | 5 | 176 | |
| 2025 | 16 | 83 | 12 | 169 |
Counts of countries with published figures each year.
How to read the chart
- Annual averages. Each figure is the average price level over a year compared with the year before. December-to-December rates, which governments often quote, can be quite different when inflation is changing fast, as Argentina's shows.
- Missing countries. Some countries, including the United States and Argentina, didn't yet have a 2025 figure in the World Bank data at the time of writing, and some crisis countries, such as Venezuela, Zimbabwe and Sudan in recent years, have no published figures at all. Their dots are missing, not zero.
- Compressed scale. Above 10% the scale is logarithmic. The jump from 10% to 20% takes up as much space as the jump from 50% to 100%.
- Bubble size. Larger dots are more populous countries. That is why China and India dominate each row, and why the world's experience of inflation was shaped so much by what happened in those two countries.
The story the five rows tell is one of a world caught by the same shock at the same time. Almost every country's dot moved right in 2022, and almost every one moved back by 2025. Inflation that spreads globally can also recede globally, but some countries take far longer to recover than others.
Sources and method
- World Bank, World Development Indicators: Inflation, consumer prices (annual %), FP.CPI.TOTL.ZG. Retrieved October 9, 2026
Inflation is the annual percentage change in each country's consumer price index, averaged over the year, as published by the World Bank (mostly from IMF and national statistics). The horizontal scale is compressed above 10% so that hyperinflation outliers fit; values above 100% are drawn at the right edge with their value labelled. Dot area is proportional to population. Countries appear in a year only if that year's figure is published, so the number of dots varies slightly by year.
Charts like this, from your own numbers.
Connect a spreadsheet or the tools you run on, and Parity builds the dashboard and writes the report, with every number checked.
Try Parity free

