Charts like this, from your own numbers.
Connect a spreadsheet or the tools you run on, and Parity builds the dashboard and writes the report, with every number checked.
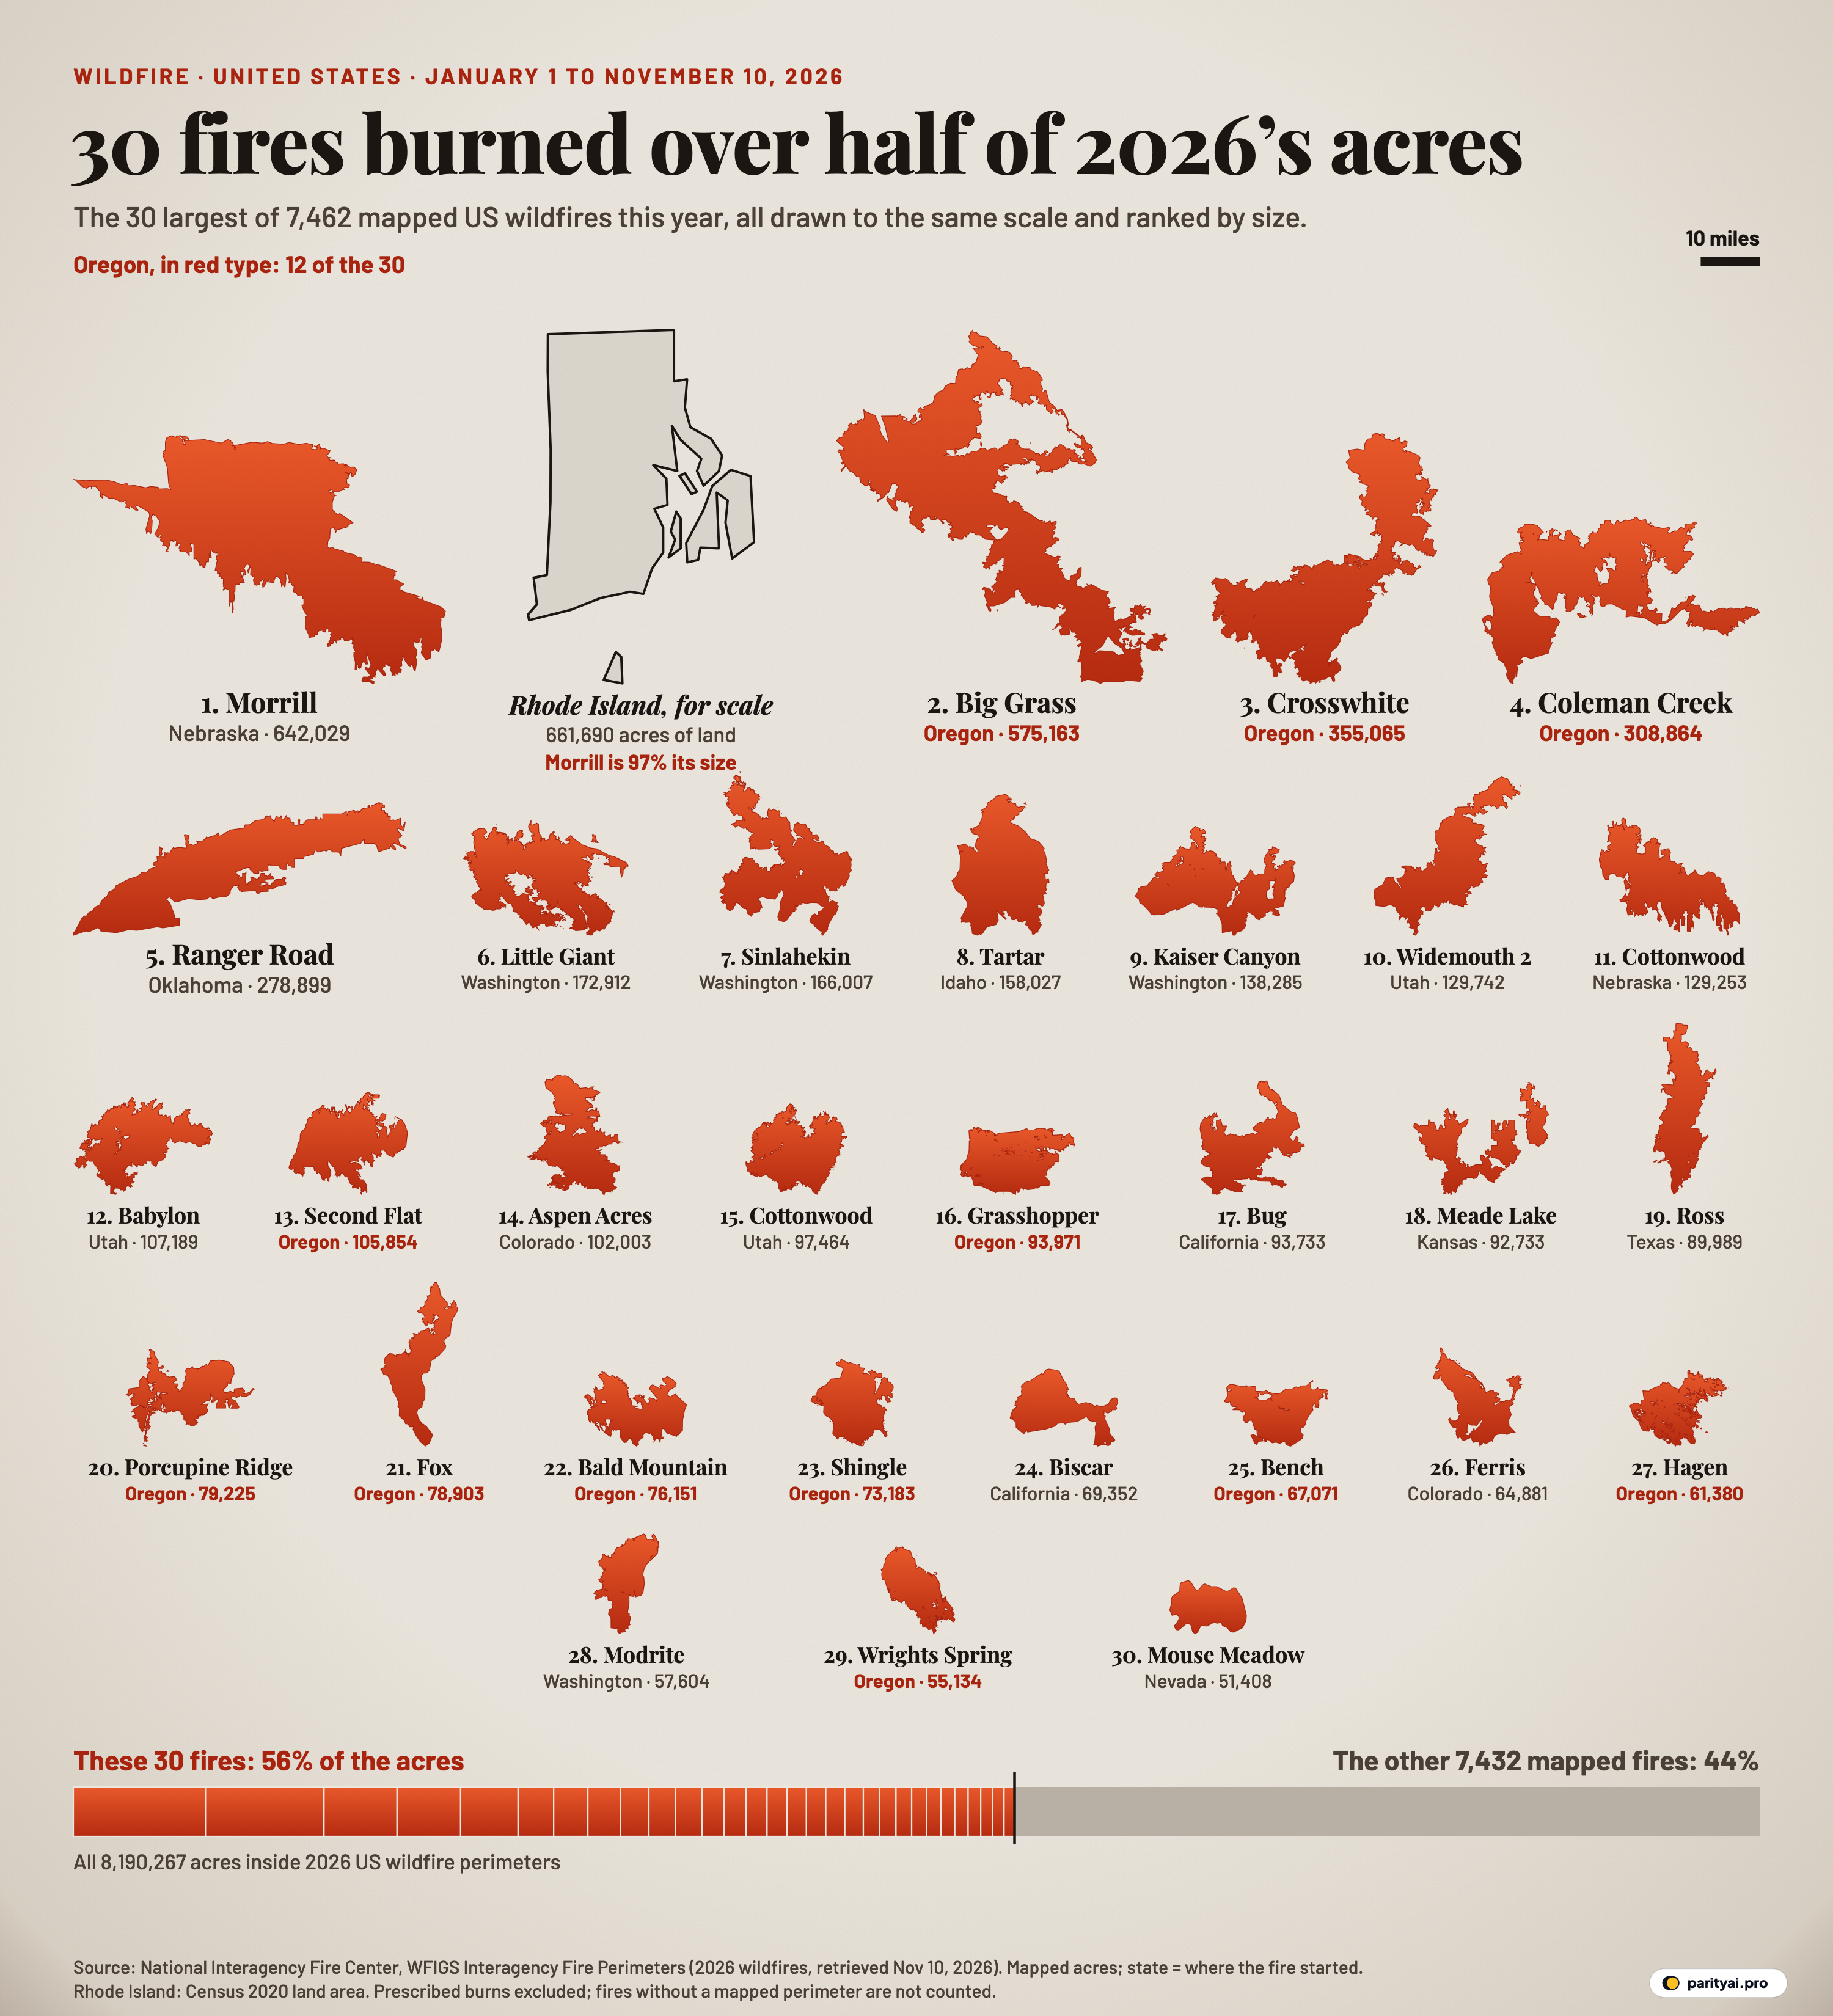
Try Parity freeOn March 13, a wildfire was reported in the Nebraska Panhandle. By the time its perimeter was mapped, it covered 642,029 acres. That is 97% of Rhode Island's land area, and it is the shape in the top-left corner of the poster above. It is also, on its own, 7.8% of every acre inside a mapped US wildfire perimeter so far this year.
The National Interagency Fire Center's perimeter service, WFIGS Interagency Fire Perimeters, held 8,113 wildfire records for 2026 when we downloaded it on November 10. 7,462 of them have a mapped area, and together they cover 8,190,267 acres. Rank those perimeters from largest to smallest and the first 30 add up to 4,571,477 acres, or 55.8% of the total. That is 0.40% of the fires, and it is the claim the poster is built to show. You only need the largest 23 to pass the halfway mark.
Reading the evidence board
Every orange shape is a real fire perimeter, drawn from the agency's own polygon. All of them use the same scale, so a shape twice as large on the page burned about twice the ground. The ten-mile bar at the top right fixes the scale. The grey outlined shape beside the first fire is Rhode Island at that same scale, the only shape on the page that isn't a fire. The holes inside some shapes are islands of unburned ground inside the outer line. Under each shape is its rank, its name, the state where it started and its mapped acres. Oregon's fires are printed in red type because there are so many of them. The bar along the bottom splits every mapped 2026 acre in two: the 30 fires on the board, and the other 7,432.
The rest of this piece is a set of case files. Each one is a short entry on one fire or a small group of fires. Each sticks to what the perimeter record and official or officially sourced reports say: size, dates and, where an agency has stated one, a cause. Where the record is silent, so is the file.
| Largest fires | Share of all perimeters | Share of mapped acres |
|---|---|---|
| Top 1 | 0.01% | |
| Top 5 | 0.07% | |
| Top 10 | 0.13% | |
| Top 30 | 0.40% | |
| Top 100 | 1.34% | |
| Top 75 | 1.01% | |
| Top 1,000 | 13.40% | |
| All 7,462 | 100.00% |
Cumulative share of the 8,190,267 acres inside 2026 wildfire perimeters, counting from the largest fire down.
File 1: Morrill, Nebraska
- Discovered: March 13, according to the perimeter record.
- Mapped size: 642,029 acres, the largest perimeter of the year.
- Counties: Morrill, Garden, Arthur, Keith and Grant, as Fox Weather reported from state briefings.
- Loss of life: one death. The governor announced that an 86-year-old woman from Arthur had died.
- Cause: blank in the NIFC record.
Fox Weather called the Morrill Fire "the single largest wildfire in Nebraska state history". The University of Nebraska's state climate office wrote that "the current wildfires are shattering state records" and compared them with 2012, the state's previous worst season.
A second Nebraska fire, Cottonwood, was discovered on March 15 and mapped at 129,253 acres. It is number 11 on the board. On March 23, WOWT reported that its cause was still under investigation.
Every acre on the board is fixed by the scale, and the Morrill Fire is 12.5 times the size of the 30th fire, Mouse Meadow in Nevada. In all, Nebraska's mapped perimeters for the year add up to 933,905 acres. That puts it second among the states, behind only Oregon, and 94% of it is in fires discovered in March.
File 2: Ranger Road, Oklahoma
- Discovered: February 17, making it the earliest of the top five.
- Mapped size: 278,899 acres. The record's reported incident size is 283,283 acres.
- Where: it started in Beaver County and, as High Plains Public Radio reported, spread north into Kansas.
- Response: the governor declared a state of emergency for Beaver, Texas and Woodward counties, and later added Harper.
- Cause: not recorded.
The Ranger Road Fire is the long, thin sliver at the start of the second row. Its shape is the record of a run in one direction. Like Morrill, it is a plains fire from the cold half of the year. Three of the top 30 were discovered in February or March, and together those three cover 1,050,182 acres, all before the western fire season began. One more plains fire made the board: Meade Lake in Kansas, number 18, at 92,733 acres. It was discovered on May 14.
File 3: Big Grass, Oregon
- Discovered: July 23.
- Mapped size: 575,163 acres, second on the board. The record's reported incident size is 578,637 acres.
- Where: it burned across Malheur County, Oregon, and Owyhee County, Idaho. The perimeter record counts it as an Oregon fire because that is where it started.
- Damage and injuries: by August 23, KBOI reported, it had threatened 74 homes and 148 other structures. An earlier report said three people were hurt and 159 had to leave their homes.
- Cause: that earlier report called it a lightning-sparked fire. The NIFC record's cause field is blank.
On paper, Big Grass is the most ragged silhouette on the board. A long arm runs out from a dense body. It reached 90% of Morrill's acreage while looking nothing like it.
File 4: The Oregon complexes
Fire managers group neighbouring fires into a "complex" so one team can run them. The perimeter service keeps each fire in a complex as its own polygon, and the poster follows the service.
- Crosswhite (number 3, 355,065 acres, discovered July 16) is by far the largest fire in the Rowe Creek Complex. KVAL reported that the complex was named on July 18, for fires in Wheeler, Wasco and Crook counties. The service holds 6 Rowe Creek perimeters with 373,627 acres between them. On July 28 the Oregon State Fire Marshal put the complex at 294,900 acres, so it kept growing after that.
- Porcupine Ridge (number 20, 79,225 acres, discovered July 16) is the only fire from the Hay Creek Complex in Sherman and Gilliam counties large enough for the board. The complex as a whole has 8 mapped perimeters with 254,012 acres between them. Several Hay Creek fires carry only numbers as names.
If each complex were drawn as one shape, Rowe Creek would still rank third, and Hay Creek, at 254,012 acres, would move up to sixth. Merging fires can only make the largest shapes larger, so the share held by the top 30 would rise, not fall.
File 5: Coleman Creek, Oregon
- Discovered: July 25, according to the perimeter record. A local incident update gives July 23.
- Mapped size: 308,864 acres, fourth on the board.
- Where: Harney and Malheur counties, east of Burns.
- Cause: the same update lists it as natural (lightning).
- Recorded incident: the interagency Lessons Learned Center has a report on an engine that caught fire on the Coleman Creek Fire on July 25. The engine belonged to the new United States Wildland Fire Service. Its crew sheltered in ground that had already burned, and one crew member was treated for burns and released.
On the board, Coleman Creek is a sprawl of fingers rather than one solid block.
File 6: The Washington three
Three Washington fires sit together at the start of the second row:
| Fire | Rank | Mapped acres | Discovered |
|---|---|---|---|
| Little Giant | 6 | 172,912 | July 16 |
| Sinlahekin | 7 | 166,007 | July 26 |
| Kaiser Canyon | 9 | 138,285 | July 16 |
- Little Giant started near Plain in the Okanogan-Wenatchee National Forest. In late August, MyNorthwest reported that it was "the top-priority wildfire in the country".
- Sinlahekin started west of Tonasket. KPQ called it "Washington's biggest wildfire of the 2026 season" at the time it reported.
- Kaiser Canyon started south of Nespelem. KOMO reported that lightning sparked it.
Washington has 4 fires on the board in all. Modrite, number 28, is the fourth.
File 7: Twelve days in July
The next file covers a stretch of dates rather than a place. Of the 30 fires on the board, 19 were discovered between July 16 and July 27. Those fires alone cover 2,818,168 acres, which is 34% of every mapped acre of the year. 22 of the 30 were discovered in July or August.
The national response shows the same peak. A memo from the National Multi-Agency Coordinating Group dated August 11 opens: "Today marks our 25th consecutive day at National Preparedness Level 5". Level 5 is the top of the scale. Counting back, that run began in the same week as most of the fires on the poster. In Oregon, the Northwest Interagency Coordination Center told reporters on August 9 that about 2,336,000 acres had burned in the state that season, beating the 2024 record.
The perimeter data now puts Oregon at 2,463,207 acres across 457 mapped fires, 30% of the national mapped total. 12 of the 30 fires on the board started in Oregon, and they account for 42% of the board's acres. Across the 11 states on the board, Oregon has more fires than the next three states combined.
File 8: The thousands of small files
Most entries in the cabinet are short. The median mapped 2026 wildfire covers 5.0 acres. 4,354 perimeters, 58% of the total, are under ten acres. 6,124 are under 100 acres, which is 82% of all fires. Between them, those under-100-acre fires burned 71,171 acres, or 0.9% of the year's mapped ground. The Morrill Fire alone burned 9 times as much.
| Perimeter size (acres) | Fires | Acres burned | Share of acres |
|---|---|---|---|
| Under 10 acres | 0.1% | ||
| 10–100 | 0.8% | ||
| 100–1,000 | 3.5% | ||
| 1,000–10,000 | 14.6% | ||
| 10,000–100,000 | 39.9% | ||
| 100,000 or more | 41.1% |
All 2026 wildfire perimeters in the WFIGS service, grouped by mapped size.
None of this makes small fires unimportant. Small on a map does not mean small work, and each one still drew a response. What the numbers say is narrower: if you want to understand how much land burned in 2026, the explanation sits almost entirely in the top rows of the size table. Only 14 fires passed 100,000 acres, and those 14 carry 41% of the total by themselves.
What the files leave out
Not every fire has a perimeter. NIFC's national year-to-date count stood at 68,179 fires and 9,471,008 acres through November 6. That is far more fires than the 7,462 with a mapped area here, and somewhat more acres than the 8,190,267 inside perimeters. The service itself notes that perimeters are not available for every incident. Measured against NIFC's national acreage instead, the top 30 would still cover 48% of the year's burned area. The poster's share applies strictly to mapped perimeters, and the bar says so.
651 records have no area. They are 2026 wildfire entries in the service with zero or blank acreage, and we leave them out.
Mapped acres are not always reported acres. The poster uses each polygon's GIS acres, so that the shapes and the numbers agree. For most large fires the two figures are close: Ranger Road is mapped at 278,899 acres against a reported 283,283. A few differ a lot. Shingle in Oregon is mapped at 73,183 acres, but its record reports 29,844. The CSV includes both columns.
State means where the fire started. Big Grass spread into Idaho and Ranger Road into Kansas, but each appears under its state of origin. So do the state totals above.
The cause field is mostly empty. For 26 of the 30 fires on the board, the general cause field in the NIFC record is blank. Two list equipment and vehicle use, and two list natural causes. Where this piece names a cause, it comes from the incident report it links to, not from the perimeter record. Causes we couldn't find stated are left out.
The year isn't over. This is January 1 to November 10. Fires can still be added, and perimeters can still be revised. A fresh download would shift the small numbers, though probably not the shape of the board.
Rhode Island is drawn a little generously. The outline comes from Census-derived state boundaries simplified for mapping, and that outline covers about 704,000 acres including some coastal water. The label uses the Census land area of 661,690 acres.
| # | Fire | State of origin | Mapped acres | Share of all mapped acres | Size vs Rhode Island | Discovered |
|---|---|---|---|---|---|---|
| 1 | Morrill | Nebraska | 7.8% | 97% | 2026-03-13 | |
| 2 | Big Grass | Oregon | 7.0% | 87% | 2026-07-23 | |
| 3 | Crosswhite | Oregon | 4.3% | 54% | 2026-07-16 | |
| 4 | Coleman Creek | Oregon | 3.8% | 47% | 2026-07-25 | |
| 5 | Ranger Road | Oklahoma | 3.4% | 42% | 2026-02-17 | |
| 6 | Little Giant | Washington | 2.1% | 26% | 2026-07-16 | |
| 7 | Sinlahekin | Washington | 2.0% | 25% | 2026-07-26 | |
| 8 | Tartar | Idaho | 1.9% | 24% | 2026-07-24 | |
| 9 | Kaiser Canyon | Washington | 1.7% | 21% | 2026-07-16 | |
| 10 | Widemouth 2 | Utah | 1.6% | 20% | 2026-07-27 | |
| 11 | Cottonwood | Nebraska | 1.6% | 20% | 2026-03-15 | |
| 12 | Babylon | Utah | 1.3% | 16% | 2026-06-26 | |
| 13 | Second Flat | Oregon | 1.3% | 16% | 2026-07-24 | |
| 14 | Aspen Acres | Colorado | 1.2% | 15% | 2026-06-29 | |
| 15 | Cottonwood | Utah | 1.2% | 15% | 2026-06-22 | |
| 16 | Grasshopper | Oregon | 1.1% | 14% | 2026-07-24 | |
| 17 | Bug | California | 1.1% | 14% | 2026-08-08 | |
| 18 | Meade Lake | Kansas | 1.1% | 14% | 2026-05-14 | |
| 19 | Ross | Texas | 1.1% | 14% | 2026-08-24 | |
| 20 | Porcupine Ridge | Oregon | 1.0% | 12% | 2026-07-16 | |
| 21 | Fox | Oregon | 1.0% | 12% | 2026-07-24 | |
| 22 | Bald Mountain | Oregon | 0.9% | 12% | 2026-07-23 | |
| 23 | Shingle | Oregon | 0.9% | 11% | 2026-07-23 | |
| 24 | Biscar | California | 0.8% | 10% | 2026-07-18 | |
| 25 | Bench | Oregon | 0.8% | 10% | 2026-07-23 | |
| 26 | Ferris | Colorado | 0.8% | 10% | 2026-06-27 | |
| 27 | Hagen | Oregon | 0.7% | 9% | 2026-07-16 | |
| 28 | Modrite | Washington | 0.7% | 9% | 2026-07-17 | |
| 29 | Wrights Spring | Oregon | 0.7% | 8% | 2026-08-05 | |
| 30 | Mouse Meadow | Nevada | 0.6% | 8% | 2026-07-24 |
Mapped GIS acres of each 2026 wildfire perimeter in the NIFC WFIGS service on November 10, 2026. Rhode Island = 661,690 acres of land (Census 2020). Discovery dates are UTC.
Closing the drawer
Draw the year's fires at one scale and a few shapes take up most of the board. The second row is still large, the third row is ordinary for a western summer, and the rest of the 7,462 perimeters would hardly show at this size. The 30th fire, Mouse Meadow, still covers 51,408 acres, about 80 square miles. 2,240 of the fires that never made the board were under an acre.
These fires had little in common in season, landscape or state. Two burned in Nebraska in March and one in Oklahoma in February. Most of the rest were discovered within days of each other in late July, across the West. What they share is the hardest thing to predict in fire management: a small number of starts that keep growing until they account for most of the year's burned land.
Sources and method
- National Interagency Fire Center, Wildland Fire Interagency Geospatial Services (WFIGS): WFIGS Interagency Fire Perimeters. All 2026 wildfire (WF) perimeters, retrieved November 10, 2026. Courtesy of NIFC and its partner agencies; US government data, no use restrictions stated.
- National Interagency Fire Center: National Fire News (year-to-date statistics)
- US state boundaries (us-atlas, from the Census Bureau's cartographic boundary files)
- State of Rhode Island: Facts and figures (Census 2020 land area)
Fires are 2026 wildfire perimeters (incident type WF, unique fire identifier beginning 2026) in the NIFC WFIGS Interagency Fire Perimeters service, as retrieved on November 10, 2026; prescribed burns are excluded. Acres are the GIS acres of each mapped perimeter, which can differ from the incident size reported on the fire's last situation report. Fires inside a complex are counted separately, as the service maps them. Not every fire has a perimeter, so the denominator for shares is the 7,462 perimeters with a mapped area (651 further 2026 wildfire records in the service carry no acreage and are left out), not NIFC's national count of fires. Silhouettes are drawn on an azimuthal equal-area projection centred on each fire, all at the same number of pixels per kilometre, with unburned islands left as holes. State is the state of the point of origin; several fires crossed state lines. Rhode Island is drawn from the Census-derived us-atlas outline at the same scale; its acreage is the Census 2020 land area (the simplified outline itself covers about 704,000 acres because it takes in some coastal water, so the drawn state is slightly generous).
Charts like this, from your own numbers.
Connect a spreadsheet or the tools you run on, and Parity builds the dashboard and writes the report, with every number checked.
Try Parity free

