Charts like this, from your own numbers.
Connect a spreadsheet or the tools you run on, and Parity builds the dashboard and writes the report, with every number checked.
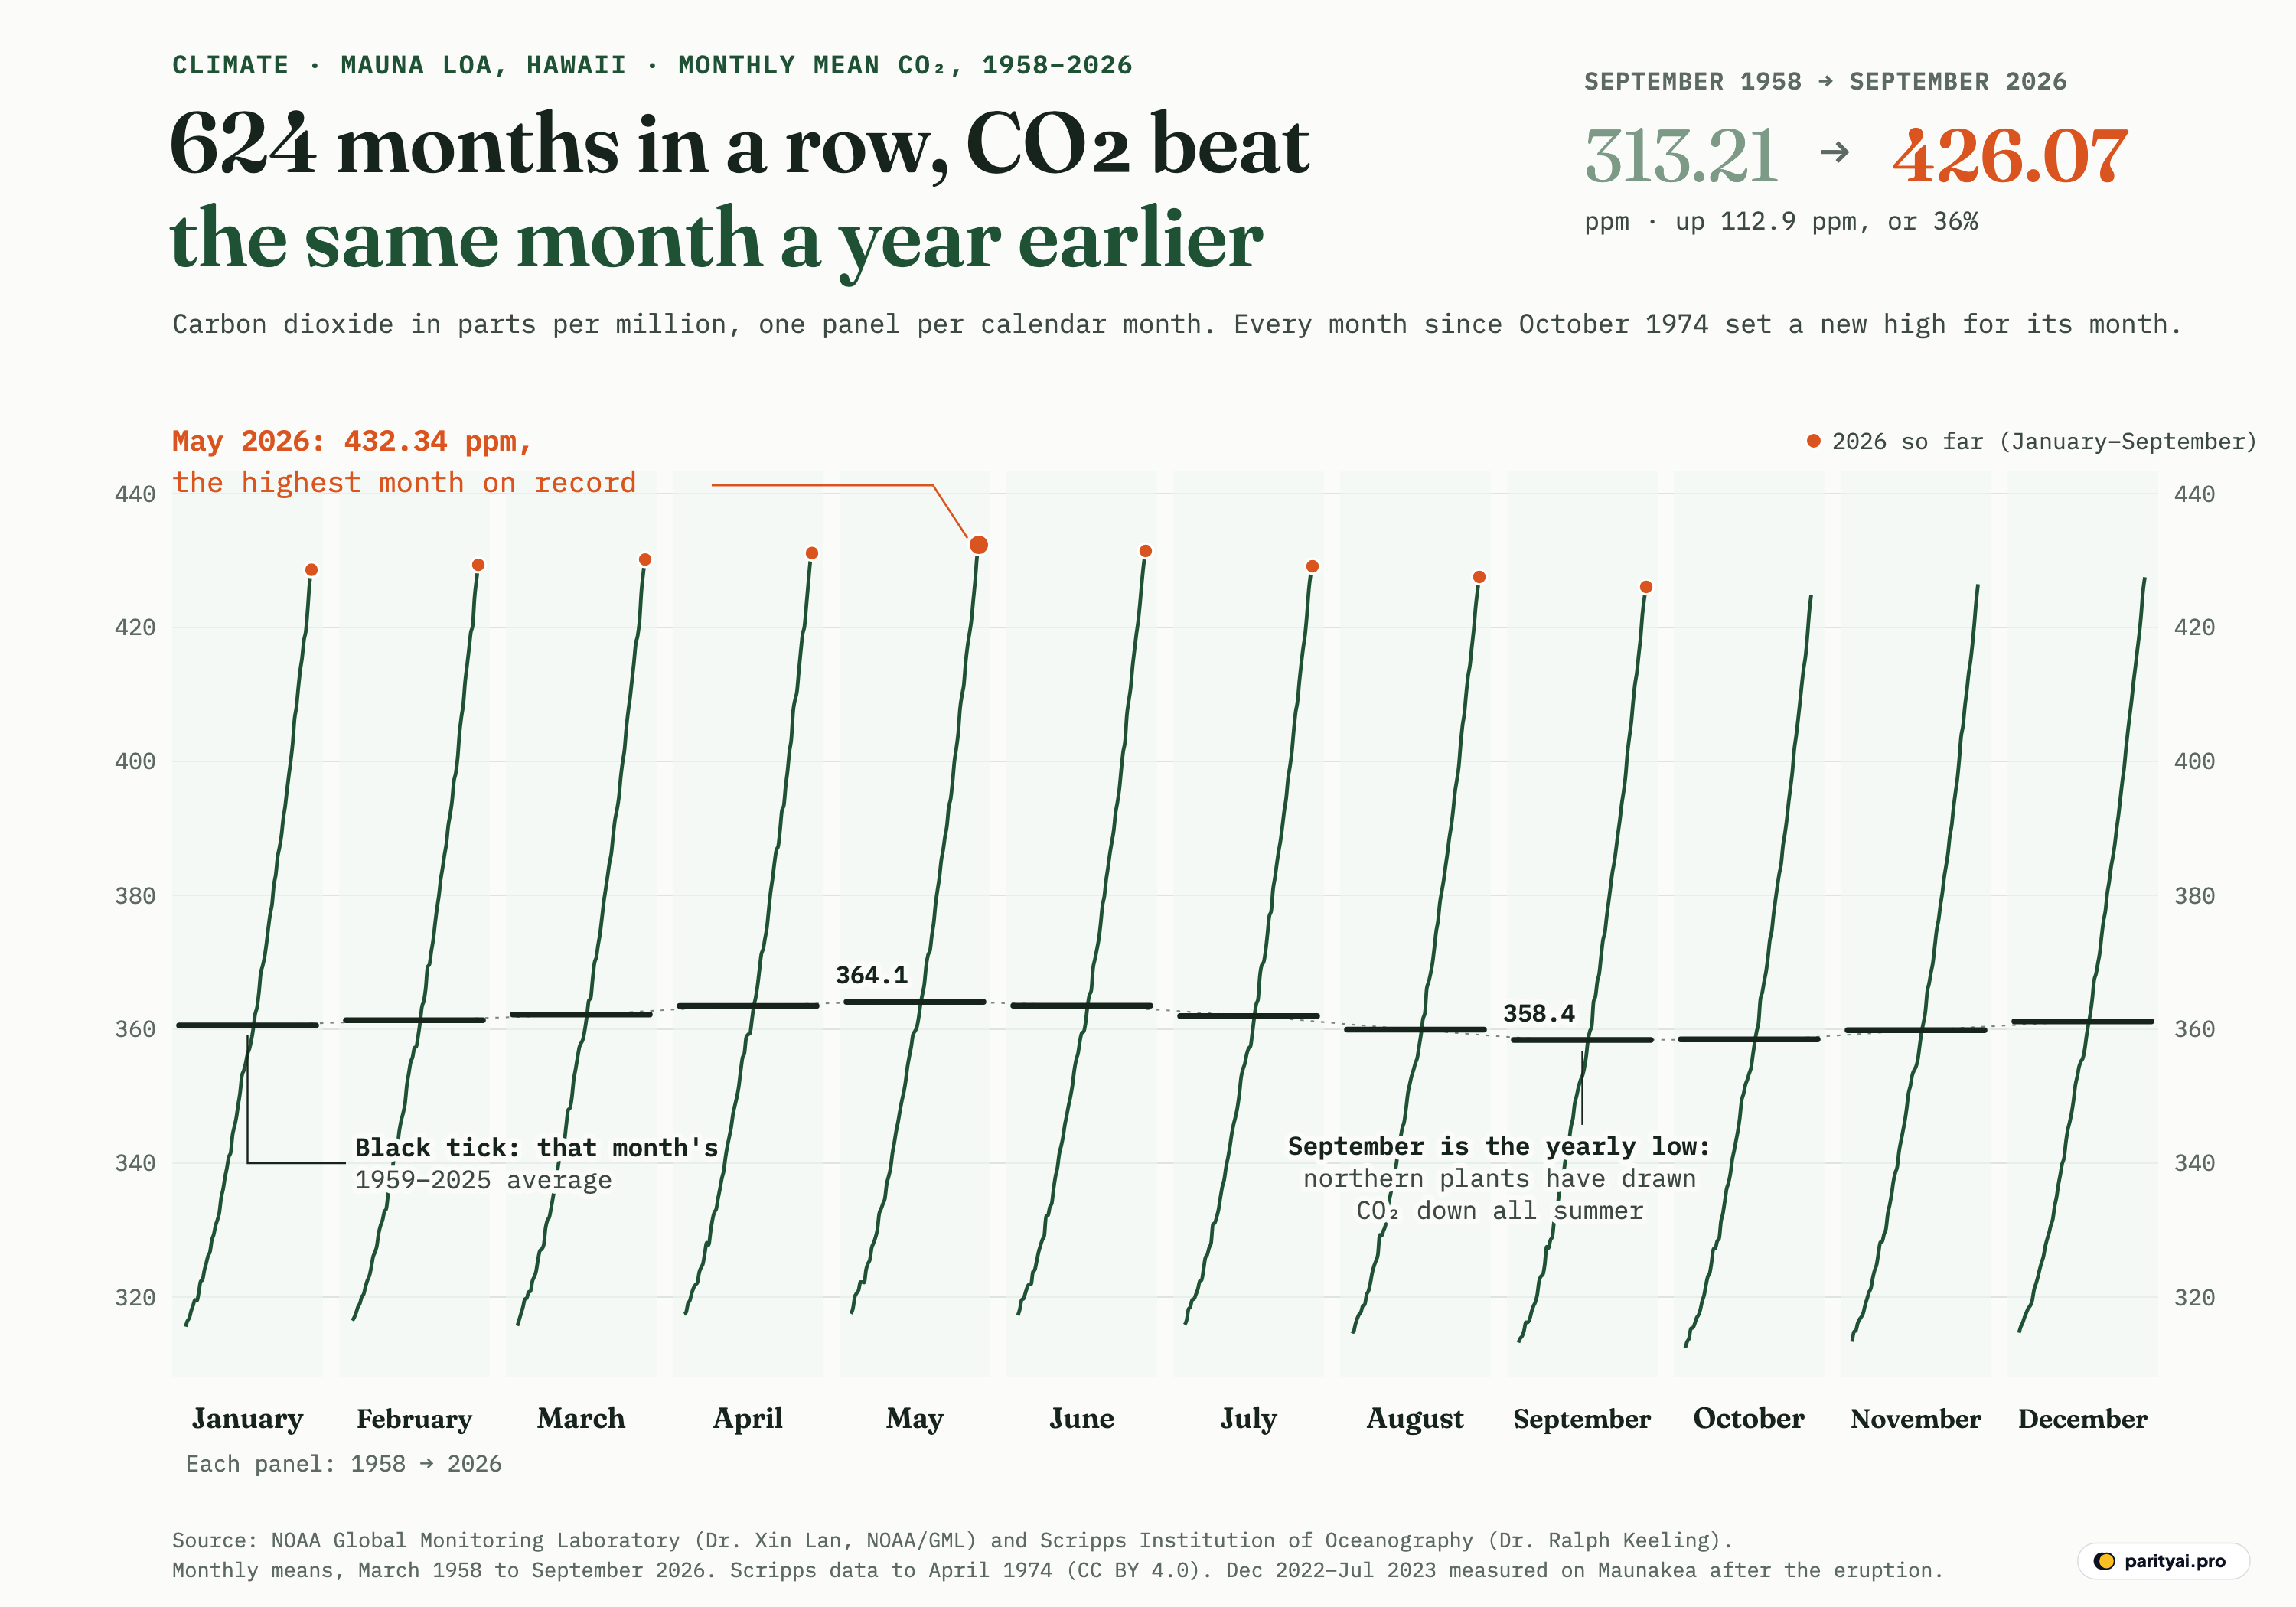
Try Parity freeThe last time a month at Mauna Loa came in lower than the same month a year before, it was September 1974. Carbon dioxide that month averaged 327.33 parts per million, a shade under the 327.52 of September 1973. Since then the record has run 624 months without a single repeat of that: every month from October 1974 to September 2026 has been higher than its twin twelve months earlier. That is 52 years of new highs for every calendar month.
The graphic above is built to show that one fact. It is a cycle plot: twelve narrow panels, one for each calendar month, January on the left and December on the right. Inside each panel, a green line follows that month's value at Mauna Loa from the first year it was measured to the latest, so the January panel is every January from 1959 to 2026, the May panel every May from 1958 to 2026, and so on. All twelve share one vertical scale, in parts per million (ppm) of carbon dioxide in dry air. The short black tick across each panel is that month's average over the same 67 full years, 1959 to 2025. Orange dots mark the nine months of 2026 measured so far.
Two things are visible at once. The lines all climb, steeply and without a dip, which is the long rise. And the black ticks are not level: they climb from January to a high in May (364.1 ppm) and sink to a low in September (358.4 ppm), a swing of 5.7 ppm. That is the seasonal breath of the planet's northern forests and fields, which the Scripps Keeling Curve team explains as photosynthesis pulling carbon dioxide out of the air through the northern summer, with "the decrease in CO2 levels that begins every year in May." Splitting the record into months separates the two signals. The breath lives in the ticks; the rise lives in the lines.
The data are the monthly means published by the NOAA Global Monitoring Laboratory, 823 months from March 1958 to September 2026. The first sixteen years were measured by Charles David Keeling of the Scripps Institution of Oceanography; NOAA began its own measurements in 1974. The story of that record is easiest to tell by the levels it passed.
315 ppm
The NOAA file opens in March 1958 at 315.71 ppm. Keeling's very first reading, according to UC San Diego, was 313 ppm on March 29, 1958; the monthly figure is an average over the whole month, which NOAA corrects to the middle of it. Either way, the starting line was already well above the level before industrialisation. NOAA puts the global average before the Industrial Revolution at about 280 ppm, and says that over the past 800,000 years carbon dioxide moved between roughly 180 ppm in ice ages and 280 ppm in warm periods.
In those first years, 315 ppm was not yet a floor. The seasonal low dipped under it every autumn, and the last month below 315 was September 1961, at 314.99 ppm. The annual mean first cleared 315 in 1959 (315.98 ppm), and 1962 was the first full year in which every month stood above it.
This is also where the record's only stumbles sit. Of the 811 months that can be compared with the same month a year earlier, just 8 were not higher: August 1959 (314.80 vs 314.93); September 1963 (316.21 vs 316.24); January 1965 (319.44 vs 319.57); May 1965 (322.17 vs 322.25); June 1965 (321.87 vs 321.89); April 1971 (327.78 vs 328.13); August 1974 (329.15 vs 329.31); September 1974 (327.33 vs 327.52). The largest of those gaps is 0.35 ppm, and all eight come before NOAA's own instruments had a full year of data. The early Scripps months carry no day counts in the NOAA file, and the growth rate then was small: the annual mean rose 0.93 ppm in 1960 and only 0.42 ppm in 1965, the slowest year in the record. When the trend adds less than a part per million a year, a month of unusual weather can be enough to hide it. Once the trend got faster, nothing could.
The first narrow margin of the long streak shows how close that was. October 1974, the month the run began, beat October 1973 by just 0.09 ppm, the smallest year-on-year gain of all 624 months. Every month after it cleared its twin by more.
350 ppm
The second level took 28 years to reach. The first month at or above 350 ppm was May 1986, at 350.52 ppm, and the climb from 315 had passed through 320 in May 1960, 330 in May 1972 and 340 in March 1980. Nearly all of those first crossings happened in spring, and that is the breath again: each new level is touched first at the seasonal high, months or years before the rest of the calendar catches up. 350 ppm was first touched in May 1986; the annual mean crossed it in 1988; and the last month below it was October 1988, at 349.37 ppm. From 1989 on, every month was above.
The same lag applies to every level in this story, and the table puts the four side by side.
| Level | First month at or above | First annual mean above | First year with every month above | Last month below |
|---|---|---|---|---|
| 315 ppm | March 1958 (315.71) | 1959 | 1962 | September 1961 (314.99) |
| 350 ppm | May 1986 (350.52) | 1988 | 1989 | October 1988 (349.37) |
| 400 ppm | May 2013 (400.02) | 2015 | 2016 | October 2015 (398.49) |
| 430 ppm | May 2025 (430.51) | not yet | not yet | September 2026 (426.07) |
Monthly means; the 'every month above' and annual columns use complete calendar years 1959–2025. September 2026, the latest month, sits below 430 because of the seasonal low.
Read across a row and you see the season at work. A level is reached first in a spring month, then by the year as a whole, and only a year or so later does the September and October trough clear it. The gap between the first month and the last month below is about two and a half years for 350 ppm and for 400 ppm.
The growth rate kept climbing through this period. Averaged by decade, the annual mean rose 0.86 ppm a year in the 1960s, 1.22 in the 1970s and 1.64 in the 1980s. The annual mean itself was 316.91 ppm in 1960, 325.68 in 1970, 338.76 in 1980 and 354.45 in 1990. The pace did not rise in a straight line. In 1992 and 1993 the annual mean rose only 0.84 and 0.67 ppm, before speeding up again. A slow year in this record is still an increase: all 66 year-on-year changes in the annual mean from 1960 to 2025 are positive.
400 ppm
The climb from 350 to 400 took 27 years, almost as long as the first stretch, but it covered 50 ppm instead of 35. The milestone months on the way are spaced closely: 360 in May 1993, 370 in April 1999, 380 in April 2004, 390 in May 2009. In the NOAA file as it stands today, the first month at or above 400 ppm is May 2013, at 400.02 ppm. NOAA's announcement at the time was about a single day: on May 9, 2013, the daily mean "surpassed 400 parts per million (ppm) for the first time since measurements began in 1958." The same release said the growth rate had gone from about 0.7 ppm a year in the late 1950s to 2.1 ppm a year over the previous decade.
A word of caution about that monthly value. NOAA moved the record to a new calibration scale, the WMO X2019 scale, in February 2021, and revised monthly values can shift by small amounts. A month sitting a few hundredths above a round number, as May 2013 does, is a reminder that round numbers are milestones for people, not thresholds in the air.
The annual mean crossed 400 in 2015. The last month below 400 was October 2015 (398.49 ppm). From 2016 onward, the whole year sat above it, and it has never come back down. The table below shows how much faster each decade moved than the one before.
| Years | Yearly rise | Average rise per year | Fastest year |
|---|---|---|---|
| 1960s | 1969 (+1.57) | ||
| 1970s | 1973 (+2.23) | ||
| 1980s | 1988 (+2.38) | ||
| 1990s | 1998 (+2.96) | ||
| 2000s | 2003 (+2.53) | ||
| 2010s | 2016 (+3.40) | ||
| 2020–2025 | 2024 (+3.52) |
Change in the calendar-year mean from the year before. The 1960s row starts with 1960 minus 1959; the last row covers 2020–2025.
The 1990s (1.53 ppm a year) were the only decade slower than the one before. After that, the decade averages rose: 1.91 ppm a year in the 2000s, 2.40 in the 2010s and 2.62 for 2020 to 2025. Inside each decade the yearly rises bounce around, which the sparklines show. Some of the fastest single years, 1998 (+2.96 ppm) and 2016 (+3.40 ppm), stand out in their decades, but this dataset alone cannot say why any given year was fast or slow.
430 ppm
The last 30 ppm took twelve years. Monthly means passed 410 in April 2018, 420 in April 2022, 425 in March 2024 and 430 in May 2025, at 430.51 ppm. The two labs reported that peak slightly differently: UC San Diego's 2025 release gave Scripps's May average as 430.2 ppm and NOAA's as 430.5 ppm, and said the seasonal peak had "exceeded 430 parts per million" for the first time.
The fastest stretch in the whole record falls inside this period. The single largest year-on-year gain for any month is March 2024, 4.39 ppm above March 2023, and the largest rise in the annual mean is 2024, up 3.52 ppm to 424.60. NOAA said in June 2024 that the rise in the May peak from 2022 to 2024 was the largest two-year jump in its record. NOAA's John Miller put it down to sustained high fossil fuel emissions combined with "El Nino conditions limiting the ability of global land ecosystems to absorb atmospheric CO2." In 2025 the annual mean rose 2.74 ppm, to 427.35, which is 27.3 ppm above 400.
This is also the stretch with the oddest measurement history. The Mauna Loa volcano erupted in November 2022, lava covered the observatory's access road, and NOAA moved sampling to Maunakea, about 21 miles to the north, with the University of Hawaii's help. The 8 months from December 2022 to July 2023 in this chart come from that site. In the cycle plot they sit on the same rising lines as everything else; nothing in the panels jumps at the switch. In June 2026 UC San Diego wrote that work at the observatory still "remains limited to mission-critical functions" while renovations are completed.
The panels themselves can be read as a table, and here it is.
| Calendar month | Value, first year to 2026 | Mean, 1959–2025 (ppm) | First year | Latest | Rise since first year | 2026 vs 2025 |
|---|---|---|---|---|---|---|
| January | 360.6 | 315.58 (1959) | 428.62 (2026) | ▲ 1.97 | ||
| February | 361.4 | 316.49 (1959) | 429.35 (2026) | ▲ 2.26 | ||
| March | 362.2 | 315.71 (1958) | 430.15 (2026) | ▲ 2.00 | ||
| April | 363.5 | 317.45 (1958) | 431.12 (2026) | ▲ 1.48 | ||
| May | 364.1 | 317.51 (1958) | 432.34 (2026) | ▲ 1.83 | ||
| June | 363.5 | 317.27 (1958) | 431.43 (2026) | ▲ 1.82 | ||
| July | 362.0 | 315.87 (1958) | 429.13 (2026) | ▲ 1.26 | ||
| August | 359.9 | 314.93 (1958) | 427.55 (2026) | ▲ 2.07 | ||
| September | 358.4 | 313.21 (1958) | 426.07 (2026) | ▲ 1.70 | ||
| October | 358.5 | 312.42 (1958) | 424.87 (2025) | not yet | ||
| November | 359.8 | 313.33 (1958) | 426.46 (2025) | not yet | ||
| December | 361.2 | 314.67 (1958) | 427.49 (2025) | not yet |
Monthly mean CO2 at Mauna Loa in parts per million. January and February start in 1959, March to December in 1958; October to December end in 2025. The long-term mean uses 1959–2025 for every month. May is highlighted: it is the highest month of the year on average.
Every row says the same thing in a different month. The rise since the first year ranges from about 112 to 115 ppm, because each panel starts and ends in slightly different years, and the long-term means trace the same breath that the ticks show in the graphic. The 2026 column compares each month this year with the same month of 2025. All nine are higher, by between 1.26 ppm (July) and 2.26 ppm (February).
432.34 ppm
That is May 2026, the highest monthly mean in the record and the largest orange dot in the graphic. It is 1.83 ppm above May 2025's 430.51. Scripps's own figure for the month, from its separate instruments on the same mountain, was 432.00 ppm; the two programmes run separate instruments, and in each of the last three Mays their published figures differed by a few tenths of a part per million.
May being the top is not a 2026 quirk. Taking each full year from 1959 to 2025, May was the highest month in 61 of the 67 years, April in 4 and June in 2. The lowest month was September in 40 years and October in 27. Keeling, UC San Diego notes, "was the first to recognize that CO2 levels in the Northern Hemisphere peaked in May," and he was also the first to see that the levels rose every year. The cycle plot puts those two discoveries side by side: the shape of each year is in the ticks, the rise is in the lines.
The breath is not getting smaller. The gap between the highest and lowest month was 5.0 ppm in 1959 and 6.1 ppm in 2025. It has wandered between 4.8 ppm (2000) and 6.9 ppm (1991) over the record. But that swing is now small next to a single year of growth: in 2024 the annual mean rose 3.52 ppm, against a seasonal swing that year of 4.9 ppm. When Keeling began, the gain from one year to the next was a fraction of the breath, which is why a lucky month could still come in below its twin. Today, the gain from one May to the next (1.83 ppm in 2026) is bigger than the average seasonal drop from May to June (0.56 ppm) or from August to September (1.53 ppm).
What the chart does not show
A few limits are worth stating plainly. Mauna Loa is one site. NOAA calls it the oldest continuous carbon dioxide measurement station in the world, and the primary benchmark for the global rise, but one station is not a global average. The monthly values are averages of daily means and are corrected to the middle of the month; NOAA fills the occasional missing month by interpolation. The 1959–2025 means behind the black ticks were chosen so that all twelve panels cover the same years; using each panel's own full span would tilt January and February (which start in 1959) against October to December (which end in 2025). The latest months are preliminary and can be revised by small amounts. And none of this graphic says anything about where the carbon came from: that comes from emissions inventories and other research, not from a single station's readings.
Back under 430, briefly
The most recent month in the file, September 2026, came in at 426.07 ppm. That is below 430, because September is the bottom of the breath, and it is still 1.70 ppm above September 2025. It is also 112.9 ppm above September 1958, a rise of 36%, which is the small comparison at the top right of the graphic. In the milestone table, it appears as the last month below 430 ppm, though only for now: the annual mean has not yet crossed that level, and no full year has stayed above it.
What the record shows so far is a pattern with no exceptions in more than half a century. Whatever month comes next will be compared with its twin from a year before, and for 624 consecutive months the answer has been the same. Ralph Keeling, who now directs the Scripps programme his father started, summed up the 2025 peak in four words: "Another year, another record."
Sources and method
- NOAA Global Monitoring Laboratory, Mauna Loa CO2 monthly mean data (co2_mm_mlo.csv). Monthly mean CO2 mole fraction at Mauna Loa Observatory, March 1958 to September 2026 (file created October 9, 2026), retrieved November 10, 2026. Data provided by NOAA Global Monitoring Laboratory, Boulder, Colorado, USA (https://gml.noaa.gov). Credit as NOAA asks: Dr. Xin Lan, NOAA/GML (gml.noaa.gov/ccgg/trends/). NOAA material is in the public domain and not subject to copyright protection (17 U.S.C. 403); its use here implies no endorsement by NOAA.
- Scripps CO2 Program, Scripps Institution of Oceanography at UC San Diego (March 1958 to April 1974 portion). Measurements from March 1958 through April 1974 were made by C. David Keeling of Scripps and are included in the NOAA file. Credit: Dr. Ralph Keeling, Scripps Institution of Oceanography (scrippsco2.ucsd.edu). Licensed CC BY 4.0 (creativecommons.org/licenses/by/4.0/).
We use the 'average' column of NOAA's monthly file, the monthly mean CO2 dry-air mole fraction in parts per million on the WMO X2019 scale. NOAA fills a few missing months by interpolation (flagged by negative uncertainty in the file; every month before May 1974 carries that flag because Scripps does not supply day counts). From December 2022 to early July 2023, after the Mauna Loa eruption cut access, measurements came from a site on Maunakea about 21 miles north. A month 'beats the same month a year earlier' when its value is strictly higher than the value for the same calendar month twelve months before. Each panel's long-term mean is the average of that calendar month over the full years 1959–2025, so all twelve means cover the same years. Annual means are averages of the twelve monthly values and are only computed for complete years (1959–2025). A milestone month is the first month whose average reached the level; individual days crossed some levels earlier. Recent months can still be revised slightly.
Charts like this, from your own numbers.
Connect a spreadsheet or the tools you run on, and Parity builds the dashboard and writes the report, with every number checked.
Try Parity free

