Key takeaways
- World military spending reached a record $2.887 trillion in 2025, the 11th straight annual rise, according to SIPRI. The world now spends 2.5% of its GDP on its armed forces, the highest share since 2009.
- The top two places didn't change in a decade: the United States first, China second. Almost everything below them did.
- Germany climbed from ninth to fourth, Ukraine from 42nd to seventh, and Poland from 20th to 14th. Saudi Arabia and Brazil fell.
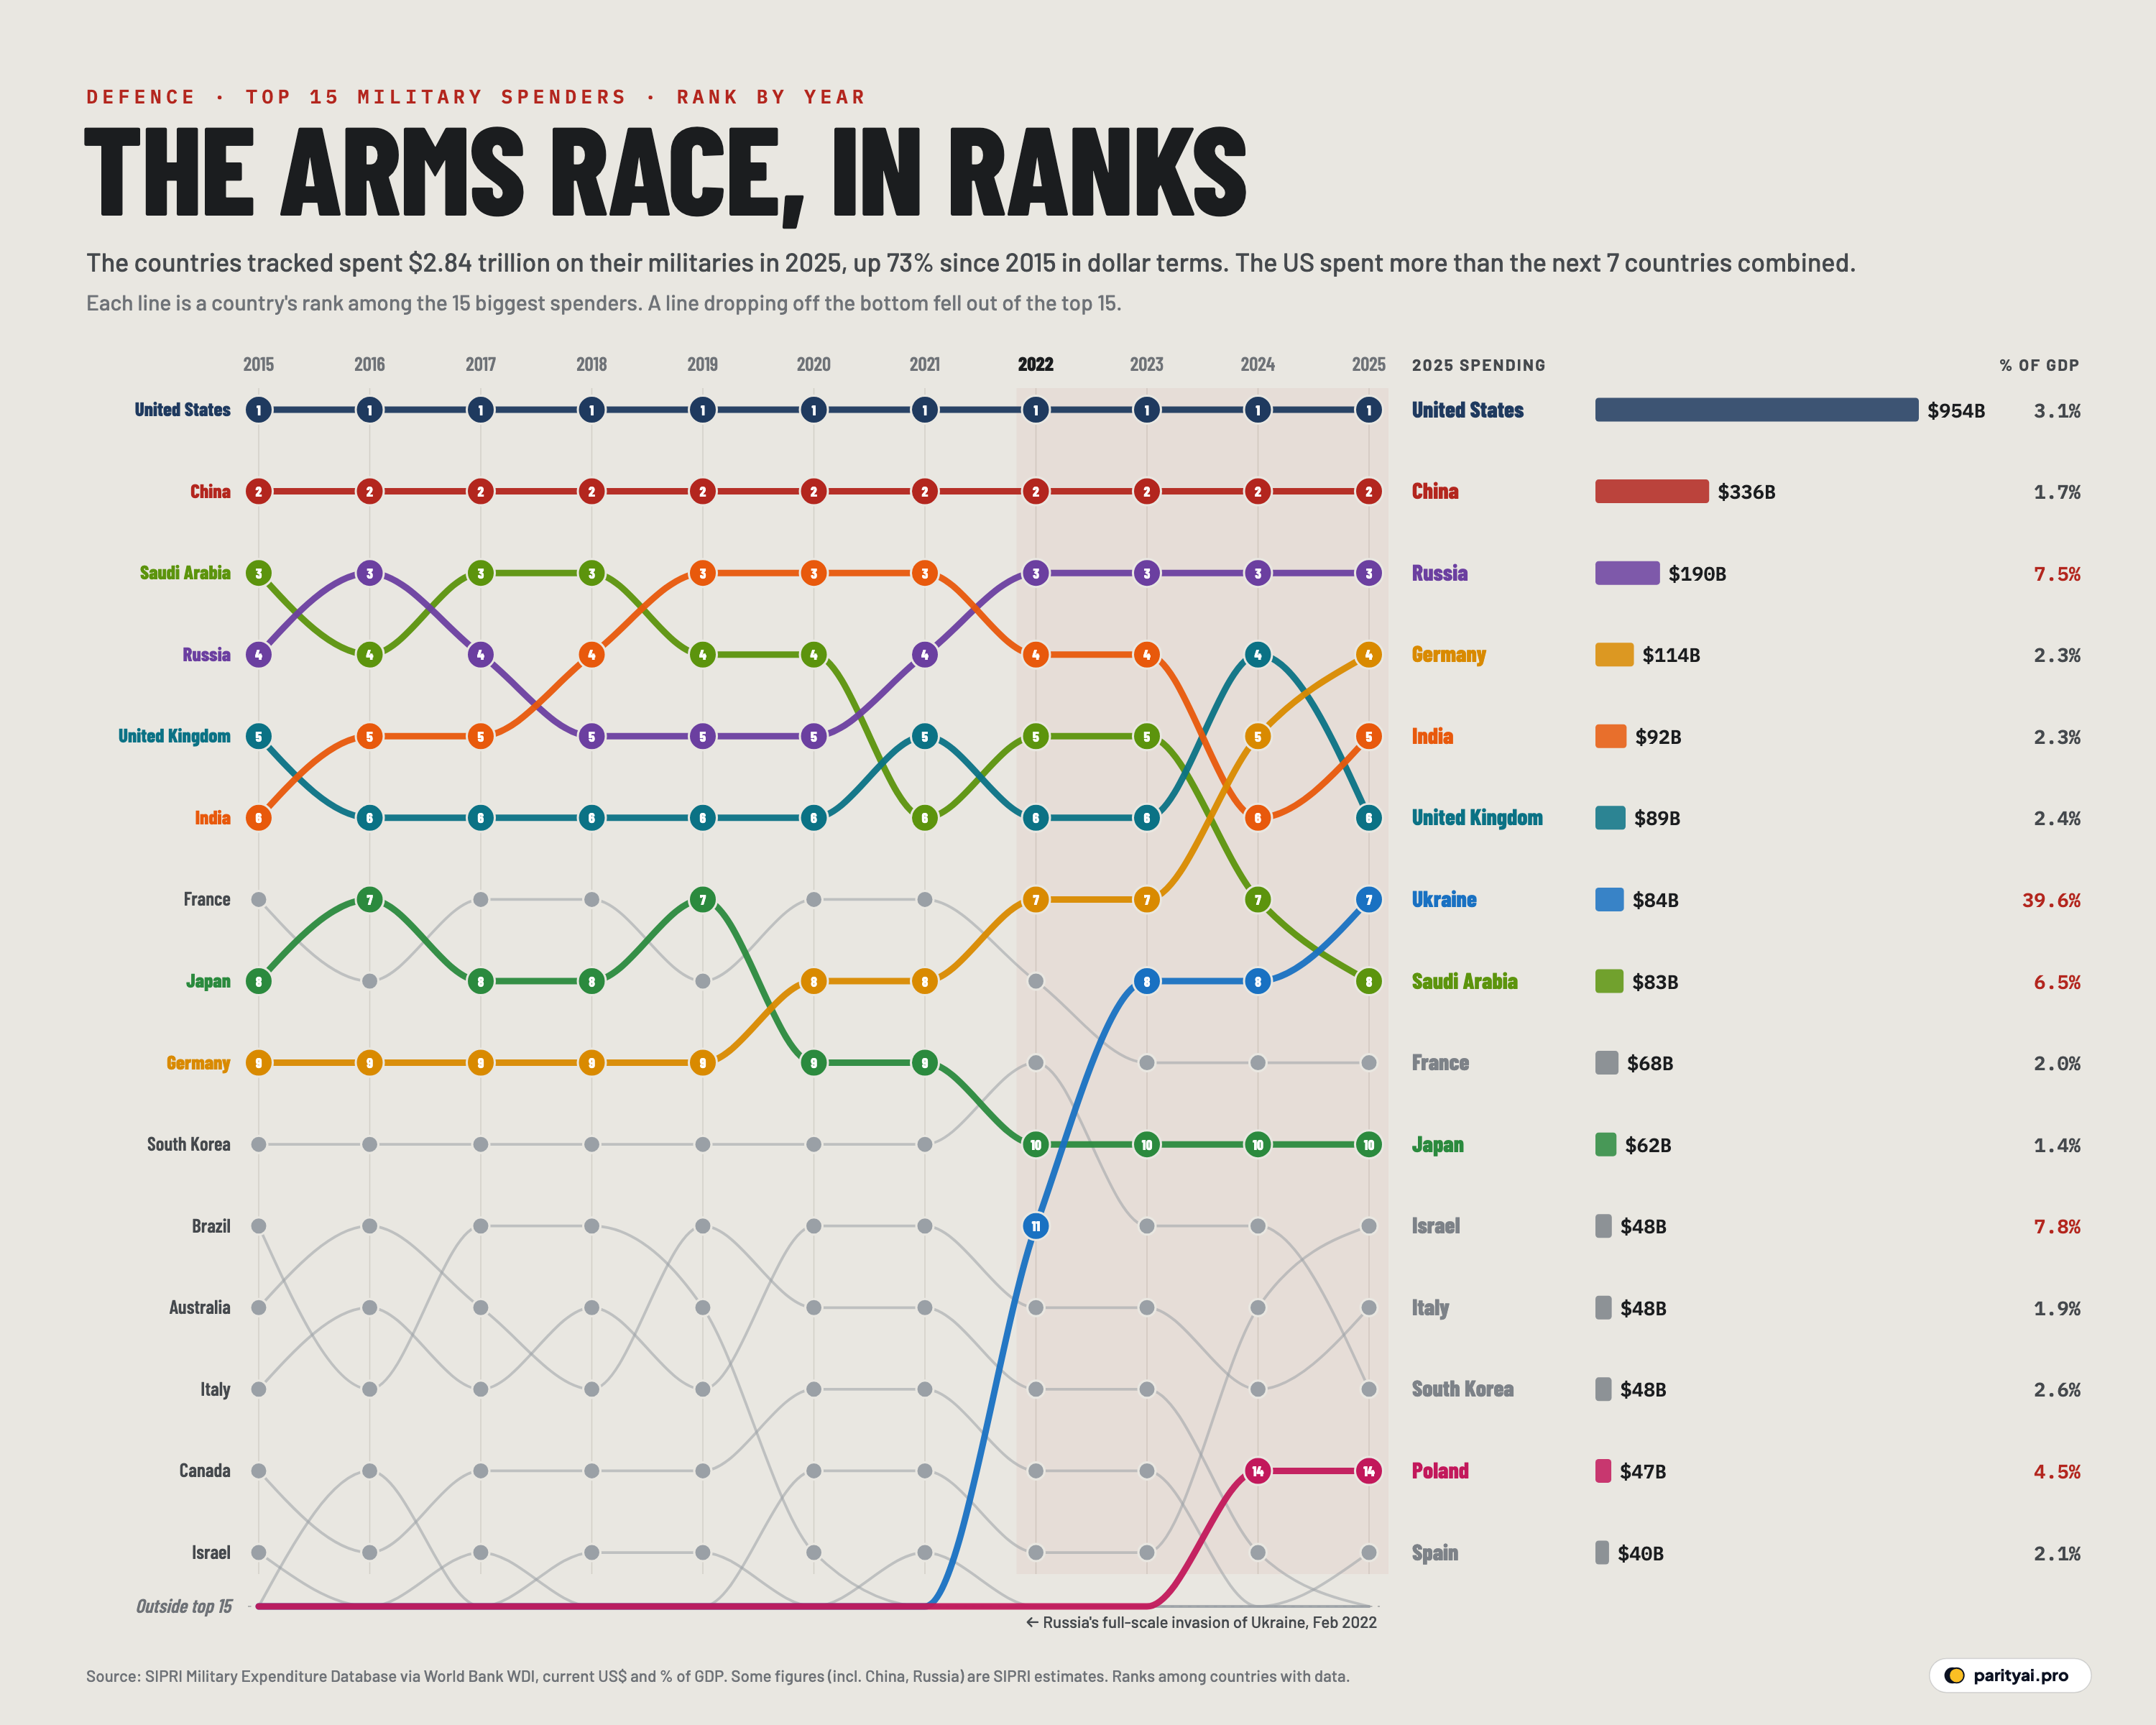
Think of the world's military budgets as a league table. Each year since 2015, the chart above ranks the 15 countries that spent the most on their armed forces. Each line traces one country's position from season to season, and a line that drops off the bottom has fallen out of the top 15. The column on the right gives each country's 2025 budget in US dollars and as a share of its economy. Countries spending more than 4% of GDP are shown in red.
The figures come from the Stockholm International Peace Research Institute (SIPRI), the standard source on military spending, via the World Bank's development indicators. SIPRI's annual report, released in April 2026, put total world military spending in 2025 at $2,887 billion, up 2.9% in real terms on 2024 and the 11th consecutive annual increase.
Here is the decade's league table, from the champions down.
The fixed positions
Some things didn't move at all. The United States finished first in every season. Its $954 billion budget in 2025 is about 34% of all the military spending in the data, and more than the next 7 countries combined. In SIPRI's figures, US spending actually fell 7.5% in 2025 in real terms. As a share of the economy, it has slipped from 3.5% in 2015 to 3.1%, because the US economy grew faster than its defence budget.
China finished second every year. Its budget grew 71% in dollar terms over the decade, to $336 billion, and SIPRI estimates a 7.4% rise in 2025 alone. Because China's economy grew just as fast, its spending stayed at about 1.7% of GDP throughout. SIPRI's figure for China is an estimate. The official budget leaves out some spending, such as some military research and arms imports, so SIPRI adds those back in.
The big climbers
Russia rose from fourth in 2015 to third, and its line has stayed there since 2022. Its budget nearly tripled, to $190 billion, and SIPRI estimates it now spends 7.5% of its economy on the military, up from 4.9%. War in Ukraine has turned the Russian economy toward arms production, at the cost of other spending.
Ukraine made the most dramatic climb on the chart, the blue line that shoots up from below the table. In 2015 it ranked 42th, and as recently as 2021 it was 33th. By 2025 it was seventh, with a budget of $84 billion. SIPRI puts that at about 40% of Ukraine's GDP, by far the highest share of any country in the data. That figure excludes the much larger amount of military aid Ukraine has received from its allies.
Germany went from ninth in 2015 to fourth in 2025, now the biggest spender in Europe. Its budget almost tripled to $114 billion. After the 2022 invasion, the government announced a major rearmament programme to rebuild its armed forces. Spending rose 24% in 2025 alone, according to SIPRI. Germany's spending has risen from 1.1% of GDP to 2.3%.
Poland, the pink line that enters the table in 2024, rose from 20th to 14th, with a budget of $47 billion, 4.5% of its GDP. That is the highest share of any NATO member. Bordering both Russia and Ukraine, it has been buying tanks, artillery and aircraft at a rapid pace.
Israel climbed from 15th to 11th, its budget up 202% to $48 billion after the war in Gaza that began in October 2023. It now spends 7.8% of its GDP on its military.
The fallers
Saudi Arabia spent the most of any country after the US and China in 2015, ranking third. By 2025 it had dropped to eighth. Its budget is roughly the same in dollar terms as a decade ago ($83 billion, -5% since 2015), but others grew past it. It still spends 6.5% of GDP on defence, down from 12.6% in 2015, when it was fighting in Yemen and oil revenues were high.
Brazil, 11th in 2015, has dropped out of the table entirely, to 21st, with spending of $24 billion. Australia fell from 12th to 17th, and South Korea from 10th to 13th, both overtaken by faster-rising European budgets rather than cutting their own.
The United Kingdom (5th to 6th) and France (7th to 9th) each slipped a place or two despite increasing their budgets by about half, overtaken by Germany, Ukraine and India.
The middle of the table
India has been near the top throughout, peaking at third in 2021 and finishing fifth in 2025 with $92 billion. Its spending is about 2.3% of GDP, a share that has drifted down slightly over the decade as its economy grew quickly. Japan stayed in the bottom half of the top ten, at 10th, but its spending rose from 0.9% to 1.4% of GDP, a big change for a country that kept defence near 1% for decades. Italy, Spain and Canada all more than doubled their budgets in dollar terms.
| # | Country | Spending | Share of GDP | Since 2015 | Rank in 2015 | 2015–2025 |
|---|---|---|---|---|---|---|
| 1 | United States | 3.1% | ▲ 51% | 1 | ||
| 2 | China | 1.7% | ▲ 71% | 2 | ||
| 3 | Russia | 7.5% | ▲ 187% | 4 | ||
| 4 | Germany | 2.3% | ▲ 197% | 9 | ||
| 5 | India | 2.3% | ▲ 79% | 6 | ||
| 6 | United Kingdom | 2.4% | ▲ 48% | 5 | ||
| 7 | Ukraine | 39.6% | ▲ 2301% | 42 | ||
| 8 | Saudi Arabia | 6.5% | ▼ 5% | 3 | ||
| 9 | France | 2.0% | ▲ 49% | 7 | ||
| 10 | Japan | 1.4% | ▲ 48% | 8 | ||
| 11 | Israel | 7.8% | ▲ 202% | 15 | ||
| 12 | Italy | 1.9% | ▲ 121% | 13 | ||
| 13 | South Korea | 2.6% | ▲ 31% | 10 | ||
| 14 | Poland | 4.5% | ▲ 358% | 20 | ||
| 15 | Spain | 2.1% | ▲ 165% | 17 | ||
| 16 | Canada | 1.6% | ▲ 106% | 14 | ||
| 17 | Australia | 1.9% | ▲ 47% | 12 | ||
| 18 | Türkiye | 1.9% | ▲ 91% | 16 | ||
| 19 | Netherlands | 2.2% | ▲ 234% | 25 | ||
| 20 | Algeria | 8.8% | ▲ 144% | 19 | ||
| 21 | Brazil | 1.1% | ▼ 3% | 11 | ||
| 22 | Singapore | 3.0% | ▲ 86% | 23 | ||
| 23 | Norway | 3.3% | ▲ 193% | 29 | ||
| 24 | Sweden | 2.5% | ▲ 206% | 35 | ||
| 25 | Indonesia | 1.0% | ▲ 98% | 26 |
SIPRI data via the World Bank, current US dollars. Highlighted: spending above 4% of GDP.
The red column: who carries the heaviest burden
Dollar totals tell you which militaries are biggest. The share of GDP tells you which countries are putting the most of their economies into defence, and that list looks very different.
In 2025, six countries in the top 25 spent more than 4% of GDP on their militaries. Ukraine spent 39.6%. Algeria, which ranks 20th in dollars with $25 billion, spent 8.8%, one of the highest burdens in the world, up from 5.6% of its economy in 2015. Its budget has risen 144% in dollar terms over the decade, though it still slipped from 19th place to 20th as others grew even faster. Israel spent 7.8% and Russia 7.5%. Saudi Arabia spent 6.5% and Poland 4.5%, the highest share of any NATO member and far above the alliance's old 2% guideline.
At the other end, Japan (1.4%), Brazil (1.1%) and Canada (1.6%) spend less than 2% of their economies on defence. China, the world's second-largest spender in dollars, spends only 1.7% of its GDP, because its economy is so large.
The burden matters because defence spending competes with everything else a government pays for: health, education, pensions, roads and interest on debt. A country spending 7% or 8% of its output on its military, as Russia, Israel and Algeria do, has far less room for those. Over time, high military spending can also crowd out the investment that drives future growth, which is why economists watch the burden as closely as the total. That is one reason the NATO target is controversial in European countries that are already struggling with high debts and ageing populations. Supporters argue that the cost of not being ready for war would be far higher.
The new targets
The next few seasons of this table are likely to be even more volatile. At their summit in The Hague in June 2025, NATO members committed to spending 5% of GDP on defence and security by 2035. That means at least 3.5% on core defence and up to 1.5% on related areas such as infrastructure and cyber security. Most European members spend around 2% today. Hitting 3.5% would mean budgets that are far larger than those on this chart.
SIPRI noted that the 29 European NATO members together spent $559 billion in 2025. If they all reached the new core target, that would rise sharply, enough to move several European countries further up the table.
How to read the chart
- Ranks, not size. The lines show positions, not amounts. The gap between first and second is enormous ($954 billion against $336 billion), while the gap between 10th and 15th is a few billion dollars. Small changes in spending or exchange rates can swap places near the bottom of the table.
- Dollars at market rates. Spending is converted to US dollars at market exchange rates. A dollar buys much more military labour and equipment in Russia, China or India than in the US or Europe, so dollar comparisons understate those countries' military effort.
- Estimates. SIPRI's figures for countries such as China, Russia and Saudi Arabia are partly estimates, because governments don't publish complete budgets. The trends are reliable; individual numbers less so.
- Shares of GDP. The percentage column shows how much of each economy goes to the military, the measure NATO uses for its targets. It is a better sign of the burden than the dollar total.
In 2015, a world without a major war in Europe looked possible. The chart shows how much that changed in ten years. The league table at the top has barely moved; underneath it, almost every country is spending more.
Sources and method
- World Bank, World Development Indicators: military expenditure (current US$) MS.MIL.XPND.CD and (% of GDP) MS.MIL.XPND.GD.ZS, from the Stockholm International Peace Research Institute (SIPRI). Retrieved October 9, 2026
Military expenditure follows SIPRI's definition, which covers armed forces, defence ministries, paramilitary forces trained for military operations and military space activities, and counts spending on personnel, operations, procurement, research and military aid. Figures are in current US dollars at market exchange rates, so currency moves affect them. Some figures, including China's and Russia's, are SIPRI estimates. Ranks are among countries with data in each year.
Charts like this, from your own numbers.
Connect a spreadsheet or the tools you run on, and Parity builds the dashboard and writes the report, with every number checked.
Try Parity free

