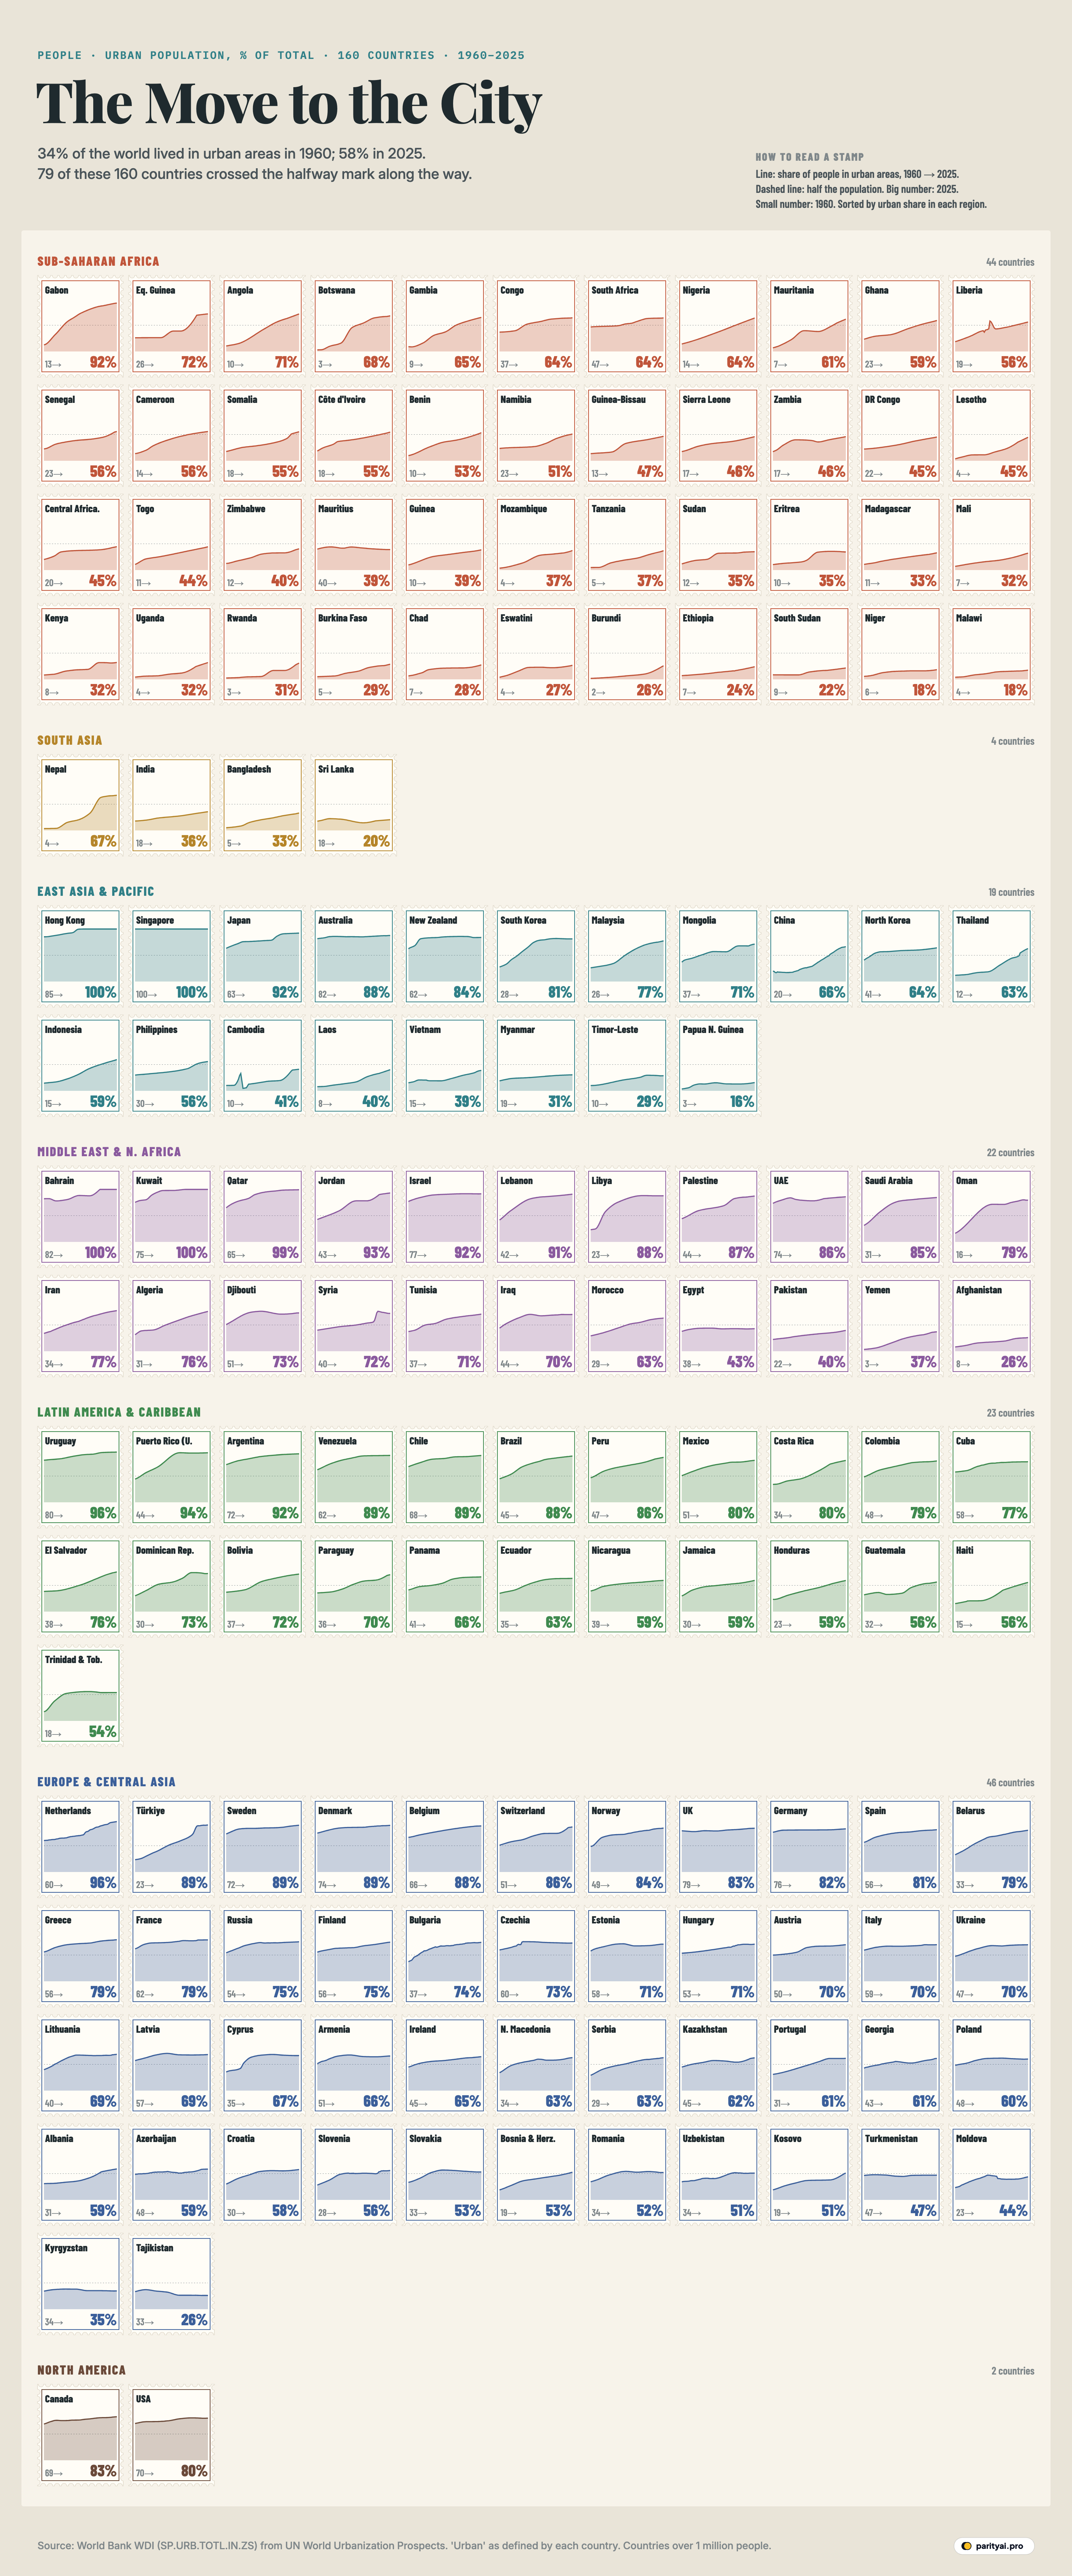
In 1960, about a third of the world's people lived in towns and cities; 34%, by the count of the UN Population Division that the World Bank publishes. By 2025, the share was 58%. Somewhere around 2007, for the first time in human history, there were more people living in urban areas than in the countryside.
The sheet of stamps above tells that story one country at a time. Each stamp is a country with at least a million people, 160 of them, grouped by region. The coloured line inside is the share of its population living in urban areas each year from 1960 to 2025, on a scale from zero at the bottom of the stamp to 100% at the top; the dashed line marks half. The big number in the corner is the latest share, like a stamp's face value, and the small number beside it is where the country started in 1960.
Looked at as a sheet, the stamps fall into a few distinct shapes, and those shapes are more interesting than any single number.
Flat along the top
Some stamps are almost entirely filled. Singapore and Hong Kong are city-states: their urban share has been at or near 100% for the whole period. In the Middle East, Kuwait, Bahrain and Qatar (99%) are not far behind, and so are much of Western Europe and the Americas' southern cone: Belgium (88%), the Netherlands, Uruguay, Argentina.
For these countries, the move to the city happened before 1960. Australia was already 82% urban in 1960 and is 88% today; the United Kingdom went from 79% to 83%; Germany from 76% to 82%. Their lines run along the top of the stamp with only a slight rise. In rich countries, urbanisation is largely a finished story.
The steep climbers
The most dramatic stamps are the ones whose lines climb from the bottom-left corner towards the top-right.
Gabon made the biggest jump of any country on the sheet, from 13% urban in 1960 to 92%; today almost all of its people live in towns and cities. Türkiye went from 23% to 89%, and Botswana, one of the least urban countries in the world in 1960, from 3% to 68%. South Korea climbed from 28% to 81% in the decades of its industrial boom, and Brazil from 45% to 88%.
China is the largest example by far. Its urban share rose from 20% in 1960 to 66%, a shift involving hundreds of millions of people, much of it since the economic reforms of the 1980s. Its stamp has a characteristic shape: almost flat for two decades, then a long, steady climb.
| # | Country | 1960 | Latest | Points gained | 1960–2025 |
|---|---|---|---|---|---|
| 1 | Gabon | 13% | 92% | ||
| 2 | Türkiye | 23% | 89% | ||
| 3 | Botswana | 3% | 68% | ||
| 4 | Libya | 23% | 88% | ||
| 5 | Nepal | 4% | 67% | ||
| 6 | Oman | 16% | 79% | ||
| 7 | Angola | 10% | 71% | ||
| 8 | Gambia | 9% | 65% | ||
| 9 | Mauritania | 7% | 61% | ||
| 10 | South Korea | 28% | 81% | ||
| 11 | Saudi Arabia | 31% | 85% | ||
| 12 | Malaysia | 26% | 77% | ||
| 13 | Thailand | 12% | 63% | ||
| 14 | Jordan | 43% | 93% | ||
| 15 | Puerto Rico (US) | 44% | 94% |
Countries with at least 1 million people. Urban as defined by each country.
The slow risers
Many stamps, especially in Sub-Saharan Africa and South Asia, show a line that rises but stays well below the dashed halfway mark.
India's urban share went from 18% in 1960 to 36%. Bangladesh went from 5% to 33%, Pakistan from 22% to 40%, Ethiopia from 7% to 24% and Kenya from 8% to 32%. These are some of the fastest-growing cities in the world in absolute numbers, but the countryside has also kept growing, so the urban share climbs slowly.
At the bottom of the sheet, the least urban countries today are Papua N. Guinea (16%), Malawi (18%) and Niger (18%). In each of them, more than four in five people still live in rural areas.
The giants on the sheet
The stamps for the world's most populous countries tell five different stories.
The United States was already 70% urban in 1960; its line climbs gently to 80%. Russia rose from 54% to 75%, most of it in the Soviet decades. Mexico crossed the halfway mark before 1960 and kept going, from 51% to 80%.
Indonesia and Nigeria are the two big climbers outside China. Indonesia went from 15% to 59%, crossing the halfway line in the 2010s. Nigeria, Africa's most populous country, went from 14% to 64%, and its largest city, Lagos, has grown into one of the biggest urban areas on the continent. South Africa, long the most urban large country in Africa, rose more slowly, from 47% to 64%.
At the other end, Papua New Guinea, one of the most rural countries in the world, went only from 3% to 16%, and Niger from 6% to 18%. In both, most people still live in villages and farm.
Stamps with a kink
Look closely and a few lines don't curve smoothly but jump. Trinidad and Tobago's stamp shoots up through the 1960s and 1970s and then goes flat, ending at 54% after starting at 18% in 1960. Japan's line climbs gently for decades and then jumps by more than ten points between 2000 and 2010, on its way from 63% to 92%.
Sudden jumps like these usually reflect changes in how a country draws its urban boundaries, or in how a census classifies places, rather than overnight migration. When a country reclassifies a group of large villages as towns, or merges rural districts into a city, the urban share can rise in a single year. That is another reason to read each stamp as a country's own story rather than to line them up against each other too precisely.
The ones that barely moved
A few stamps are almost flat at a low level. Sri Lanka's line hardly moves: 18% urban in 1960, 20% today. Egypt has stayed in the low 40s for decades, from 38% to 43%.
Flat lines like these are often a sign of definitions at work rather than of people staying put. If a country's official urban boundaries rarely change, people who move to fast-growing towns and suburbs outside them are still counted as rural, and the urban share barely moves even as the country changes.
The one that went backwards
Only 1 country on the sheet has a lower urban share now than in 1960: Tajikistan. Its line rises during the Soviet era and then sags after independence in 1991 and the civil war that followed, because its rural population has grown faster than its towns and cities.
| # | Country | Urban share | In 1960 |
|---|---|---|---|
| 1 | Papua N. Guinea | 3% | |
| 2 | Malawi | 4% | |
| 3 | Niger | 6% | |
| 4 | Sri Lanka | 18% | |
| 5 | South Sudan | 9% | |
| 6 | Ethiopia | 7% | |
| 7 | Burundi | 2% | |
| 8 | Afghanistan | 8% | |
| 9 | Tajikistan | 33% | |
| 10 | Eswatini | 4% | |
| 11 | Chad | 7% | |
| 12 | Timor-Leste | 10% |
A sheet with different stamp sizes
The stamps make every country look equal, which hides the fact that a few dominate the totals. China and India together hold more than a third of the world's people. The world's urban share is driven mostly by what happens in Asia and Africa, where the slow risers are.
That is why projections focus there. The UN's 2018 projections put the world's urban share at 68% by 2050, with almost all the growth expected in Asia and Africa.
Two ways of counting cities
All the numbers on these stamps come from each country's own definition of what counts as urban, and those definitions differ wildly. India counts a place as urban only if it has at least 5,000 people, a density of at least 400 per square kilometre and at least three-quarters of its working men employed outside farming, which is one reason its urban share looks low. Japan counts people living in a city, a shi, which generally must have 50,000 or more inhabitants, alongside other tests, which helps explain its high 92%. The World Bank warns that cross-country comparisons should be made with caution.
To fix this, the UN's latest World Urbanization Prospects, published in November 2025, uses for the first time a single international method, the Degree of Urbanisation, which classifies every patch of land by its population density. By that measure, 45% of the world's people now live in cities, 36% in towns and only 19% in rural areas. Cities and towns together come to about 81%, far more than the 58% on the national definitions.
The new method also changes the list of the world's largest cities. The UN now ranks Jakarta first, with nearly 42 million people, ahead of Dhaka and Tokyo, and counts 33 megacities of more than 10 million, up from eight in 1975.
The two measures shouldn't be mixed. The stamps here use the national definitions because they go back to 1960 for almost every country; the new method is better for comparing countries today.
How to read a stamp
- Line: the share of the population living in urban areas, 1960 to 2025. Bottom of the stamp is 0%, top is 100%, the dashed line is 50%.
- Big number: the urban share in 2025 (or the latest year).
- Small number: the urban share in 1960.
- Order: stamps are grouped by World Bank region and sorted within each region from most to least urban today.
- Left out: countries and territories with fewer than a million people, to keep the sheet readable. They are in the data file.
The last stamp
In 1960, 37 of the countries on this sheet were majority urban. Today 116 are, and 79 crossed the halfway line along the way. Every few years another stamp's line pushes past the dashed mark, usually somewhere in Africa or Asia, and somewhere a village becomes a town and a town becomes a city. The sheet will need reprinting.
Sources and method
- World Bank, World Development Indicators: Urban population (% of total population), SP.URB.TOTL.IN.ZS, based on UN World Urbanization Prospects. 1960–2025, API updated October 8, 2026
The urban share is the percentage of a country's population living in areas its own national statistics office defines as urban, as compiled by the UN Population Division and published by the World Bank. Definitions differ between countries, so levels are not strictly comparable; changes over time within a country are more reliable. Stamps are grouped by World Bank region and sorted within each region by urban share in the latest year. Economies with fewer than 1 million people are left out to keep the sheet readable; their figures are in the data file.
Charts like this, from your own numbers.
Connect a spreadsheet or the tools you run on, and Parity builds the dashboard and writes the report, with every number checked.
Try Parity free