Charts like this, from your own numbers.
Connect a spreadsheet or the tools you run on, and Parity builds the dashboard and writes the report, with every number checked.
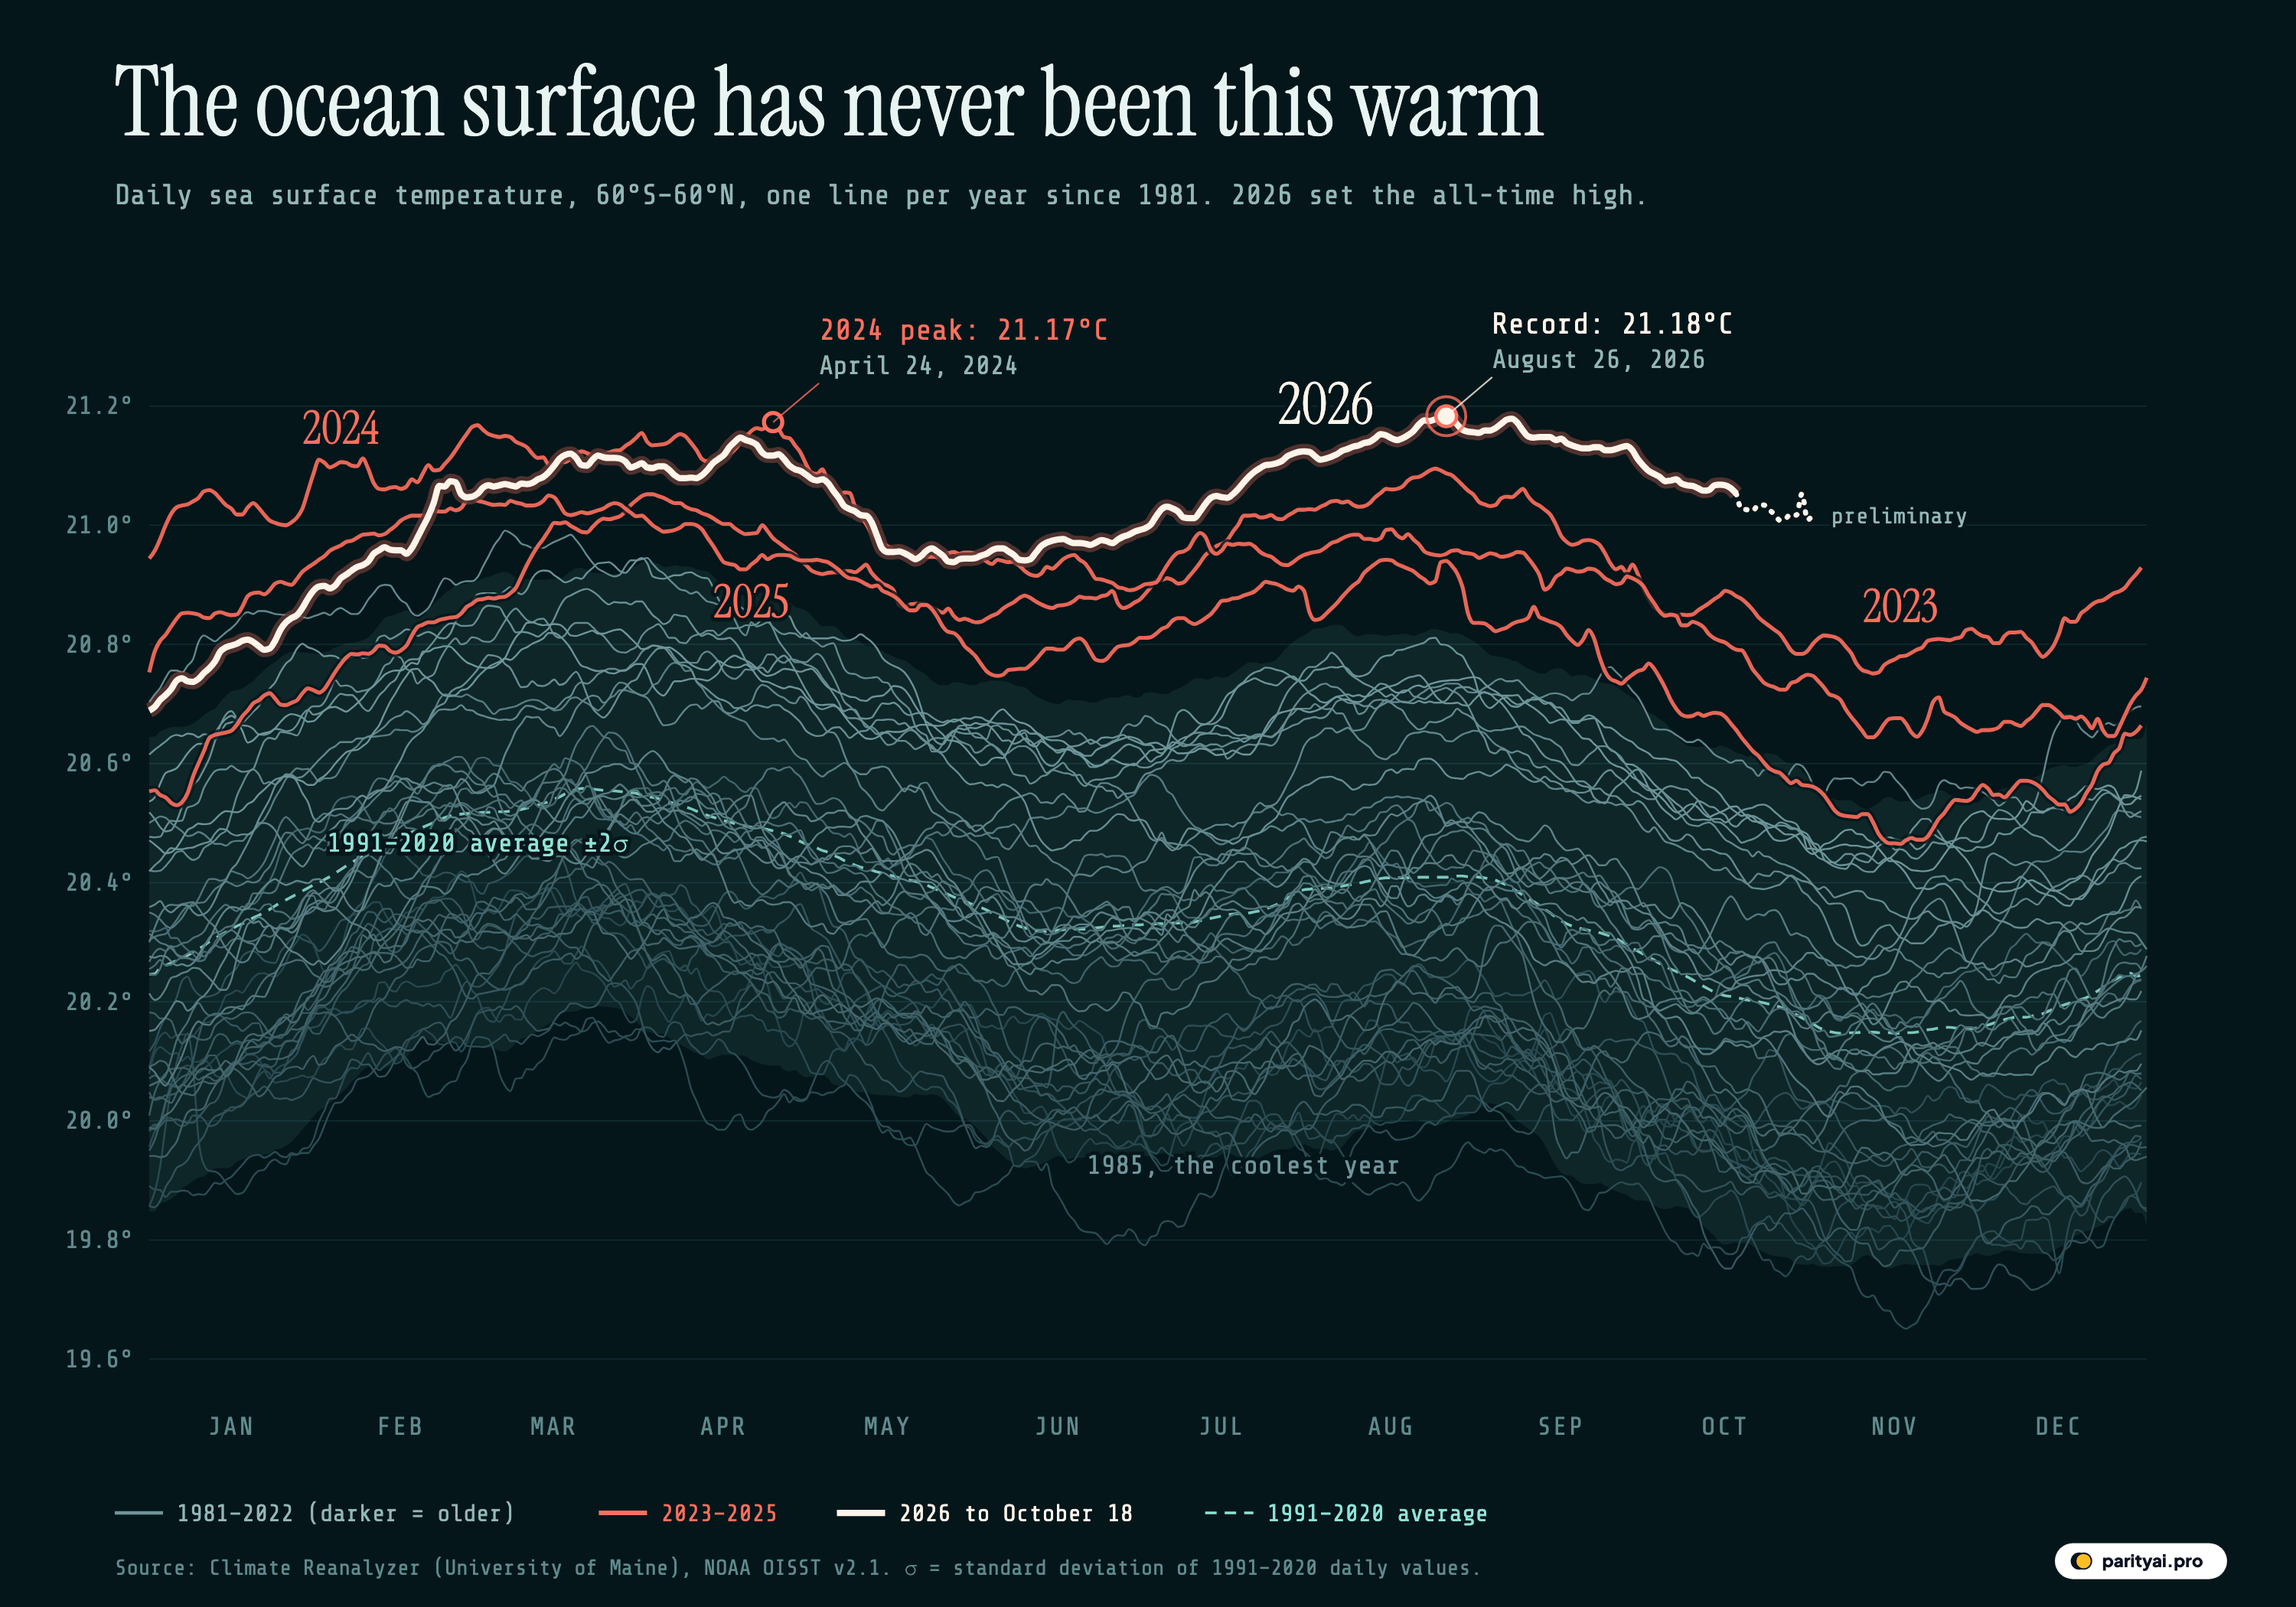
Try Parity freeOn August 26, 2026, the ocean between 60°S and 60°N averaged 21.18°C at its surface. That is the highest daily value in NOAA's satellite-and-buoy record, which begins on September 1, 1981. It beat the previous high, 21.17°C on April 24, 2024, by about a hundredth of a degree. A hundredth sounds like nothing until you remember what is being averaged: the surface of most of the world's ocean, every square kilometre of it, on one day.
The graphic above draws that record as 46 lines, one per year, each running from January on the left to December on the right. The grey lines are 1981 to 2022, darker for older years. The coral lines are 2023, 2024 and 2025, and the thick white line is 2026, with a dotted tail for days that are still preliminary. The dashed teal line is the average for each day of the year over 1991–2020, and the faint band around it covers two standard deviations either side, the range that roughly 95% of days in a stable climate would fall inside. Everything above that band is warmer than the old normal by a wide margin, and the four highlighted years sit there most of the time.
A chart like this has its own vocabulary, and most of the words get used loosely. So the rest of this piece is a short glossary, in alphabetical order. Each entry defines one term and then uses it to read part of the record.
Anomaly
An anomaly is a departure from an expected value. For sea surface temperature, the expected value is the long-term average for that day of the year, so an anomaly of +0.5°C on 1 March means the ocean was half a degree warmer than a typical 1 March.
Averaged over whole years, the anomalies in this record run from −0.43°C in 1985, the coolest full year, to +0.59°C in 2024, the warmest. 2023 comes second at +0.54°C and 2025 third at +0.47°C. Before 2023 the best a year had managed was +0.33°C in 2020, with 2016 just behind at +0.32°C. Then 2023 finished 0.24°C above 2022, the largest single step from one year to the next in the record.
| # | Year | vs 1991–2020 (°C) | Mean (°C) | Warmest day (°C) | Days above +2σ | Records at the time |
|---|---|---|---|---|---|---|
| 1 | 2024 | 20.94 | 21.17 | 366 | 199 | |
| 2 | 2023 | 20.89 | 21.09 | 297 | 294 | |
| 3 | 2025 | 20.82 | 21.05 | 304 | 0 | |
| 4 | 2020 | 20.68 | 20.95 | 25 | 103 | |
| 5 | 2016 | 20.67 | 20.99 | 89 | 222 | |
| 6 | 2019 | 20.65 | 20.89 | 0 | 54 | |
| 7 | 2022 | 20.65 | 20.84 | 0 | 15 | |
| 8 | 2015 | 20.65 | 20.80 | 61 | 321 | |
| 9 | 2021 | 20.63 | 20.82 | 0 | 11 | |
| 10 | 2017 | 20.61 | 20.86 | 0 | 34 | |
| 11 | 2018 | 20.57 | 20.79 | 0 | 0 | |
| 12 | 2014 | 20.53 | 20.74 | 0 | 212 |
Full years 1982–2025, ranked by mean departure from the 1991–2020 daily baseline. 2026 to October 18, 2026: +0.63°C. 'Records at the time' = days warmer than the same day in every earlier year.
Baseline
The baseline is the period that defines "normal". Climate Reanalyzer's sea surface temperature page computes anomalies as "daily temperature minus 1991–2020 climatology for the same calendar date", and this graphic does the same.
The choice matters. The file also carries an older 1982–2010 average, and the newer baseline is 0.16°C warmer on an average day, because the ocean warmed between the two periods. Measured against 1982–2010, 2024 was +0.74°C above normal and 2026 so far is +0.79°C. Same ocean, different yardstick. When two reports disagree about how much warmer the sea is, check the baseline first.
The baseline is not flat across the year either. On the 1991–2020 average the 60°S–60°N ocean peaks at 20.56°C around March 21 and bottoms out at 20.15°C around November 6, which is why every line on the chart sags through the second half of the year.
Calendar-day record
A calendar-day record is the highest value ever measured for one day of the year: the warmest 14 February, the warmest 9 July, and so on. There are 366 of them in this dataset, counting the leap-day slot.
All 366 now belong to three years. 2026 holds 152, 2024 holds 140 and 2023 holds 74. No year before 2023 holds a single one, and neither does 2025, despite being the third-warmest year in the record. On 5 days 2024 and 2026 are tied to the thousandth of a degree; this count gives those to 2024, because a record only changes hands when it is beaten.
The table below shows how the records split by season. 2024 owns most of the early months, when it was still riding the end of an El Niño. 2026 owns June through mid-October, apart from a couple of June days. 2023 holds the end of the year, from mid-October to December, the days 2026 hasn't reached yet.
| Month | Most records | 2023 | 2024 | 2026 | Any other year |
|---|---|---|---|---|---|
| January | 2024 | 0 | 31 | 0 | 0 |
| February | 2024 | 0 | 28 | 0 | 0 |
| March | 2024 | 0 | 28 | 3 | 0 |
| April | 2024 | 0 | 27 | 3 | 0 |
| May | 2024 | 0 | 23 | 8 | 0 |
| June | 2026 | 0 | 2 | 28 | 0 |
| July | 2026 | 0 | 0 | 31 | 0 |
| August | 2026 | 0 | 0 | 31 | 0 |
| September | 2026 | 0 | 0 | 30 | 0 |
| October | 2026 | 13 | 0 | 18 | 0 |
| November | 2023 | 30 | 0 | 0 | 0 |
| December | 2023 | 31 | 0 | 0 | 0 |
Calendar days 1–365 grouped by month (the leap-day slot is left out). Finalised data to October 18, 2026.
El Niño
El Niño is the warm phase of a cycle in the tropical Pacific, when the central and eastern equatorial ocean runs warmer than usual. It moves heat around and lifts the global average for a while.
The thick lines line up with it. NOAA's Climate Prediction Center declared El Niño conditions on 8 June 2023 and issued its final El Niño advisory on 13 June 2024. By January 2025 it had declared La Niña, the cool phase, and 2025 is the lowest of the four highlighted lines for most of the year. Even so, it never dipped to the 1991–2020 average on a single day.
A new event started this year. The Climate Prediction Center declared El Niño again on 11 June 2026, and its latest discussion, from 8 October, says a strong-to-very-strong El Niño is likely through January–March 2027. The Copernicus Climate Change Service reported that the monthly temperature in the Niño 3.4 region hit an all-time high in September.
ERA5
ERA5 is the reanalysis run by the European Centre for Medium-Range Weather Forecasts for the Copernicus Climate Change Service (C3S). It is the other dataset you will see quoted for ocean records, and its numbers are not the same as the ones on this chart.
C3S says ERA5 sea temperatures are estimates for "about 10m depth" and that results "may differ" from products describing other depths. In ERA5 the 2026 record was 21.1°C on 22 August, against 21.09°C in March 2024. The chart here shows 21.18°C on August 26, 2026. For whole years, C3S put 2024 at 20.87°C and 2025 at 20.73°C, third warmest. The OISST figures used here are 20.94°C and 20.82°C. The levels differ, the ranking agrees, and both datasets put the 2026 peak above the 2024 one.
Heat uptake
The sea surface is the visible skin of a much larger store of heat. A 2024 study led by Till Kuhlbrodt at the University of Reading describes "more than 90% of the excess energy" that Earth accumulates going into the oceans. The surface temperature is a small, fast-moving part of that, and the part this chart can see.
Marine heatwave
A marine heatwave has a formal definition, set out by Alistair Hobday and colleagues in 2016: a warm event lasting five or more days, with temperatures above the 90th percentile of a 30-year baseline. It is a local measure, judged grid cell by grid cell, so a global average like this one can't show heatwaves directly. It shows the background they build on.
When that background is high, they spread. The World Meteorological Organization reported that on an average day in 2023 nearly a third of the global ocean was in a marine heatwave. Coral reefs took the damage. NOAA confirmed the fourth global coral bleaching event on 15 April 2024 and now reports that bleaching-level heat stress reached 84% of the world's reef area between early 2023 and mid-2025, with mass bleaching in at least 83 countries and territories.
OISST
OISST stands for Optimum Interpolation Sea Surface Temperature, the dataset every line on the chart comes from. NOAA's National Centers for Environmental Information average a day of satellite observations onto a quarter-degree grid and blend them with measurements from ships, buoys and Argo floats, which help correct satellite biases. Version 2.1 replaced version 2 in April 2020, and the series starts on 1 September 1981. That is why the 1981 line on the chart begins in September.
Climate Reanalyzer averages the grid over the ocean between 60°S and 60°N, the "World" domain on its page. That leaves out the polar seas.
Preliminary
Recent OISST days are provisional. Climate Reanalyzer notes that the data are "preliminary for two weeks" until NOAA posts the final product. The file used here holds finalised values to October 18, 2026 and 14 preliminary days after that, up to November 1, 2026. They are drawn as the dotted tail on the 2026 line and left out of every count in this piece. On average those preliminary days sit +0.83°C above the baseline, close to the +0.85°C of the last finalised day.
Record run
A record "at the time" is a day warmer than the same day in every earlier year, whether or not a later year has since beaten it. It answers a different question from the calendar-day record: not who holds the record now, but how often a year was setting one.
By that measure 2023 set 294 records and 2024 set 199. The two years together produced the longest unbroken run in the series: every day from March 13, 2023 to July 2, 2024, 478 days in a row, was the warmest of its date so far. Early years set records cheaply, with little history to beat: 1982 alone has 320. Later, 2015 set 321 and 2016 set 222, but neither strung together anything like the 2023–2024 run. 2025 set 0. 2026 has set 152 so far, and since nothing has come after it, every one of those still stands.
Sigma
Sigma (σ) is the standard deviation: how much the value for a given day normally varies from year to year. Over 1991–2020 it ranges from 0.17°C to 0.22°C depending on the time of year. Two sigma above the average is the top edge of the faint band on the chart. In a stable climate, a day should land above it about one time in forty.
Before 2023 that happened on 175 days in total, in just three years: 2015 (61), 2016 (89), 2020 (25). Then 2023 had 297, starting on March 10, 2023. 2024 spent all 366 days above the band. 2025, the La Niña year, still managed 304, and every one of the 291 finalised days of 2026 has been above it. The unbroken stretch that ends on the latest finalised day is 295 days long. On October 18, 2026 the ocean was +0.85°C above its average for the date, about 4.1 standard deviations. The band is a 1991–2020 band, and the ocean has climbed out of it.
Trend
The trend is the slow part under the year-to-year wobble. Fitting a straight line through the full-year anomalies from 1982 to 2025 gives a rise of about 0.19°C per decade. Decade averages show the same thing more plainly: 20.05°C for 1982–1989, 20.52°C for the 2010s and 20.77°C for 2020–2025, a gain of 0.71°C.
There is a quieter sign in the data too. The last day the ocean surface was cooler than its 1991–2020 average for the date was July 5, 2013. Every day in the more than thirteen years since has been above the line.
Twenty-one degrees
The 21°C gridline has no physical meaning, but it shows the change clearly. The warmest day of 1982 was 20.27°C. Before 2023 no day had ever reached 21°C; the closest was 20.99°C on March 6, 2016. The years that have crossed it are 2023, 2024, 2025, 2026. 2023 spent 88 days at or above 21°C, 2024 spent 129, 2025 spent 50, and 2026 has already spent 190, more than any full year, with two and a half months still to report. The coolest day of 2026 so far was 20.69°C, warmer than the warmest day of any year before 2010 on this chart.
Unexplained warmth
Not all of the 2023 jump has an agreed cause. A study by Helge Goessling, Thomas Rackow and Thomas Jung in Science weighed El Niño, long-term greenhouse warming, solar activity, water vapour from a volcanic eruption and cleaner marine fuel, and the Alfred Wegener Institute's summary says that even combined, "there is still 0.2 degrees Celsius of warming with no readily apparent cause". The authors point to planetary albedo, which may have been at its lowest since at least 1940 that year, meaning Earth reflected less sunlight. That is one research group's explanation, not a settled one, and this chart can't test it. What the chart does show is that the warmth did not go away when El Niño did.
Year to date
Year to date means the average from 1 January to the latest day with data, compared with the same days of other years. It is the fair way to place a year that isn't finished.
For 1 January to October 18, 2026 is +0.63°C above the 1991–2020 average. The same days of 2024 were +0.61°C, 2023 +0.51°C and 2025 +0.49°C. That makes 2026 first of every year in the record for this stretch, just ahead of 2024. It got there late. In January 2026 the ocean was +0.46°C above average against +0.70°C in January 2024. By August it was +0.74°C, ahead of 2023's +0.65°C, and in September +0.80°C against +0.65°C. C3S, using ERA5, also called September 2026 a record "by a significant margin".
| Year | Jan–Dec | Jan | Apr | Jul | Sep | Jan 1–October 18 |
|---|---|---|---|---|---|---|
| 2015 | +0.19 | +0.26 | +0.28 | +0.38 | ▲ 0.27 | |
| 2016 | +0.49 | +0.36 | +0.30 | +0.28 | ▲ 0.35 | |
| 2020 | +0.37 | +0.37 | +0.35 | +0.33 | ▲ 0.35 | |
| 2022 | +0.32 | +0.25 | +0.29 | +0.32 | ▲ 0.29 | |
| 2023 | +0.32 | +0.50 | +0.62 | +0.65 | ▲ 0.51 | |
| 2024 | +0.70 | +0.63 | +0.60 | +0.58 | ▲ 0.61 | |
| 2025 | +0.54 | +0.46 | +0.52 | +0.46 | ▲ 0.49 | |
| 2026 | +0.46 | +0.60 | +0.71 | +0.80 | ▲ 0.63 |
Monthly means of daily departures, °C. The last column compares the same 291 days of every year. October 2026 is partial and not shown.
Three caveats before reading 2026's year-to-date figure as final. First, it covers only 291 days, and the months still to come are the ones where 2023 holds the records. Second, the dataset covers 60°S to 60°N, not the whole ocean, and it uses a day-of-year index, so leap years slip a day against the calendar after February. Third, ERA5 and OISST measure slightly different things and will not agree to the hundredth of a degree, so a margin this thin could look different in another dataset.
Zero
The last entry is the one the chart no longer has. Zero is the anomaly line, the value a normal day would have. In the daily data, every year from 1982 to 2013 had at least some days on the cool side of it. The highlighted lines never touch it. 2026 has not had a single day at or below normal, and the Pacific forecast points the same way for the winter.
Low in the grey mass, the labelled 1985 line runs along the bottom of the bundle, under 20°C for most of the year. Up top, 2026's preliminary tail ends at about 21°C at the start of November, the time of year when the 1991–2020 average is near its lowest. Forty-five years separate the two, and the bundle between them has moved up the whole way.
Sources and method
- Climate Reanalyzer, Climate Change Institute, University of Maine: daily world sea surface temperature (60°S–60°N) from NOAA OISST v2.1. JSON series oisst2.1_world2_sst_day.json, September 1, 1981 to the latest finalised day plus about two weeks of preliminary values; retrieved November 4, 2026
- NOAA National Centers for Environmental Information: Optimum Interpolation Sea Surface Temperature (OISST) v2.1. Dataset description
Values are daily area-weighted mean sea surface temperatures for the ocean between 60°S and 60°N from NOAA's OISST v2.1, as published by Climate Reanalyzer. Each year's values are indexed by day of year, as Climate Reanalyzer publishes them, so after February 28 leap years are offset by one calendar day. The baseline is the 1991–2020 mean for each day of year (Climate Reanalyzer's climatology); the ±2σ band uses the standard deviation of the 30 yearly values for that day over the same years. Annual means use full years only (1982–2025). A calendar day's 'record' belongs to the year with the highest value for that day of year across 1981–2026, using finalised values only. 'Set a record at the time' means warmer than every earlier year on that day. The last two weeks of the series are preliminary and are drawn dotted and left out of counts. 2026 runs only to the latest finalised day, so its averages are compared with the same days of earlier years.
Charts like this, from your own numbers.
Connect a spreadsheet or the tools you run on, and Parity builds the dashboard and writes the report, with every number checked.
Try Parity free

