Charts like this, from your own numbers.
Connect a spreadsheet or the tools you run on, and Parity builds the dashboard and writes the report, with every number checked.
Try Parity freeIn 1930 John Maynard Keynes guessed that his grandchildren's generation would need to work so little that the main problem would be spreading the work around. "Three-hour shifts or a fifteen-hour week may put off the problem for a great while," he wrote in Economic Possibilities for our Grandchildren. His grandchildren are now retired. The average person with a job in the OECD's 38 member countries worked 1,736 hours in 2025, according to the OECD's series on hours actually worked. Spread across all 52 weeks of the year, holidays included, that is 33.4 hours a week. Keynes was off by more than double.
He was right about the direction, though, and a great deal of what people say about working time today is less right than that. Talk about work hours runs on beliefs: that we work more than our parents did, that Americans or Japanese work the most, that Germans are always at their desks, that short hours just mean part-time jobs. The OECD data can test each of these, and that is what this piece does, one belief at a time.
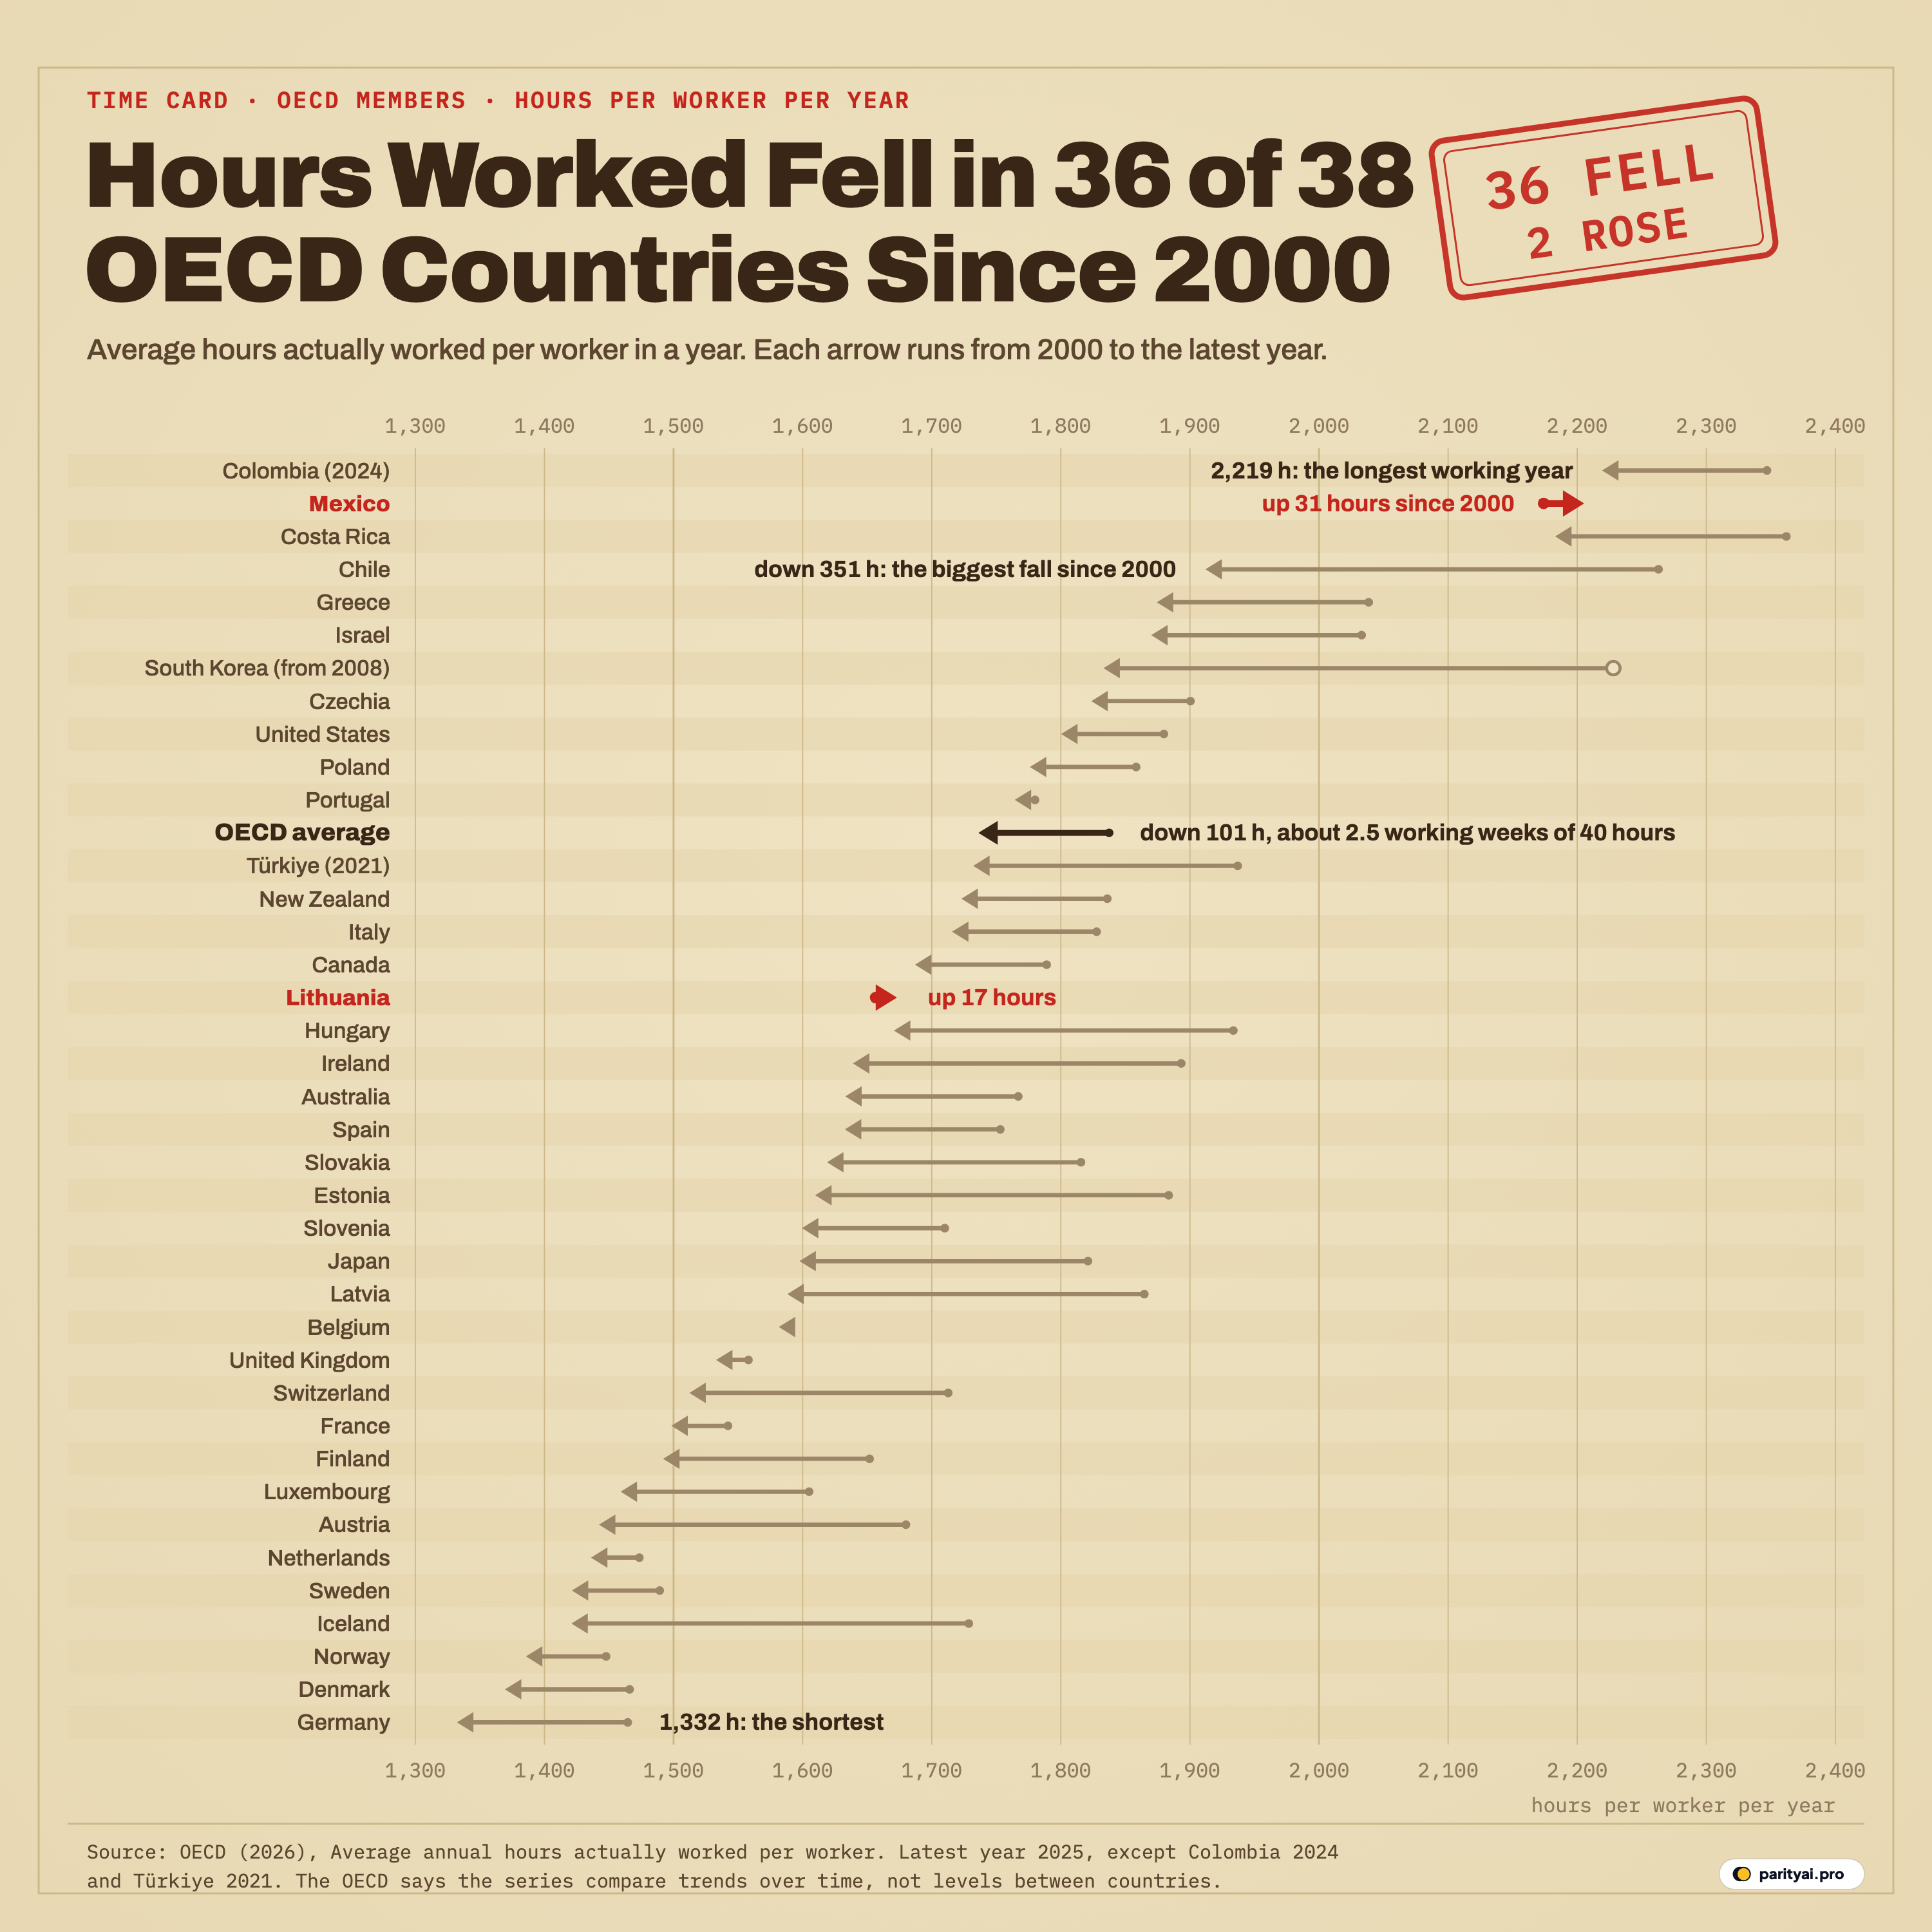
The graphic is built for that test. It is laid out like a time card. Each row is one OECD member country, sorted from the longest working year at the top to the shortest at the bottom. The arrow in each row starts at the country's average hours per worker in 2000 (the dot) and ends at its latest value (the arrowhead), which is 2025 for 36 countries. An arrow pointing left means people in work now put in fewer hours a year than at the start of the century. The two red arrows point the other way.
Wrong almost everywhere: the working year got shorter
The belief: we work longer than we used to. Phones follow us home, the office never closes, and everyone seems busier.
The data say the working year shrank in 36 of the 38 OECD countries. Across the OECD as a whole, average annual hours per worker fell from 1,837 in 2000 to 1,736 in 2025, a drop of 101 hours, or 5.5%. That is about 2.5 full weeks of 40 hours, or roughly 13 eight-hour days, taken off every worker's year.
Some of the falls are large. Chile's working year shrank by 351 hours, from 2,263 to 1,912, the biggest fall of any country with data back to 2000. Iceland fell by 308, Latvia by 277 and Estonia by 274. In all, 11 countries cut at least 200 hours. South Korea, whose series in the current OECD release only starts in 2008, fell by 395 hours from 2,228 to 1,833 in those seventeen years, a steeper drop than Chile's in less time.
Other falls are small enough to call flat. Portugal, Belgium, United Kingdom, France, Netherlands each lost fewer than 50 hours. Belgium's arrow is barely visible: 1,589 hours in 2000, 1,586 in 2025.
And then there are the two red arrows. In Mexico the average worker put in 2,174 hours in 2000 and 2,205 in 2025, 31 more. In Lithuania hours rose by 17, from 1,657 to 1,673. These are the only two members where the working year is longer now than in 2000. So the belief fails in 36 countries and holds, modestly, in 2.
The feeling of being busier may still be real. The data measure hours, not intensity, stress or how often someone checks email at dinner. But on the clock, the working year is shorter.
| # | Country | Start | Latest | Change (hours) | Path |
|---|---|---|---|---|---|
| 1 | Colombia | 2,347 | ▼ 128 | ||
| 2 | Mexico | 2,174 | 31 | ||
| 3 | Costa Rica | 2,362 | ▼ 179 | ||
| 4 | Chile | 2,263 | ▼ 351 | ||
| 5 | Greece | 2,038 | ▼ 164 | ||
| 6 | Israel | 2,033 | ▼ 163 | ||
| 7 | South Korea | 2,228 (2008) | ▼ 395 | ||
| 8 | Czechia | 1,900 | ▼ 77 | ||
| 9 | United States | 1,880 | ▼ 80 | ||
| 10 | Poland | 1,858 | ▼ 82 | ||
| 11 | Portugal | 1,780 | ▼ 16 | ||
| 12 | Türkiye | 1,937 | ▼ 205 | ||
| 13 | New Zealand | 1,836 | ▼ 113 | ||
| 14 | Italy | 1,828 | ▼ 112 | ||
| 15 | Canada | 1,789 | ▼ 102 | ||
| 16 | Lithuania | 1,657 | 17 | ||
| 17 | Hungary | 1,934 | ▼ 263 | ||
| 18 | Ireland | 1,893 | ▼ 254 | ||
| 19 | Australia | 1,767 | ▼ 134 | ||
| 20 | Spain | 1,753 | ▼ 120 | ||
| 21 | Slovakia | 1,816 | ▼ 197 | ||
| 22 | Estonia | 1,884 | ▼ 274 | ||
| 23 | Slovenia | 1,710 | ▼ 111 | ||
| 24 | Japan | 1,821 | ▼ 223 | ||
| 25 | Latvia | 1,865 | ▼ 277 | ||
| 26 | Belgium | 1,589 | ▼ 3 | ||
| 27 | United Kingdom | 1,558 | ▼ 25 | ||
| 28 | Switzerland | 1,713 | ▼ 200 | ||
| 29 | France | 1,542 | ▼ 44 | ||
| 30 | Finland | 1,652 | ▼ 160 | ||
| 31 | Luxembourg | 1,605 | ▼ 146 | ||
| 32 | Austria | 1,680 | ▼ 238 | ||
| 33 | Netherlands | 1,474 | ▼ 37 | ||
| 34 | Sweden | 1,489 | ▼ 68 | ||
| 35 | Iceland | 1,729 | ▼ 308 | ||
| 36 | Norway | 1,448 | ▼ 62 | ||
| 37 | Denmark | 1,466 | ▼ 97 | ||
| 38 | Germany | 1,465 | ▼ 132 |
Average annual hours actually worked per person in employment. Start is 2000 except South Korea (2008); latest is 2025 except Colombia (2024) and Türkiye (2021). Change is latest minus start; a negative number means fewer hours. The OECD says these series compare trends, not levels, across countries.
Half right: the longest years are in Latin America, not Tokyo or New York
The belief: the hardest-working countries are the United States and Japan, the homes of the 80-hour banker and the salaryman.
On the time card the top four rows belong to Latin America. Colombia recorded 2,219 hours per worker in 2024, Mexico 2,205 and Costa Rica 2,183, with Chile fourth at 1,912. Colombia's figure works out to 42.7 hours a week across all 52 weeks. The first European country is Greece, fifth at 1,874, then Israel at 1,870.
The United States is 9th at 1,800 hours, down 80 since 2000. That is long by rich-country standards: 468 hours more than Germany, about 12 extra 40-hour weeks a year. But it is not the top of the list.
Japan is further down than its reputation, 24th of 38 at 1,598 hours, 203 below the United States. Japan's year shrank by 223 hours since 2000. In 2018 the country set a legal ceiling on overtime, 45 hours a month and 360 hours a year in principle, applying to large firms from April 2019 and smaller ones from April 2020. Its part-time share also climbed, from 16% of workers in 2000 to 26%, which pulls the per-worker average down whether or not the full-timers in the office tower work any less.
So the belief is half right. The United States does work long hours for a rich country. Japan no longer stands out. And the longest working years in the OECD are in Colombia, Mexico, Costa Rica and Chile, which are not usually what people picture when they say "workaholic".
One warning belongs here, and it is the OECD's own. The organisation says these series "are unsuitable for comparisons of the level of average annual hours of work for a given year, because of differences in their sources" (dataset notes). Some countries build the figure from national accounts, others from labour force surveys. A gap of 20 or 30 hours between two neighbours on the chart means little. A gap of 887 hours between Colombia and Germany, about 22 weeks of 40 hours, is too large to be only a matter of method, but the exact ranking should be read loosely. The arrows, each comparing a country with itself, are on firmer ground than the order of the rows.
Backwards: Germany's working year is the shortest on the card
The belief: Germans work long and hard; the country's industrial success is built on time at the bench.
Germany is the bottom row. The average German in work put in 1,332 hours in 2025, the fewest in the OECD and 132 fewer than in 2000. Spread over 52 weeks that is 25.6 hours a week. Close behind are Denmark at 1,369 and Norway at 1,386. The short-hours end of the card is a run of northern European countries: the Netherlands, Sweden, Iceland, Norway, Denmark and Germany.
Whatever explains German output, it isn't the number of hours each worker logs in a year. That doesn't make Germans idle. A working year can be short because full-timers have shorter weeks or longer holidays, or because many people work part-time, or both. Germany's part-time share, under the OECD's harmonised definition of fewer than 30 usual hours a week in the main job, rose from 18% in 2000 to 23% in 2025.
Only partly true: short years aren't simply part-time jobs
The belief: countries with short working years just have lots of part-timers; full-time workers everywhere put in about the same.
Part-time work clearly matters. Across the OECD the part-time share rose from 14% to 17% between 2000 and 2025, and it went up in 21 of the 34 members with figures for both years. More people working shorter weeks pulls down hours per worker even if no full-timer's schedule changes.
But part-time work doesn't line up neatly with the time card. The Netherlands has by far the largest part-time share in the OECD, 35% of workers, yet it is 33rd of 38 on hours, not last. Its working year fell by only 37 hours since 2000, and its part-time share was already 32% then. Japan is second on part-time at 26% but sits 24th on hours, in the lower half of the card rather than at the bottom. Austria's part-time share went from 12% to 21% and its hours fell by 238, while Iceland cut 308 hours as its part-time share went down, from 20% to 17%.
Lithuania is the counterexample from the other side. Its part-time share fell from 11% in 2000 to 4% in 2025, one of the lowest in the OECD, and it is one of only two countries where hours per worker rose. The data show the two moved together; they can't show that one caused the other.
| Country | Hours per worker | Part-time share | Part-time share vs 2000 (points) |
|---|---|---|---|
| Germany | 1,332 | 5.2 | |
| Denmark | 1,369 | 3.5 | |
| Norway | 1,386 | ▼ 0.4 | |
| Iceland | 1,421 | ▼ 2.8 | |
| Sweden | 1,421 | ▼ 2.4 | |
| Netherlands | 1,436 | 3.1 | |
| Austria | 1,442 | 9.7 | |
| Luxembourg | 1,459 | ▼ 0.6 | |
| Finland | 1,492 | 5.5 | |
| France | 1,498 | ▼ 0.8 | |
| Switzerland | 1,512 | 2.5 | |
| United Kingdom | 1,533 | ▼ 1.4 | |
| Belgium | 1,586 | ▼ 0.2 | |
| Latvia | 1,588 | ▼ 2.4 | |
| Japan | 1,598 | 10.2 | |
| Slovenia | 1,599 | 1.9 | |
| Estonia | 1,610 | 4 | |
| Slovakia | 1,619 | 2.2 | |
| Spain | 1,633 | 4.2 | |
| Australia | 1,633 | ||
| Ireland | 1,639 | 1.8 | |
| Hungary | 1,671 | 1.4 | |
| Lithuania | 1,673 | ▼ 6.3 | |
| Canada | 1,687 | 0.1 | |
| Italy | 1,716 | 3.8 | |
| New Zealand | 1,723 | ▼ 1.9 | |
| Türkiye | 1,732 | 3.9 | |
| Portugal | 1,764 | ▼ 3.9 | |
| Poland | 1,776 | ▼ 7.5 | |
| Czechia | 1,824 | 4 | |
| South Korea | 1,833 | 10 | |
| Israel | 1,870 | ▼ 1.7 | |
| Greece | 1,874 | 1.2 | |
| Chile | 1,912 | 12.4 | |
| Costa Rica | 2,183 | ||
| Mexico | 2,205 | 4.2 | |
| Colombia | 2,219 |
Part-time share of employment in the latest year (2025 for most), OECD harmonised definition: people usually working under 30 hours a week in their main job. Sorted from the shortest working year to the longest. The United States has no harmonised figure; several countries have no 2000 value.
Mixed record: laws move the line, but slowly and not alone
The belief: governments can't legislate shorter hours; work finds its own level.
Several countries on the card changed the law during this period, and the record is mixed. France introduced the 35-hour week from 1 February 2000 for firms with more than 20 employees, and from January 2002 for smaller ones. The chart's starting year is the year that law took effect, and France's arrow is one of the short ones: 1,542 hours in 2000, 1,498 in 2025, a fall of 44.
South Korea cut its legal maximum working week from 68 to 52 hours in 2018, starting with large firms. Its arrow, from 2008, is the longest on the card. The data cannot split how much of that came from the law and how much from other changes, such as more part-time work (Korea's part-time share rose from 7% in 2000 to 17% in 2025).
The Latin American members are in the middle of their own changes, which mostly came after the last year on this chart. Chile's Ley 21.561 lowered the legal week to 44 hours in April 2024 and to 42 in April 2026, with 40 due in April 2028. Colombia's Law 2101 of 2021 was designed to cut the week from 48 to 42 hours in steps that ended in mid-July 2026. Mexico's reform, in force from 1 May 2026, keeps the 48-hour week for 2026 and then removes two hours a year until it reaches 40 in 2030, without cutting pay.
Iceland tried it out first. From 2015 to 2019 it ran two large trials of a 35- to 36-hour week with no cut in pay; the analysis covered 2,500 workers, and the researchers report that 86% of the workforce has since moved to shorter hours or gained the right to. Iceland's working year fell by 308 hours between 2000 and 2025, from 1,729 to 1,421, the second-largest fall among countries with data back to 2000.
Mostly true: the pandemic left a mark that hasn't fully faded
The belief: Covid changed work for good.
In 2020 hours per worker fell in all 38 OECD countries; the OECD average dropped from 1,766 hours in 2019 to 1,687. The working year didn't fully bounce back. Of the 36 countries with 2025 data, 31 still recorded fewer hours per worker in 2025 than in 2019. Colombia, whose latest year is 2024, also sits below its 2019 level, 2,219 against 2,383.
The pandemic didn't start the decline. By 2019, 35 of the 38 countries were already below their starting level; the exceptions were Colombia, Mexico and Lithuania. The pandemic added a step down that has mostly stuck. The sparklines in the first table show each country's path.
Reading the card with care
Three things about this measure can change what it seems to say.
Levels across countries. As above, the OECD built these series to track change over time within a country. Treat the rank order as approximate and the arrows as the main finding.
Part-time work. Hours per worker average full-timers and part-timers together. A country where many people take short part-time jobs will show a short working year even if its full-timers work long weeks. A rise in part-time work can make the arrow point left with no change in anyone's full-time schedule.
Self-employment. The headline series counts everyone in work: employees, the self-employed and family workers. Where self-employment is common, and self-employed people work long or very short hours, the average shifts. The table below sets the all-worker figure beside the figure for employees only. In 11 of the 37 members with both series, employees work longer than the average worker. In others the self-employed raise the average: Greece's all-worker figure, 1,874, is 196 hours above its employees' 1,679, and Switzerland's is 176 above.
Mexico is the most interesting case. Its all-worker figure rose by 31 hours since 2000, but Mexican employees' hours fell, from 2,360 to 2,299, a drop of 61. So one of the two red arrows on the card points right not because employees work longer, but because of changes outside regular employment or in the mix of workers. In Mexico employees work longer than the average worker, so a rising share of employees alone would lift the average.
| Country | All workers | Employees only | Employees minus all |
|---|---|---|---|
| Colombia | 2,219 | 2,186 | ▼ 33 |
| Mexico | 2,205 | 2,299 | 94 |
| Costa Rica | 2,183 | 2,269 | 86 |
| Chile | 1,912 | 1,993 | 81 |
| Greece | 1,874 | 1,679 | ▼ 196 |
| South Korea | 1,833 | 1,846 | 13 |
| United States | 1,800 | 1,814 | 14 |
| Poland | 1,776 | 1,682 | ▼ 94 |
| Italy | 1,716 | 1,631 | ▼ 85 |
| Japan | 1,598 | 1,614 | 16 |
| United Kingdom | 1,533 | 1,519 | ▼ 14 |
| Switzerland | 1,512 | 1,336 | ▼ 176 |
| France | 1,498 | 1,393 | ▼ 106 |
| Netherlands | 1,436 | 1,352 | ▼ 84 |
| Germany | 1,332 | 1,298 | ▼ 34 |
Latest year. All workers includes the self-employed and family workers; employees are people working for an employer. A positive gap means employees work longer than the average worker.
Two smaller notes. South Korea's arrow starts in 2008 because that is where its series in this release begins, and the latest values for Colombia (2024) and Türkiye (2021) are older than the rest. The file the OECD publishes also includes some non-members, such as Peru and Croatia, which are left off the card.
The next arrow
Keynes's fifteen-hour week is still a long way off. The OECD average of 1,736 hours is about twice what his "three-hour shifts" would add up to over a year. The more useful lesson from the time card is about direction. Across a quarter of a century and 38 countries with very different laws, industries and habits, the working year got shorter almost everywhere, by 101 hours on average.
The two exceptions are the ones to watch. Mexico has written a 40-hour week into law, to arrive in two-hour steps by 2030. Colombia finished its cut to 42 hours in 2026, and Chile reaches 40 in 2028. If those laws work as written, the top of the card, where the longest working years are, should start moving left over the next few releases. The OECD will publish those numbers.
Sources and method
- OECD (2026), Average annual hours actually worked per worker (DSD_HW@DF_AVG_ANN_HRS_WKD), OECD Data Explorer. Total employment and employees, 2000 to 2025, retrieved through the OECD SDMX API on November 10, 2026. OECD terms: Data may be used, adapted and distributed for any purpose, including commercial use, with credit to the OECD.
- OECD (2026), Incidence of full-time and part-time employment based on OECD-harmonized definition (DSD_FTPT@DF_FTPT_COMMON_INC), OECD Data Explorer. Part-time share of employment, all ages, retrieved November 10, 2026.
- OECD Terms and Conditions (section 3, Data)
Hours are the OECD's average annual hours actually worked per person in employment: total hours worked in the year divided by the average number of people in work, covering full-time and part-time workers and, unless shown otherwise, the self-employed. The OECD builds each country's series from national accounts or labour force surveys and says the series are meant for comparing trends over time, not levels between countries, because the sources differ. Each arrow runs from 2000 to the latest year available: 2025 for 36 countries, 2024 for Colombia and 2021 for Türkiye. South Korea's series in this release starts in 2008, so its arrow starts there and it is counted with the countries where hours fell. The OECD average is the OECD's own aggregate. Part-time shares use the OECD's harmonised definition (usually under 30 hours a week in the main job); the United States has no harmonised figure. This is an adaptation of original OECD data; the opinions here are not the OECD's.
Charts like this, from your own numbers.
Connect a spreadsheet or the tools you run on, and Parity builds the dashboard and writes the report, with every number checked.
Try Parity free

