Charts like this, from your own numbers.
Connect a spreadsheet or the tools you run on, and Parity builds the dashboard and writes the report, with every number checked.
Try Parity freeFlip a switch and the light comes on. For 91.9% of the world's people in 2024, by the World Bank's count, that is simply how a home works. For the rest, about 655 million people, there was no electricity at home at all: not from the grid, not from a solar panel on the roof, not from a village mini-grid.
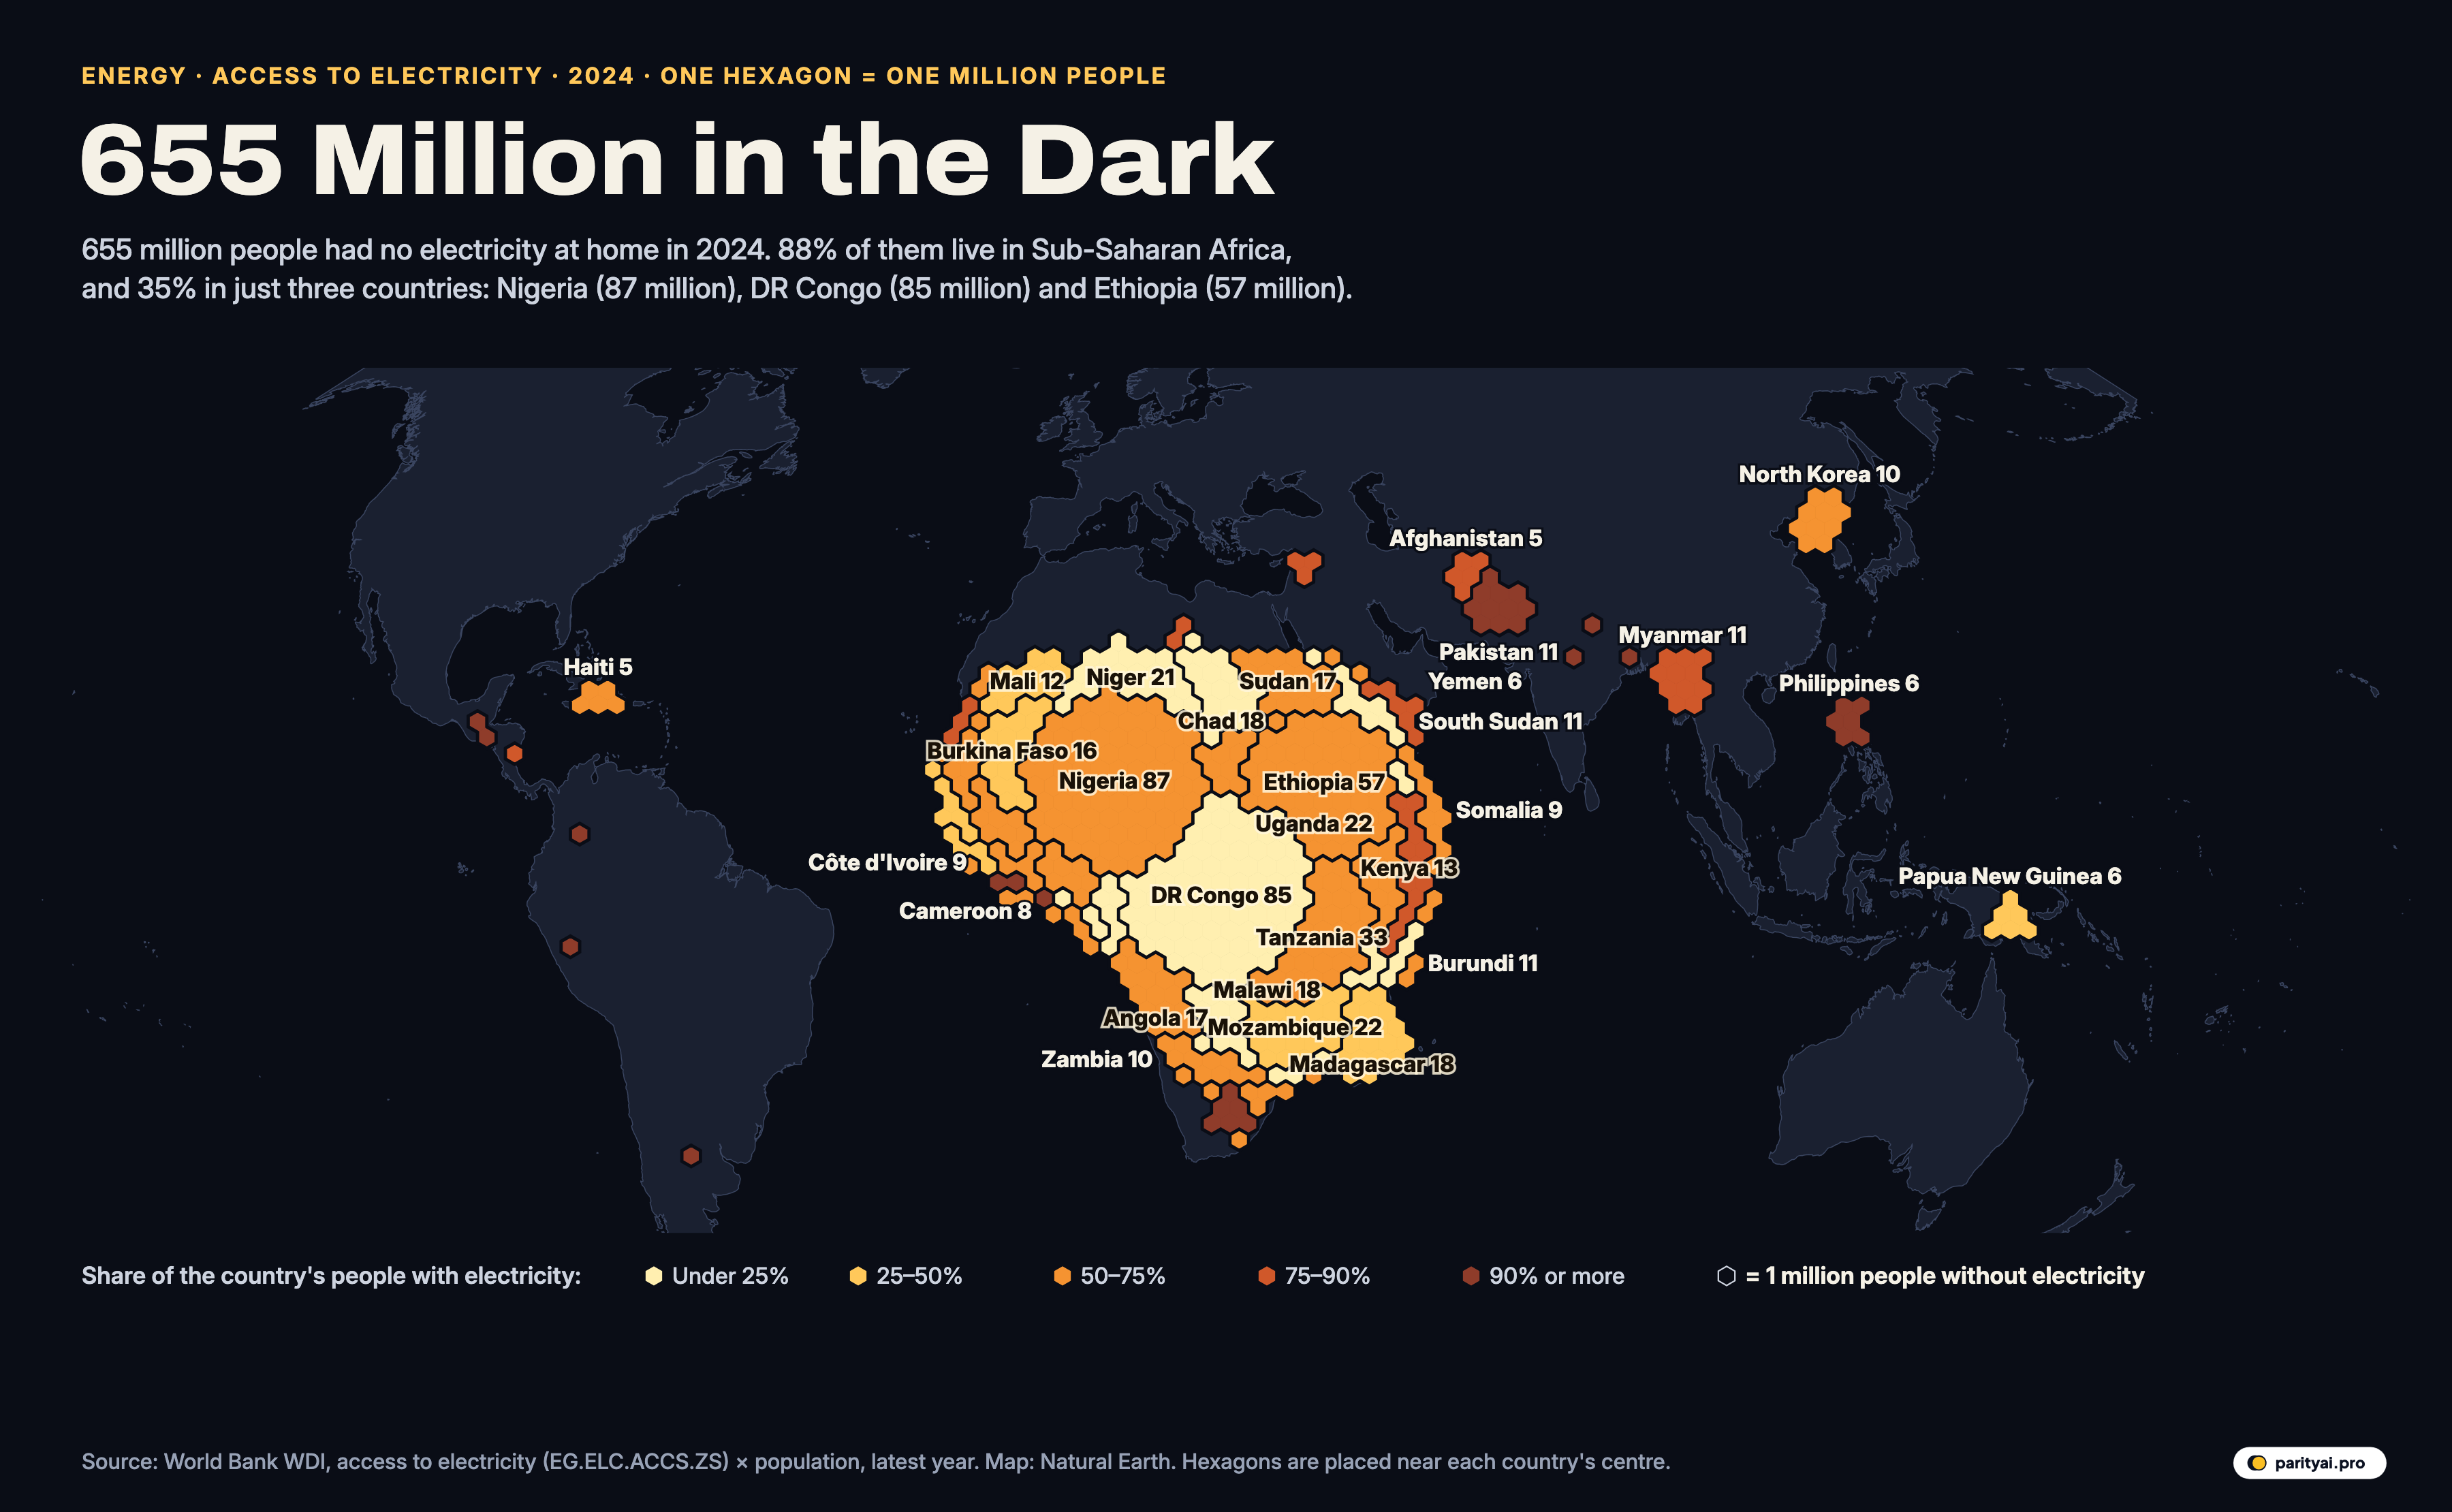
The map above shows where they live. Every hexagon is one million people without electricity, placed as close as possible to the centre of the country they live in. The colour shows how much of that country does have power: pale yellow where most people are without it, deep red where only a small minority are. There are 651 hexagons in all.
Seen from far enough away, the pattern is a single shape. Zoom in, and it becomes a set of very different stories.
At world scale: one continent
From the furthest distance, the map has one feature: a dense mass of hexagons covering Africa south of the Sahara, and a scattering everywhere else. In 2024, 579 million of the 655 million lived in Sub-Saharan Africa, 88% of the world total. Outside the region there were about 76 million.
That concentration is new. The World Bank's Tracking SDG7 report noted in 2025 that Sub-Saharan Africa now accounts for 85 percent of the global population without electricity, up from 50 percent in 2010. Much of the rest of the world closed its gap in the meantime. India reached 99.9% access in 2024; Bangladesh is at 99.5% and Indonesia at 99.9%. On the map, South Asia is almost empty.
The global access rate, meanwhile, has stalled. The 2026 edition of the report, published in June, found that in 2024, the global access rate stagnated at 92 per cent, leaving 655 million people still without power. In 2000 the share with access was 78.2%.
At regional scale: the belt across Africa
Zoom in on Africa and the hexagons form a belt across the middle of the continent, from the Sahel to the Great Lakes and down to Mozambique and Madagascar. Regional access was 55% in 2024.
The colours inside the belt vary a lot. The palest clusters, where fewer than a quarter of people have power, are in Niger (21.3% access), Chad (13.4%), Malawi (15.6%), Burundi (20.1%), the Central African Republic (18.2%) and DR Congo (22.5%). The lowest access rate of any country is South Sudan (5.4%). Of the 15 countries where fewer than half of people have electricity, 14 are in Sub-Saharan Africa.
The deeper orange clusters, where most people have power but the remainder is still large, include Kenya (77.0% access, 13 million without), Sudan (66.0%) and Cameroon (72.0%). Ghana is at 91.9% and South Africa at 90.2%, but in a country of South Africa's size even 10% without power is 6 million people.
Africa's access rate has risen steadily, but its population has grown almost as fast. Sustainable Energy for All, which publishes the progress report with the World Bank and other agencies, notes that Africa's access rate rose 17 percentage points, from 45% to 62%, since 2010, while the number of people without power on the continent, 581 million in 2024, was only marginally below its 2010 level.
| # | Country | People without access | Share with access | Year |
|---|---|---|---|---|
| 1 | Nigeria | 62.5% | 2024 | |
| 2 | DR Congo | 22.5% | 2024 | |
| 3 | Ethiopia | 56.6% | 2024 | |
| 4 | Tanzania | 52.4% | 2024 | |
| 5 | Mozambique | 36.9% | 2024 | |
| 6 | Uganda | 55.3% | 2024 | |
| 7 | Niger | 21.3% | 2024 | |
| 8 | Chad | 13.4% | 2024 | |
| 9 | Madagascar | 42.5% | 2024 | |
| 10 | Malawi | 15.6% | 2024 | |
| 11 | Angola | 55.5% | 2024 | |
| 12 | Sudan | 66.0% | 2024 | |
| 13 | Burkina Faso | 34.0% | 2024 | |
| 14 | Kenya | 77.0% | 2024 | |
| 15 | Mali | 49.5% | 2024 | |
| 16 | Burundi | 20.1% | 2024 | |
| 17 | Myanmar | 80.4% | 2024 | |
| 18 | Pakistan | 95.7% | 2024 | |
| 19 | South Sudan | 5.4% | 2024 | |
| 20 | North Korea | 61.4% | 2024 | |
| 21 | Zambia | 53.6% | 2024 | |
| 22 | Côte d'Ivoire | 72.9% | 2024 | |
| 23 | Somalia | 54.4% | 2024 | |
| 24 | Cameroon | 72.0% | 2024 | |
| 25 | Guinea | 53.8% | 2024 |
Population × (1 − access rate), latest year available.
At country scale: three giants
Three clusters dominate the map. Nigeria has the most people without electricity of any country, 87 million, even though 62.5% of Nigerians have access. DR Congo is close behind with 85 million, but its access rate is far lower, 22.5%: the pale yellow mass at the centre of the continent. Ethiopia has 57 million, with 56.6% access. Together those three account for 35% of the world total, and the ten largest clusters for 58%.
The next tier is a long list of East and Southern African countries: Tanzania (33 million), Mozambique and Uganda (22 million each), Niger (21 million), and then Chad, Madagascar and Malawi at 18 million each. The progress report notes that 80% of all unelectrified people live in just 22 countries.
At the edges: the scattered hexagons
Outside Africa the hexagons are few and spread out, and their colours tell a different story: mostly deep red, meaning high national access with a stubborn remainder. Pakistan has 11 million people without electricity despite 95.7% access, because its population is so large. Myanmar has 11 million (80.4% access); the Philippines 6 million (94.8%).
A few are paler. North Korea's cluster, about 10 million, reflects an access rate of 61.4%. Haiti has 5 million, with 53.9% access, the lowest in the Americas. Yemen has 6 million and Afghanistan 5 million.
58 countries have at least one hexagon. Many more have a few hundred thousand people without power, too few to round up to a hexagon; 74 countries have at least 100,000.
At the scale of a generation: who switched on
The hexagons show a snapshot, but the same data go back to 2000, and over that span some countries changed beyond recognition. Among countries with at least five million people, the biggest gains in access were in Afghanistan, from 4% in 2000 to 88% in 2024; Cambodia, from 17% to 99%; Nepal, from 30% to 98%; and Bangladesh, from 32% to 100%. India went from 60% to 99.9%.
In Africa, Rwanda rose from 6% to 72% and Kenya from 15% to 77%. Nigeria has gone from 43% to 62.5%, Ethiopia from 13% to 56.6%, Tanzania from 9% to 52.4% and Uganda from 7% to 55.3%. DR Congo has climbed from 7% to 22.5%, and Malawi from 5% to 15.6%. Those are large gains in share, and in most of these countries they were achieved while the population was growing fast, which is why the number of hexagons has shrunk so slowly.
Off-grid solar has been a large part of the change. The World Bank's energy programme estimated in 2024 that off-grid solar solutions were already estimated to benefit over 560 million people as of 2023, and would be the cheapest way to reach 41% of those still without power. The industry association GOGLA said its members sold more than 10 million solar energy kits in 2025.
A second, larger map
There is a gap the map does not show. The same 2026 report counts roughly two billion people, about a quarter of the world, still cooking with polluting fuels and technologies, and in Sub-Saharan Africa it puts the number without clean cooking at 970 million. Drawn with the same hexagons, that map would be three times as crowded, and it would reach far beyond Africa.
At household scale: what access means
The data behind the map come from household surveys and censuses, and the definition of access is generous. A home counts as having electricity if it has a connection to the grid, a mini-grid or an off-grid system such as a solar home kit. Access does not mean reliable power, enough power to run a fridge or a pump, or power you can afford. A household with a small solar lantern and phone charger may count as connected; a household on a grid that is down most evenings also counts.
Counts also differ by source. The International Energy Agency, using its own methods, puts the number higher: 730 million people worldwide still lacked access to electricity in 2024, with Sub-Saharan Africa accounting for eight in ten. The World Bank's total used here sums each country's population times its share without access, and comes to 655 million, matching the official Tracking SDG7 figure of 655 million.
The map's geometry has its own limits. Hexagons are placed near the centre of each country's main landmass, largest countries first, so big clusters spill over borders: Nigeria's pushes into its neighbours, DR Congo's into the countries around it. Smaller countries' hexagons then sit at the nearest free spot. The clusters show how many people, not exactly where.
| Region | Without electricity | Share of world total |
|---|---|---|
| Sub-Saharan Africa | 88% | |
| East Asia & Pacific | 5% | |
| Middle East, North Africa, Afghanistan & Pakistan | 4% | |
| Latin America & Caribbean | 2% | |
| South Asia | 0% | |
| Europe & Central Asia | 0% | |
| North America | 0% |
At 2030 scale: the target
The UN's Sustainable Development Goal 7.1 aims to ensure universal access to affordable, reliable and modern energy services by 2030. On current trends it will be missed by a wide margin. The progress report projects that between 644 and 645 million people will still be without electricity in 2030, about as many as today, and that Africa's share will rise to about 92%. The joint release on the 2026 report said universal access would now require the pace of progress to triple.
The biggest effort under way is Mission 300, a plan by the World Bank and African Development Bank to provide first time electricity access to 300 million people in Africa by 2030, launched in April 2024. At a summit in Dar es Salaam in January 2025, thirty African heads of state and government endorsed national plans, with partners pledging more than $50 billion. By mid-2026 the progress report counted more than 50 million people connected since July 2023, about one-sixth of the goal.
In 2024, about 89 million people gained electricity for the first time, the report says, but population growth offset much of it, and the global number without power fell by only 1.7%. On the map, that is roughly eleven hexagons switched off in a year. There are 651 still glowing.
Sources and method
- World Bank, World Development Indicators: Access to electricity (% of population), EG.ELC.ACCS.ZS, and Population, total (SP.POP.TOTL). 2024 (latest year per country), API updated October 8, 2026; from the World Bank Global Electrification Database used in Tracking SDG7
- Natural Earth country shapes and land via world-atlas; ISO 3166 codes via lukes/ISO-3166-Countries-with-Regional-Codes
For each country, the number of people without electricity is its population multiplied by the share without access, using the latest year with both figures (2024 for almost all countries). Access counts any household connection to the grid or to an off-grid system such as a solar home system or mini-grid, as defined in the World Bank's Global Electrification Database. Each hexagon is one million people, rounded to the nearest million, so countries with fewer than 500,000 people without power get none; their totals are in the data file. Hexagons are placed as close as possible to the centre of each country's main landmass, largest countries first, so big clusters spill across borders into neighbouring space. The world total sums every country with data and may differ slightly from the official Tracking SDG7 figure.
Charts like this, from your own numbers.
Connect a spreadsheet or the tools you run on, and Parity builds the dashboard and writes the report, with every number checked.
Try Parity free

