Charts like this, from your own numbers.
Connect a spreadsheet or the tools you run on, and Parity builds the dashboard and writes the report, with every number checked.
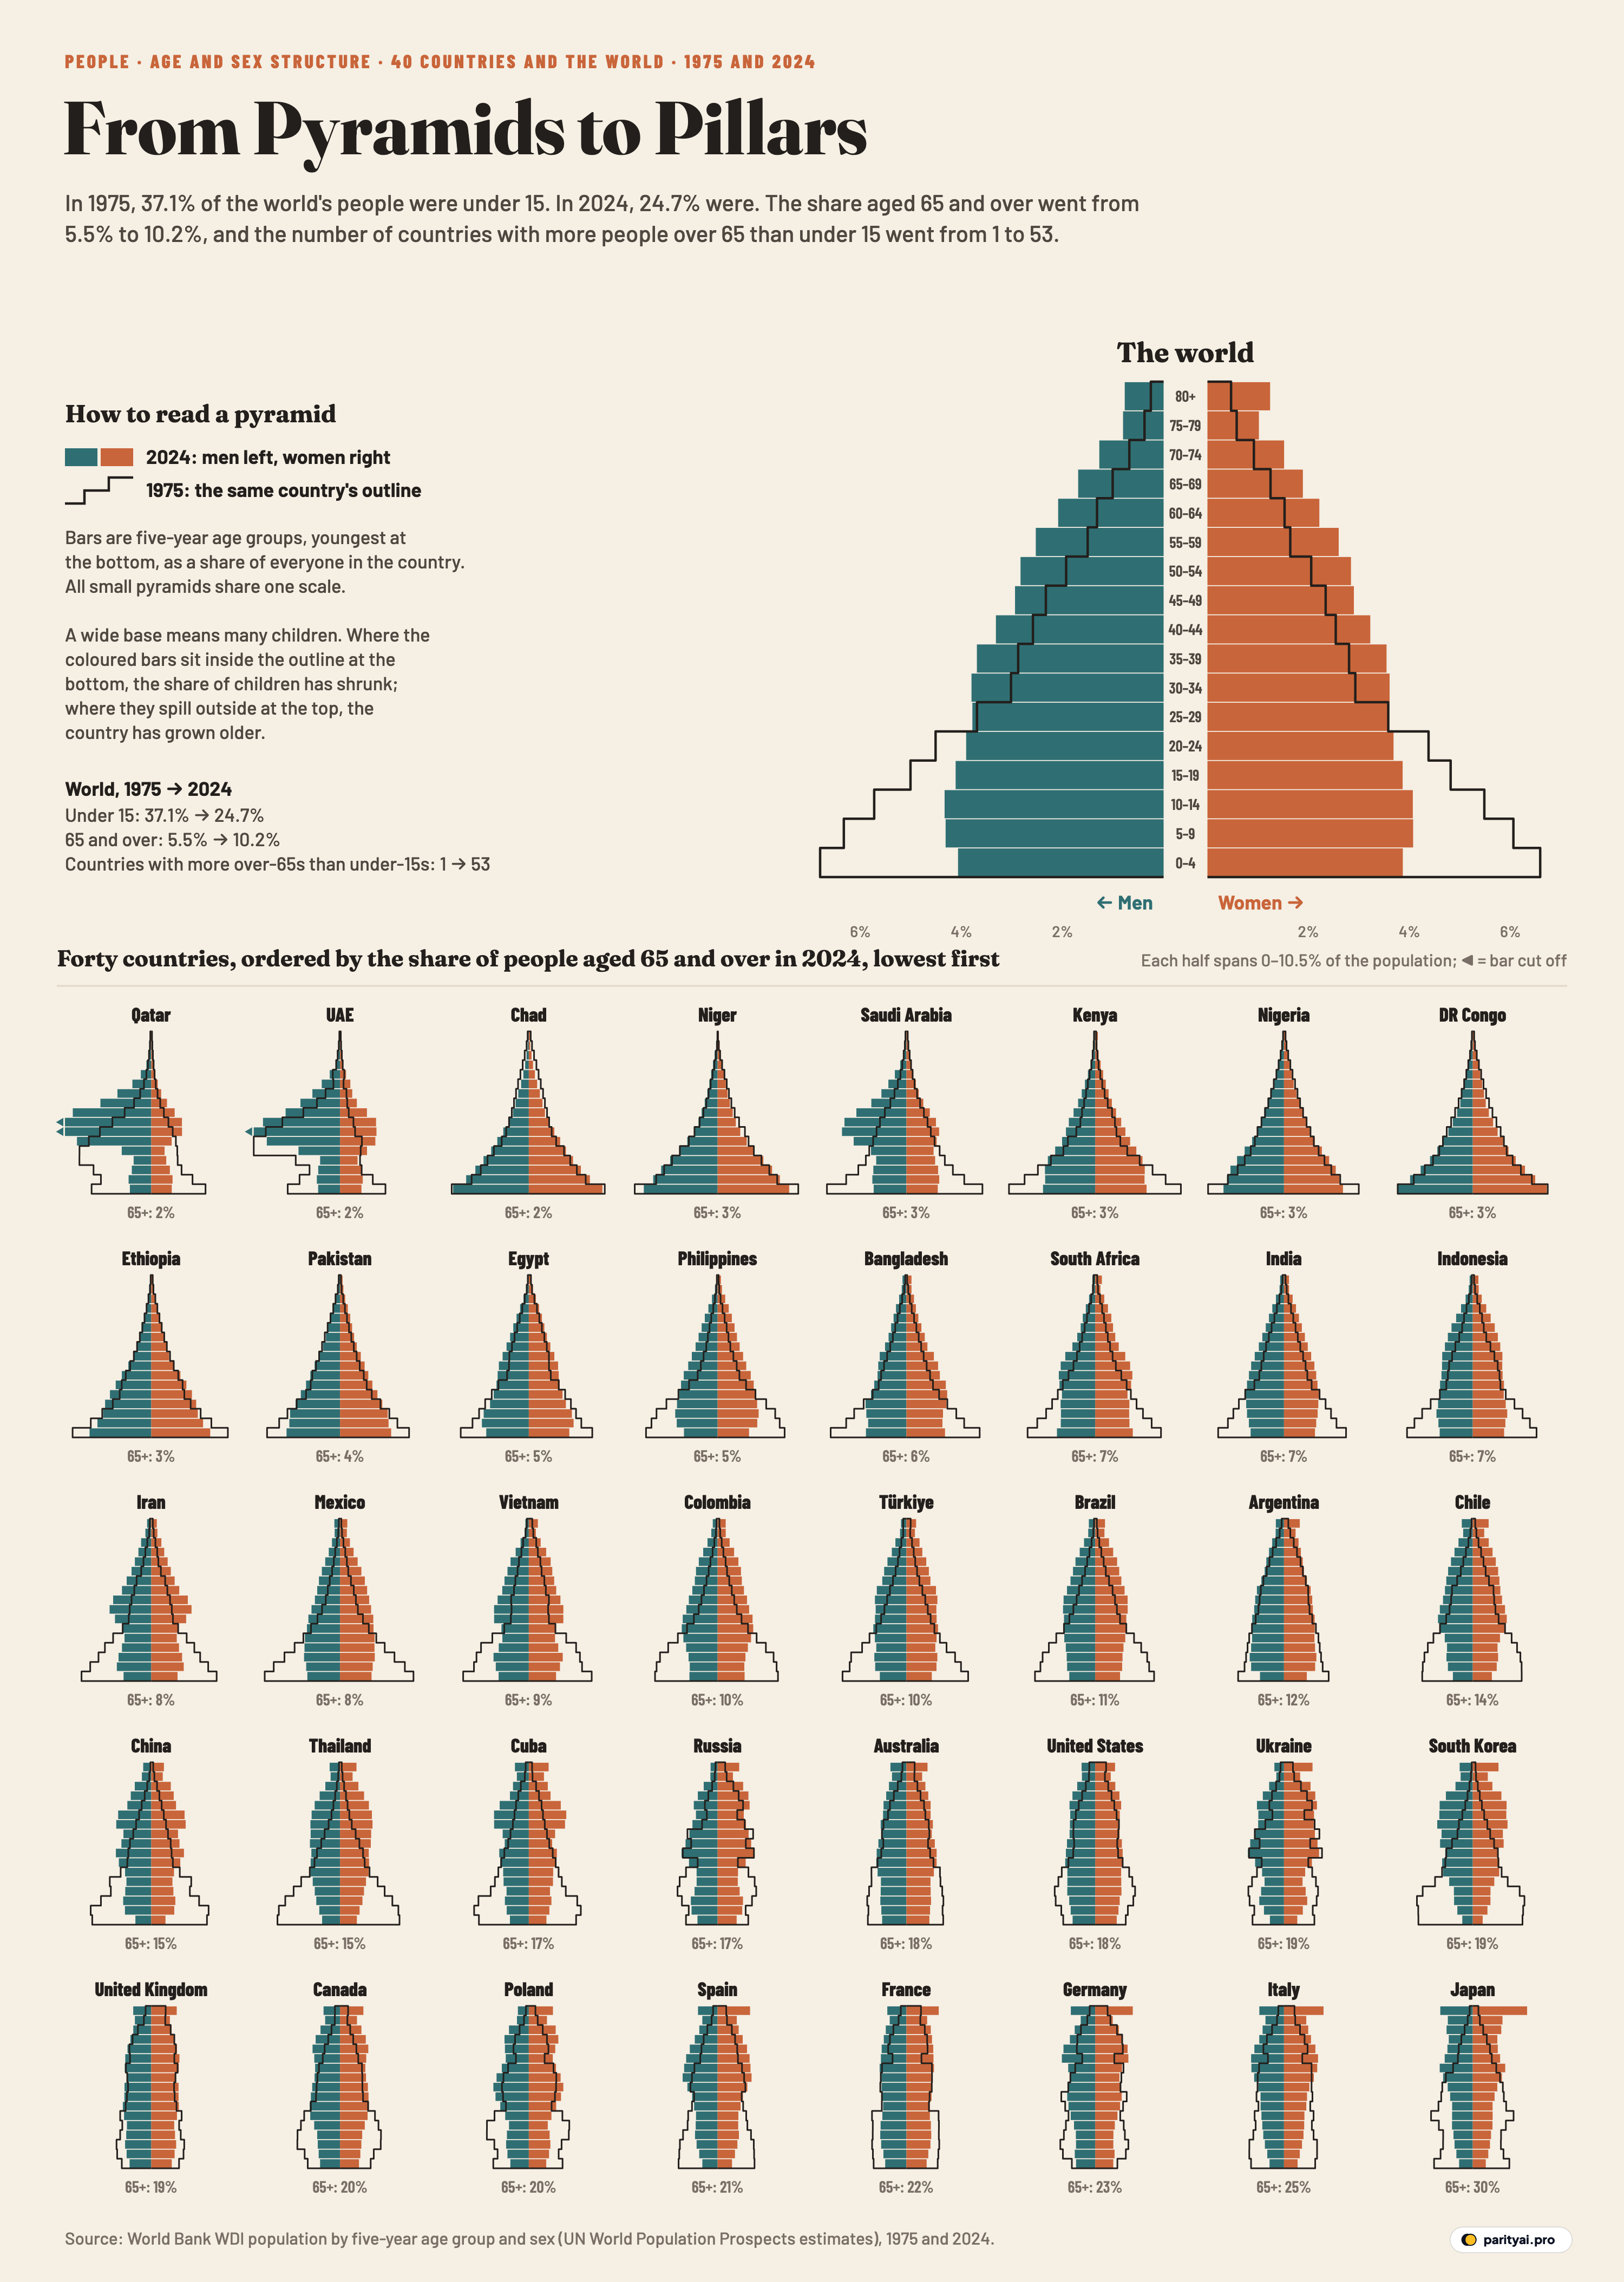
Try Parity freeA population pyramid is a country's people stacked by age: babies at the bottom, the oldest at the top, men on one side and women on the other. In 1975 the world's pyramid deserved the name. The bottom bar, children under five, was the widest of all, and every bar above it was a little narrower. 37.1% of the world's 4.06 billion people were under 15, and 5.5% were 65 or older.
In 2024 the world's 8.14 billion people make a different shape. The base has pulled in, so that the largest five-year group is no longer the youngest children but those aged 10–14. The sides run nearly straight up to middle age before narrowing. Under-15s are 24.7% of the total; people 65 and over are 10.2%. Both shapes are in the large chart at the top of the graphic above: the coloured bars are 2024, the black outline is 1975.
Below it are 40 countries drawn the same way, all at one scale, so a wide bar means a large share of that country's people. They are ordered by the share of their population aged 65 and over in 2024, from lowest to highest. The data are the World Bank's estimates by five-year age group and sex, built on the UN's World Population Prospects.
The best way to read a pyramid is from the bottom up, one part at a time.
The base: children
The bottom three bars, ages 0 to 14, are where the change of the past half-century is clearest. In almost every one of the 40 small pyramids, the coloured bars at the bottom sit well inside the black outline of 1975.
The largest shrinkage is in South Korea (38.5% to 10.6%): under-15s went from more than a third of South Korea's population to about a tenth. Statistics Korea reported a total fertility rate of 0.75 in 2024, up from 0.72 in 2023, the first rise in nine years and still the lowest in the world. Thailand's under-15 share fell from 42.4% to 14.7%, China's from 40.2% to 16.0%, Brazil's from 40.5% to 19.7%, and Mexico's from 47.5% to 24.5%. In Japan, which already had a narrow base in 1975, children are 11.4% of the population. Japan's 686,061 births in 2024 were the first time the number of newborns fell below 700,000 since records began in 1899.
A few pyramids still have their broad base. In Niger, 46.6% of people are under 15, almost the same as in 1975 (47.4%). In Chad the share went slightly up, from 44.2% to 46.1%, and Nigeria's barely changed (43.4% then, 41.0% now). In those three, and in Ethiopia, the largest five-year group is still the youngest, ages 0 to 4. Among the 40 countries drawn, Niger, Chad and DR Congo have the highest under-15 shares, though by the World Bank's figures the Central African Republic, not drawn here, has a higher one still.
| Country | Under 15, 1975 | Under 15, 2024 | 65+, 1975 | 65+, 2024 | Largest age group, 2024 |
|---|---|---|---|---|---|
| Japan | 23.8% | 11.4% | 7.9% | 80+ | |
| Italy | 24.3% | 11.9% | 12.2% | 55–59 | |
| Germany | 21.5% | 13.9% | 14.8% | 55–59 | |
| France | 23.9% | 16.5% | 13.5% | 50–54 | |
| Spain | 27.3% | 12.9% | 10.3% | 45–49 | |
| Poland | 24.0% | 14.8% | 9.5% | 40–44 | |
| Canada | 26.2% | 15.1% | 8.4% | 30–34 | |
| United Kingdom | 23.3% | 17.2% | 14.1% | 30–34 | |
| South Korea | 38.5% | 10.6% | 3.6% | 50–54 | |
| Ukraine | 22.8% | 13.9% | 10.6% | 35–39 | |
| United States | 25.2% | 17.3% | 10.3% | 30–34 | |
| Australia | 27.5% | 17.8% | 8.7% | 30–34 | |
| Russia | 23.0% | 17.3% | 8.9% | 35–39 | |
| Cuba | 36.8% | 15.3% | 6.1% | 55–59 | |
| Thailand | 42.4% | 14.7% | 3.1% | 50–54 | |
| China | 40.2% | 16.0% | 4.0% | 50–54 | |
| Chile | 35.8% | 17.0% | 4.3% | 30–34 | |
| Argentina | 29.7% | 21.6% | 7.2% | 10–14 | |
| Brazil | 40.5% | 19.7% | 3.2% | 35–39 | |
| Türkiye | 41.5% | 21.4% | 4.8% | 25–29 | |
| Colombia | 43.4% | 20.3% | 3.1% | 25–29 | |
| Vietnam | 41.4% | 23.2% | 5.2% | 35–39 | |
| Mexico | 47.5% | 24.5% | 2.8% | 10–14 | |
| Iran | 43.2% | 22.4% | 3.3% | 35–39 | |
| Indonesia | 42.0% | 24.6% | 3.4% | 10–14 | |
| India | 40.7% | 24.6% | 3.8% | 20–24 | |
| South Africa | 41.9% | 25.9% | 3.7% | 0–4 | |
| Bangladesh | 44.9% | 28.0% | 3.1% | 15–19 | |
| Philippines | 46.9% | 27.9% | 2.4% | 10–14 | |
| Egypt | 41.0% | 32.0% | 4.0% | 5–9 | |
| Pakistan | 44.1% | 36.7% | 3.1% | 0–4 | |
| Ethiopia | 45.6% | 39.1% | 2.8% | 0–4 | |
| DR Congo | 44.3% | 46.0% | 2.9% | 0–4 | |
| Nigeria | 43.4% | 41.0% | 3.2% | 0–4 | |
| Kenya | 52.0% | 36.8% | 2.1% | 0–4 | |
| Saudi Arabia | 44.8% | 23.8% | 2.5% | 30–34 | |
| Niger | 47.4% | 46.6% | 1.7% | 0–4 | |
| Chad | 44.2% | 46.1% | 3.8% | 0–4 | |
| UAE | 27.2% | 16.1% | 1.8% | 30–34 | |
| Qatar | 35.7% | 15.1% | 1.7% | 35–39 |
Shares of the total population. Highlighted: more people aged 65+ than under 15 in 2024.
The waist: working ages
The middle of the pyramid, roughly ages 15 to 64, is where economists look for the "demographic dividend". The UN Population Fund defines it as the economic growth potential that can result from shifts in a population's age structure, above all when the working-age share is larger than the share of children and older people. When a country's birth rate falls, the large generations born before the fall move into working age while fewer children follow them, and the waist of the pyramid fattens.
You can see that bulge in the middle of many of the small pyramids. India's largest age group in 2024 is 20–24; in 1975 it was 0–4. Vietnam's and Iran's are both 35–39, and Brazil's is 35–39. Bangladesh's is 15–19.
Three pyramids on the chart look like nothing else: Qatar, the United Arab Emirates and Saudi Arabia. Their left side, men, swells out sharply between the ages of about 25 and 50, far beyond the right side. In the World Bank's estimates, men are 71.3% of Qatar's population, 63.9% of the UAE's and 60.5% of Saudi Arabia's. The bulge is in the working ages and among men only. In 1975, Qatar's and Saudi Arabia's outlines still had a broad base of children; the UAE's already bulged in the working ages. The bars for Qatari men aged 30 to 39 and Emirati men aged 30 to 34 run off the edge of the small chart, so we cut them off and marked them with an arrow. Because so few of their residents are old, Qatar and the UAE have the lowest shares aged 65 and over of the 40, which is why they come first in the grid, ahead of Chad and Niger.
The shoulders: a generation in its fifties
Look at China, South Korea, Thailand and Cuba and you will see a wide band about two-thirds of the way up, with narrower bars both above and below. For China, South Korea and Thailand the largest five-year group in 2024 is 50–54. For Cuba, Italy and Germany it is 55–59.
These are the children of the 1960s and early 1970s, who were among the bottom bars of the 1975 outline. Fifty years on they have climbed most of the way up the pyramid, and the generations behind them are smaller. In China, that is the shape of a population that has started to shrink: China's National Bureau of Statistics put the population at the end of 2024 at 1,408.28 million, a decrease of 1.39 million on a year earlier, the third straight annual fall. The country began raising its retirement age from 1 January 2025.
Russia and Ukraine have more jagged shoulders, with deep notches. Their pyramids carry the marks of earlier events in their uneven bars, and women outnumber men: men are 46.4% of Russia's population and 46.5% of Ukraine's in these estimates. The largest group in both is 35–39.
The top: 65 and over
The upper bars have grown nearly everywhere. Worldwide, the share aged 80 and over rose from 0.7% in 1975 to 2.0% in 2024. In Japan it is 10.6%, so large that the open-ended top bar, everyone aged 80 and over, is now the biggest single group in Japan's pyramid. That is partly an effect of the bar holding more than five years of ages, but in 1975 Japan's top bar was its smallest.
Japan has the highest share aged 65 and over of the 40 countries, 29.8% in the World Bank's figures for 2024, up from 7.9% in 1975. That rise, 21.9 percentage points, is the largest on the chart. Japan's own estimate for September 2026 put the share at a record 29.6%, followed among large countries by Italy at 25.6% and Germany at 24.2%. In the World Bank's 2024 data, Italy's share is 24.6% and Germany's 23.2%.
The fastest risers started from a low base. South Korea went from 3.6% aged 65 and over in 1975 to 19.3% in 2024; Thailand from 3.1% to 15.4%; China from 4.0% to 14.7%. Cuba went from 6.1% to 16.6%.
One way to sum up the change is to compare the top with the base. In 1975, by the World Bank's figures, only one country in its database, Monaco, had more people aged 65 and over than under 15. In 2024, 53 did. The highlighted rows in the table above show which of the 40 are among them.
The outline: where the shape stayed
Not every country changed shape. Chad's 65-and-over share actually fell, from 3.8% in 1975 to 2.1% in 2024. Nigeria's went from 3.2% to 3.0%, and Ethiopia's from 2.8% to 3.2%. In these countries the 2024 bars follow the 1975 outline closely: the share of people at each age is much as it was.
The United States, the United Kingdom and France changed less than Southern Europe and East Asia. America's share aged 65 and over went from 10.3% to 17.9%, and its under-15 share from 25.2% to 17.3%. Its largest group in 2024 is 30–34. The United Kingdom and France also kept more of their base than Southern Europe did: France's under-15 share is 16.5%, against 12.9% in Spain and 11.9% in Italy.
What the bars can't tell you
These pyramids are estimates. The UN builds them from censuses, surveys and birth and death registration where those exist, and for many countries the most recent census is years old, so the bars for small children in particular are partly modelled. Countries are shown within their present borders in both years, so the 1975 pyramids for Russia, Ukraine and Germany are reconstructions of territories, not the states of the time. Every bar is a share of the population, not a count, so a pyramid that looks the same in both years can belong to a country that has tripled in size. Migration shows up only as it changes those shares. And the 80+ bar is open-ended, so it always looks larger relative to the five-year bars beneath it as people live longer.
Ahead: the top overtakes the base
The UN's World Population Prospects 2024 expects the world's population to peak at around 10.3 billion in the mid-2080s, and it notes that the population has already peaked in 63 countries and areas, including China, Germany, Japan and Russia. On the same projection, people aged 80 and over will outnumber infants by the mid-2030s, and by the late 2070s people aged 65 and over will outnumber children under 18. The World Health Organization expects that by 2030, 1 in 6 people in the world will be aged 60 years or over; the UN has named 2021 to 2030 the Decade of Healthy Ageing.
Put those forecasts together and the world's own pyramid will look in a few decades much like the small ones in the bottom rows of the chart above. Japan, Italy and Germany are not outliers. They are early.
Sources and method
- World Bank, World Development Indicators: Population ages 00–04 … 80+, female and male (% of female/male population), and total female and male population. 1975 and 2024, API updated October 8, 2026; based on UN World Population Prospects
- World Bank, Population ages 65 and above and 0–14 (% of total population)
- United Nations, World Population Prospects 2024
Each bar is the share of a country's whole population that is male or female and in a five-year age group, computed from the World Bank's age shares by sex and its male and female population totals. All pyramids share one horizontal scale, so a wide bar means a large share of that country's people. The 1975 outline uses the same method. Countries are ordered by the share of people aged 65 and over in 2024. The figures are UN estimates and, for many countries, rest on censuses that are years old. Russia, Ukraine and Germany are shown within their current borders in both years.
Charts like this, from your own numbers.
Connect a spreadsheet or the tools you run on, and Parity builds the dashboard and writes the report, with every number checked.
Try Parity free

