Somewhere today, a nurse in Dubai, a builder in Moscow, a farm worker in California and a care assistant in London will each send part of their pay home. Most of these transfers are small, a few hundred dollars at a time. Added up, they become one of the biggest flows of money in the world.
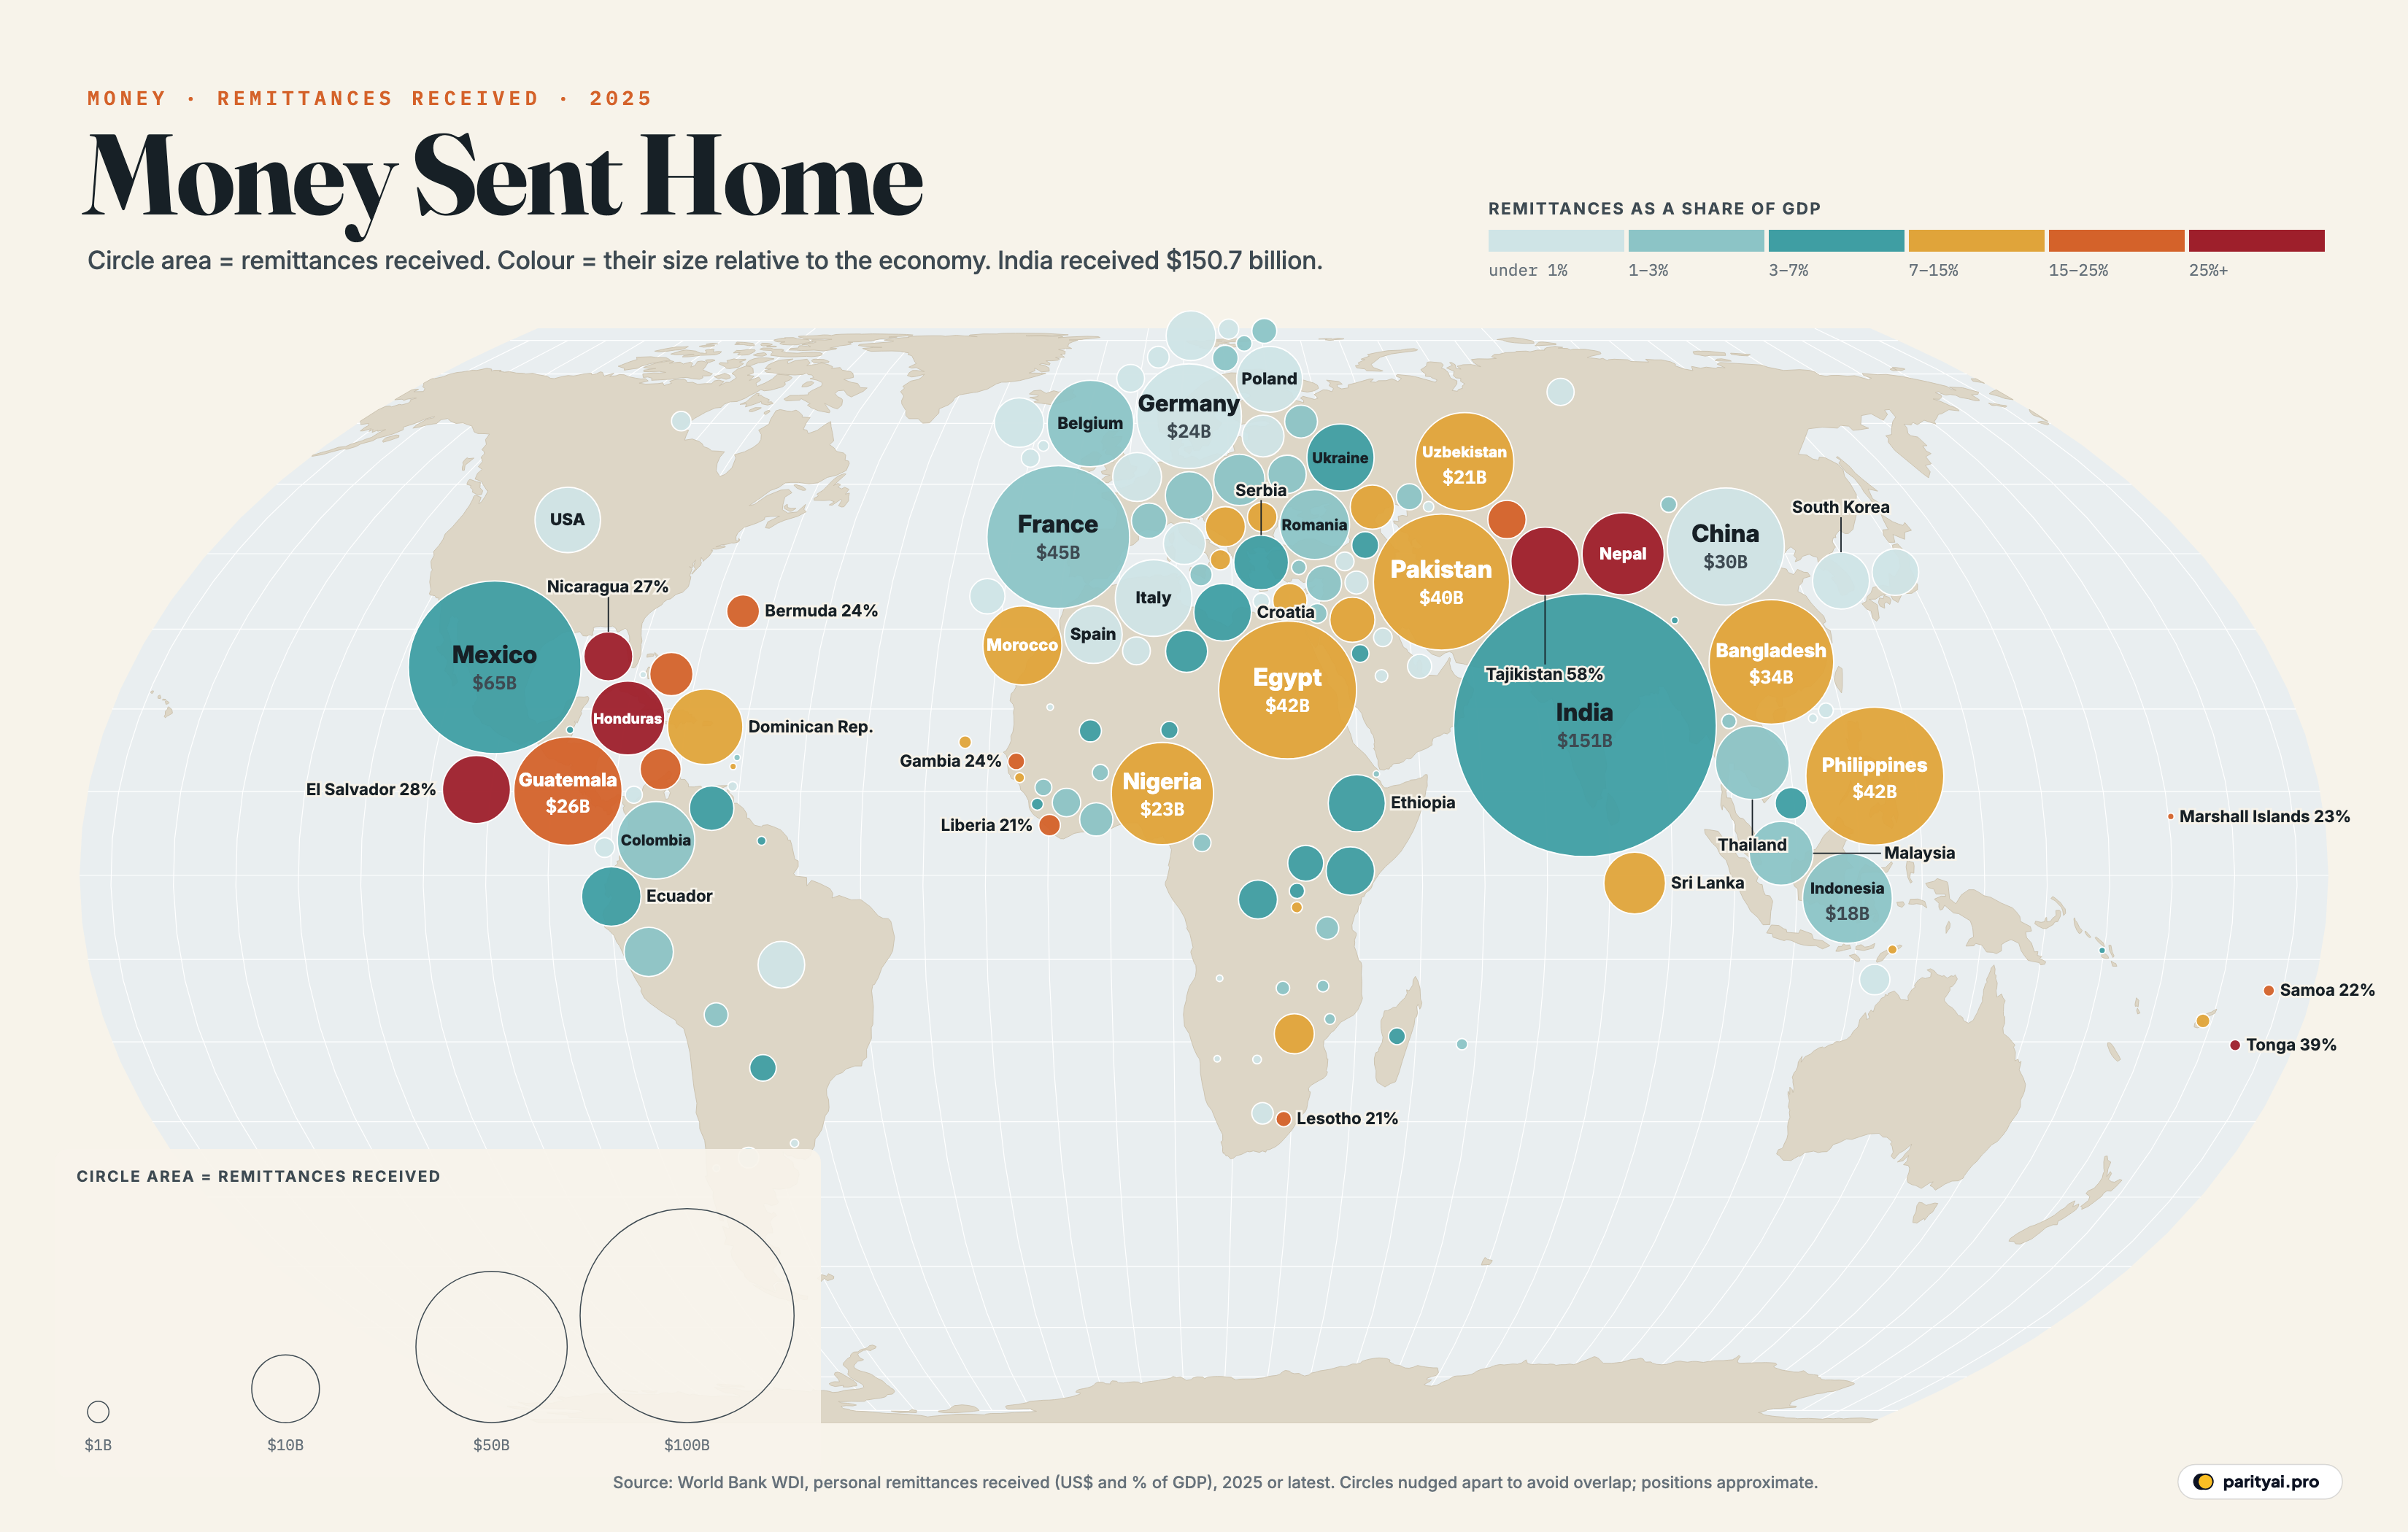
The map above shows where that money lands. Each circle is a country, placed roughly where it sits on the map and nudged aside so circles don't overlap. Its area is the remittances the country received in 2025, or 2024 where newer figures aren't out yet. Its colour shows how big that money is relative to the country's whole economy: pale teal for under 1% of GDP, deep red for more than a quarter. The data come from the World Bank's development indicators.
Across the 145 countries on the map, recorded remittances added up to about $963 billion. The World Bank's latest full estimate found that remittances to low- and middle-income countries continued to outpace foreign direct investment and development aid combined. For many families, they are the most reliable income they have.
Here are six places on the map, and what remittances mean for each of them.
India: the biggest circle
India's circle dwarfs every other on the map. It received $150.7 billion, about 16% of all the remittances in the data, more than Mexico and France combined. A decade ago it received $68.9 billion; the total has grown about 2.2 times since.
India has the world's largest diaspora, around 18.5 million people living abroad, according to the UN. They range from construction workers in the Gulf to software engineers in the United States. Even so, remittances are only about 3.8% of India's huge economy, which is why its circle is teal, not red. In the regions that send the most workers abroad, the money matters far more than the national figure suggests.
Tajikistan: the reddest circle
At the other extreme is Tajikistan, a small, mountainous country in Central Asia. Its circle is modest, $10.2 billion, but it is the deepest red on the map: remittances equal 57.7% of its GDP, the highest share of any country in the data.
Most of that money comes from Tajik workers in Russia, who build its apartment blocks, sweep its streets and staff its markets. For Tajikistan, Russia's economy is in effect its own. When the rouble falls, Tajik households feel it immediately. Any change in Russia's demand for foreign workers ripples straight through Tajik household budgets.
Nepal (32.3% of GDP, $14.7 billion) is in a similar position. Large numbers of Nepalis work in the Gulf, Malaysia and India, and their earnings support households across the country.
Central America: the red corridor
Look at the red cluster south of Mexico. Honduras (30.1% of GDP), El Salvador (27.5%), Nicaragua (26.6%) and Guatemala (20.8%) all depend on money sent from the United States to an extent few other regions do. Guatemala received $25.7 billion, the ninth-largest amount of any country on the map.
Mexico itself received $65.1 billion, second only to India, though at 3.6% of GDP its circle is teal. Mexico's remittances more than doubled in a decade, from $26.8 billion.
These countries face a new cost from January 1, 2026: a 1% US federal tax on remittance transfers sent in cash, money orders and similar forms. Transfers paid from a US bank account or with a US-issued card are exempt, so the tax falls mostly on people who rely on cash, often the lowest-paid workers.
Egypt: a sudden surge
Egypt's circle is one of the largest and one of the most orange. It received a record $41.5 billion in 2025, 11.4% of GDP, up from $18.3 billion a decade earlier. The jump came in 2024 and 2025, after Egypt let its currency float freely. A common explanation is that, while official and unofficial exchange rates differed, many Egyptians abroad sent money through informal channels, and that once the official rate became competitive more of it went through banks instead. Recorded remittances jumped, rising more than 40% in a year.
That is a reminder that recorded remittances measure only what goes through official channels. Informal transfers, through couriers, money changers or networks of trust such as hawala, can be large, and they don't appear on this map at all.
The Philippines, Pakistan and Bangladesh: workers for the world
Three large orange circles sit in Asia. The Philippines received $41.6 billion (8.5% of GDP), Pakistan $40.5 billion (9.9%) and Bangladesh $33.9 billion (7.4%).
All three have made exporting labour part of their economic strategy. Filipino nurses, seafarers and domestic workers are employed worldwide, and Pakistan and Bangladesh send large numbers of workers to the Gulf. For all three, remittances are a major source of foreign currency, which helps pay for the imports, from fuel to food, that their economies depend on.
France and Germany: the surprise entries
Two of the ten biggest circles belong to rich European countries: France ($44.5 billion) and Germany ($23.9 billion). That looks odd until you know how the statistics work.
The World Bank's measure of personal remittances includes the wages of people who live in one country and work in another. Many French residents commute to jobs in Switzerland and Luxembourg, and their pay is counted as money coming into France. The same is true of Germans working across the border. These flows are large in dollars but small next to such big economies, which is why both circles are pale.
The same quirk explains some small, rich places with surprisingly high shares, such as Bermuda (24.2% of GDP).
| # | Country | Share of GDP | Received | Year |
|---|---|---|---|---|
| 1 | Tajikistan | $10.2 billion | 2025 | |
| 2 | Tonga | $0.3 billion | 2025 | |
| 3 | Nepal | $14.7 billion | 2025 | |
| 4 | Honduras | $11.9 billion | 2025 | |
| 5 | El Salvador | $10.1 billion | 2025 | |
| 6 | Nicaragua | $5.2 billion | 2024 | |
| 7 | Bermuda | $2.4 billion | 2025 | |
| 8 | Gambia | $0.6 billion | 2025 | |
| 9 | Marshall Islands | $0.1 billion | 2024 | |
| 10 | Samoa | $0.3 billion | 2025 | |
| 11 | Liberia | $1.0 billion | 2024 | |
| 12 | Guatemala | $25.7 billion | 2025 | |
| 13 | Lesotho | $0.5 billion | 2025 | |
| 14 | Kyrgyzstan | $3.2 billion | 2024 | |
| 15 | Kosovo | $2.2 billion | 2025 | |
| 16 | Haiti | $4.1 billion | 2024 | |
| 17 | Jamaica | $3.7 billion | 2025 | |
| 18 | Uzbekistan | $21.1 billion | 2025 | |
| 19 | Cabo Verde | $0.4 billion | 2025 | |
| 20 | Egypt | $41.5 billion | 2025 |
Personal remittances received, World Bank. Latest year available (2025 or 2024).
China and Nigeria: big totals, small shares
Two other circles show how size changes the picture. China received $30.0 billion, the eighth-largest amount in the world, but that is just 0.2% of its economy, so its circle is the palest on the map. Nigeria, Africa's most populous country, received $22.8 billion, equal to 7.8% of its GDP. That makes Nigerians living abroad one of the country's most important economic links with the rest of the world.
Small islands, big shares
Some of the most dependent economies are too small to see on the map without labels. Tonga (39.3% of GDP), Samoa (22.4%) and the Marshall Islands (23.5%) are Pacific island nations with large communities abroad, in New Zealand, Australia and the United States. Of the countries in the data, 13 receive remittances worth more than a fifth of their GDP, and 22 more than a tenth.
| # | Country | Received | Share of GDP | 2010–2025 |
|---|---|---|---|---|
| 1 | India | 3.8% | ||
| 2 | Mexico | 3.6% | ||
| 3 | France | 1.3% | ||
| 4 | Philippines | 8.5% | ||
| 5 | Egypt | 11.4% | ||
| 6 | Pakistan | 9.9% | ||
| 7 | Bangladesh | 7.4% | ||
| 8 | China | 0.2% | ||
| 9 | Guatemala | 20.8% | ||
| 10 | Germany | 0.5% | ||
| 11 | Nigeria | 7.8% | ||
| 12 | Uzbekistan | 14.4% | ||
| 13 | Indonesia | 1.2% | ||
| 14 | Belgium | 2.3% | ||
| 15 | Nepal | 32.3% |
Current US dollars.
A decade of growth
Almost every big circle on the map has grown fast. India's remittances rose from $68.9 billion in 2015 to $150.7 billion. Mexico's went from $26.8 billion to $65.1 billion, Egypt's from $18.3 billion to $41.5 billion, and the Philippines' from $29.8 billion to $41.6 billion.
Several forces drove that growth. More people live and work outside their country of birth than ever before. Labour shortages in the United States, Europe and the Gulf after the pandemic pushed up the wages of migrant workers. Digital transfer services have made sending money cheaper and faster, and have pulled some money that once went informally into the official figures. And in some countries, as Egypt shows, exchange-rate reforms made the official channel more attractive.
Remittances have also proved unusually steady. Foreign investment tends to flee a country in a crisis, and aid budgets change with politics. Remittances tend to hold up, and sometimes rise, when things go wrong at home, as migrants send more to help their families through a drought, a currency collapse or a war. That makes them a kind of insurance for the households that receive them, and a stable source of foreign currency for the countries they live in.
The flip side is dependence. When a host economy slows, or when it changes its migration rules, the shock travels quickly to the countries in deep red on this map. And when large numbers of working-age people leave, villages and towns at home can be left with too few workers and too many dependants.
How to read the map
- Positions are approximate. Circles start at each country's centre and are pushed apart until none overlap, so crowded regions such as Europe and Central America spread out.
- Latest year. Most countries have 2025 figures. For 26, including several large ones, the latest published year is 2024.
- Official channels only. Money sent informally isn't counted, so the real totals are larger, especially for countries with big gaps between official and market exchange rates.
- Cross-border workers count too. The measure includes wages of people living in one country and working in another, which is why some rich European countries appear high on the list.
The map shows two different kinds of importance. Big circles are where the most money goes. Red circles are where the money matters most. A remittance of a few hundred dollars barely moves India's economy. In Tajikistan, Nepal or Honduras, a few hundred dollars multiplied by millions of workers is a large share of everything the country produces.
Sources and method
- World Bank, World Development Indicators: personal remittances, received (current US$) BX.TRF.PWKR.CD.DT and (% of GDP) BX.TRF.PWKR.DT.GD.ZS. 2025 where published, otherwise 2024; retrieved October 9, 2026
- Natural Earth country shapes via world-atlas; ISO 3166 codes via lukes/ISO-3166-Countries-with-Regional-Codes
Personal remittances are money and goods sent by migrants and people working abroad to households in their home country, plus the earnings of short-term workers abroad, as recorded in balance-of-payments statistics. Money sent through informal channels is not counted, so true flows are larger. Each circle's area is proportional to remittances received; circles start at the country's centre and are nudged apart so they don't overlap, so positions are approximate. Where 2025 data are not yet published, the 2024 figure is used.
Charts like this, from your own numbers.
Connect a spreadsheet or the tools you run on, and Parity builds the dashboard and writes the report, with every number checked.
Try Parity free

