Charts like this, from your own numbers.
Connect a spreadsheet or the tools you run on, and Parity builds the dashboard and writes the report, with every number checked.
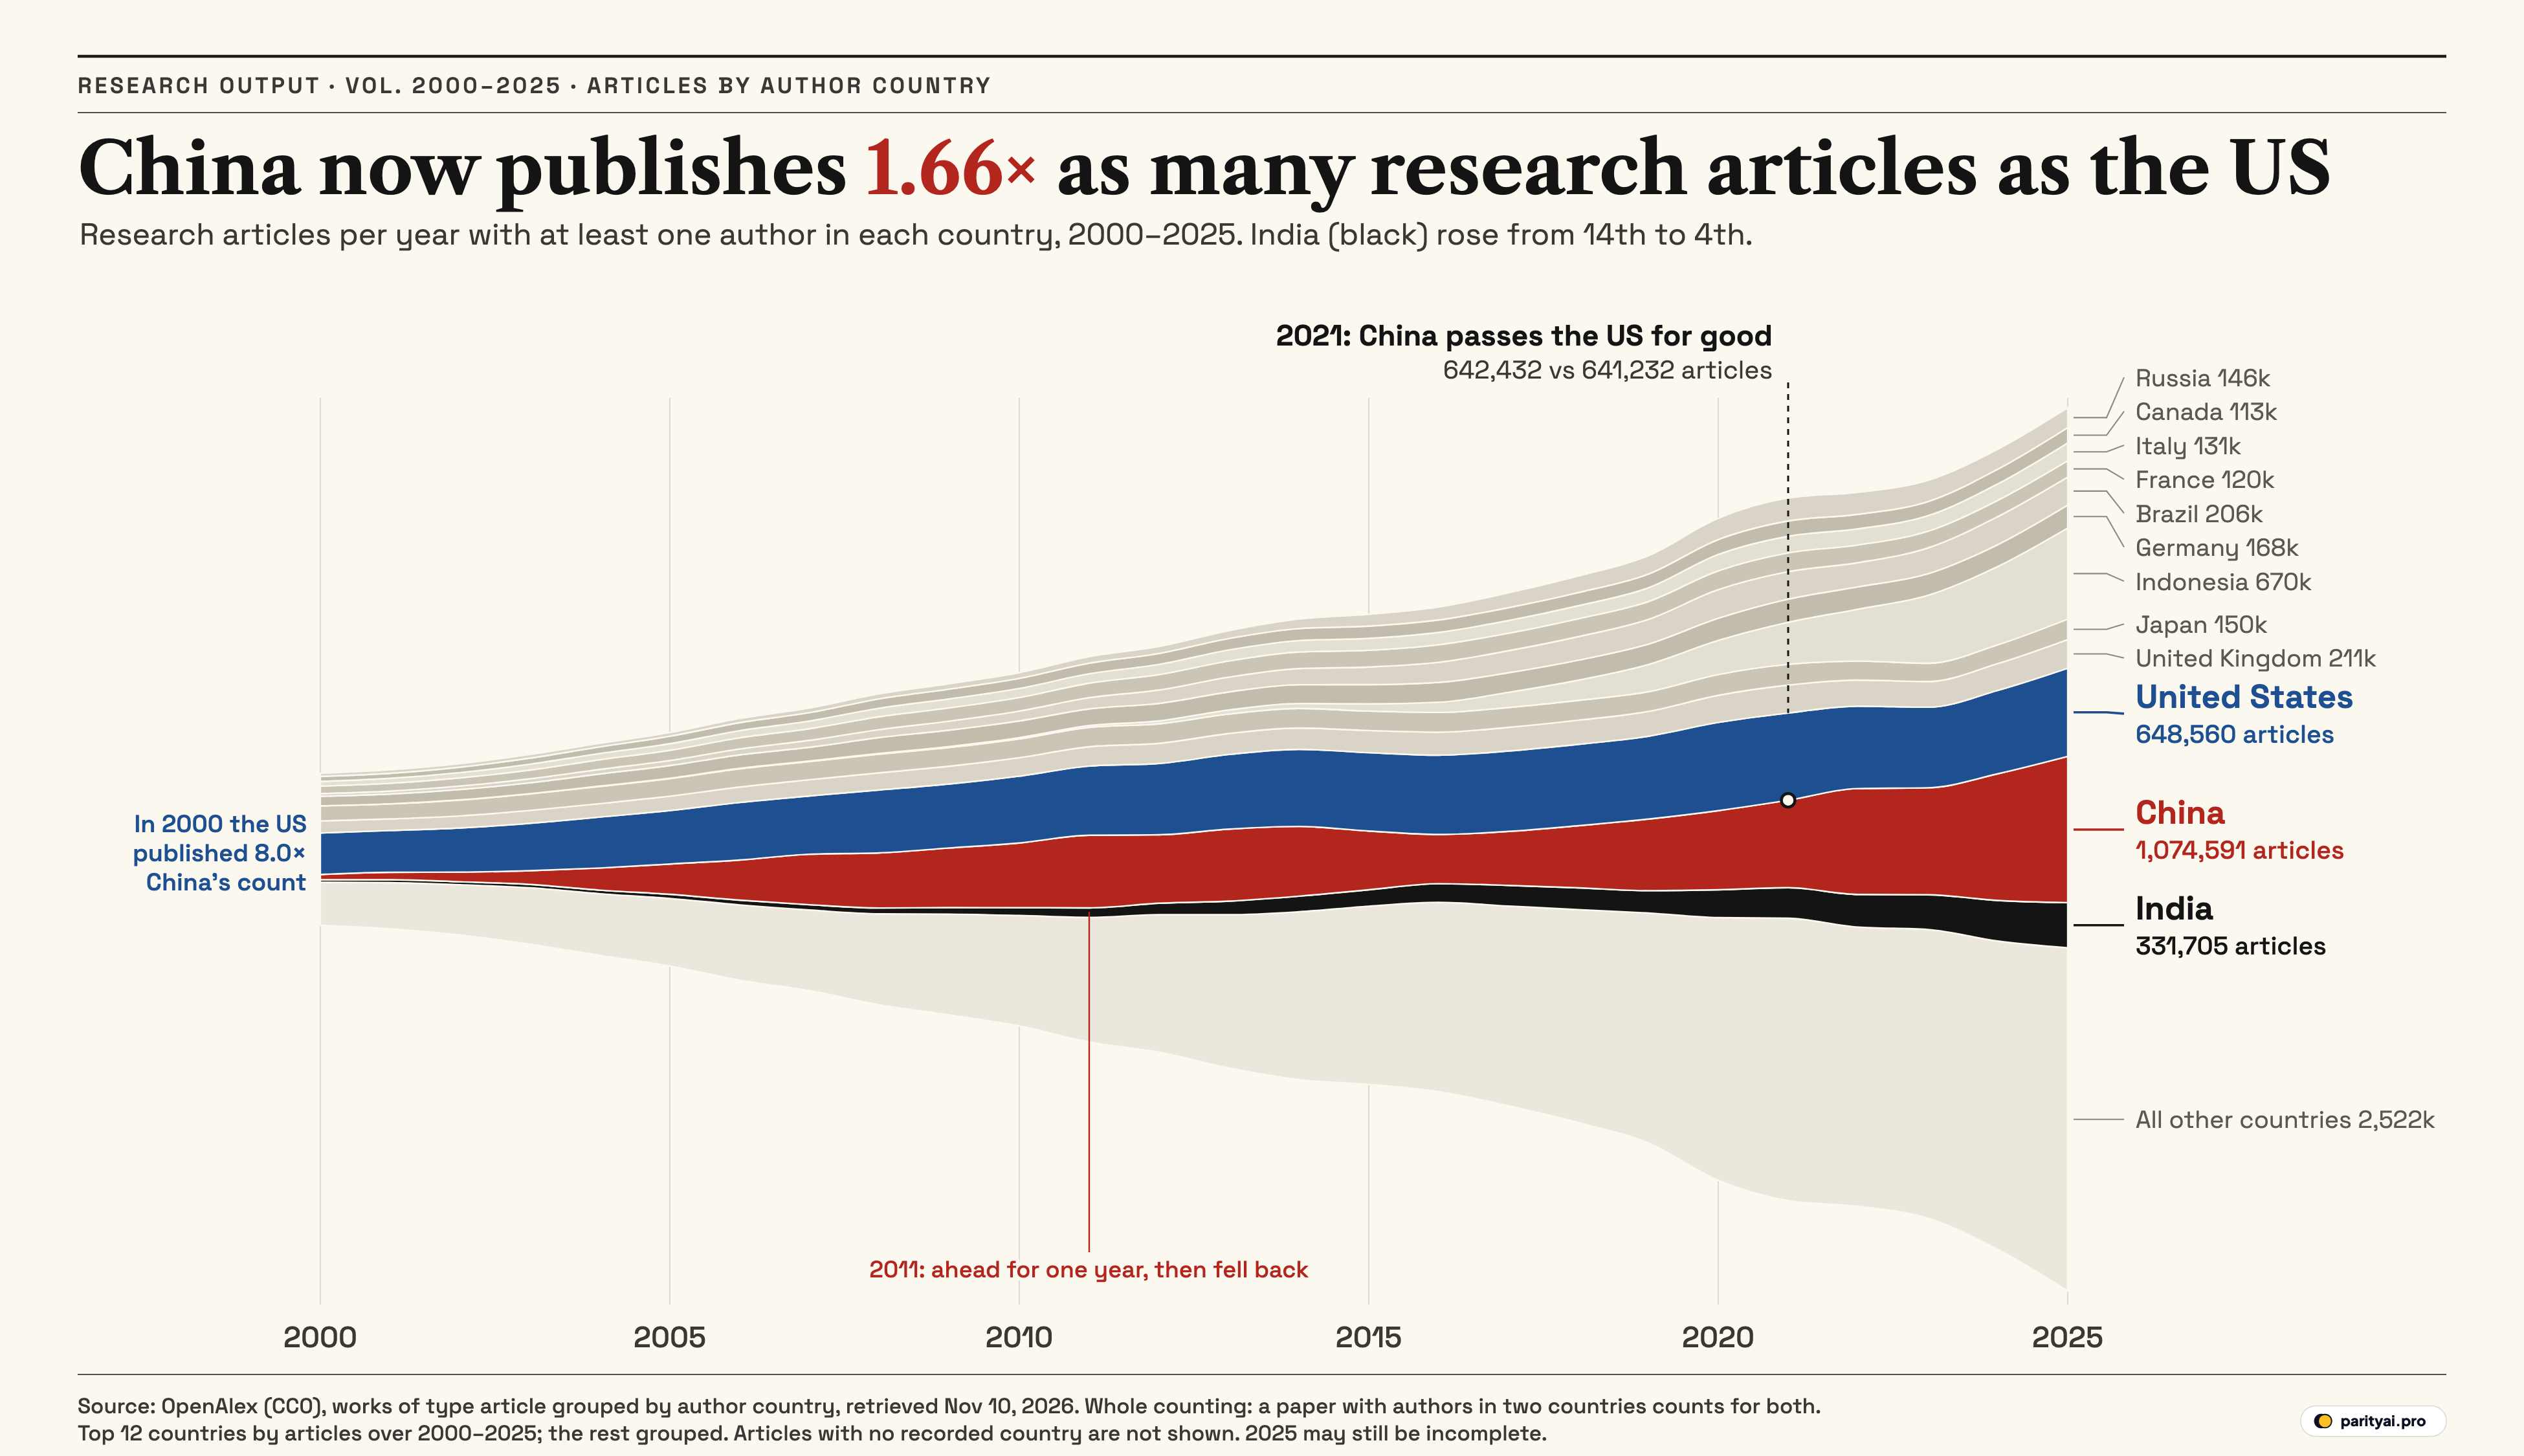
Try Parity freeIn 2021 the gap between the two largest producers of research articles on Earth was 1,200 papers. China's researchers had a hand in 642,432 articles that year and American researchers in 641,232, according to OpenAlex, the open index of scholarly work. That is a margin of less than a fifth of one percent. It was also the last year the race was close. By 2025 China stood at 1,074,591 articles and the United States at 648,560: China now publishes 1.66 times as many.
This piece is laid out like a reading list. Each section below is titled the way a paper might be, and each opens with its finding in one line, so you can skim the findings and read on where you want the evidence. The numbers come from 26 requests to the OpenAlex API, one per publication year from 2000 to 2025, each counting works of the type "article" by the countries of their authors' institutions.
How to read the stream
The graphic is a streamgraph. Time runs left to right, from 2000 to 2025. Each band is one country, and its thickness in any year is the number of articles that year with at least one author based there. The bands are stacked around a centre line rather than on a flat floor, which keeps them flowing and makes thickness, not height, the thing to read. The twelve countries drawn are the twelve with the most articles summed across all 26 years: United States, China, United Kingdom, Japan, Indonesia, Germany, India, Brazil, France, Italy, Canada, Russia. Everything else is the pale band at the bottom labelled "all other countries".
Three bands carry colour: China in red, the United States in blue and India in black. The others are grey on purpose. One annotation marks the year China's count passed America's for good, and a second, smaller one marks an earlier year when it passed and then fell back. The end labels give each country's 2025 total.
One rule governs every number here, and it is worth stating before the findings: this is whole counting. An article with authors in Beijing and Boston counts once for China and once for the United States. So the bands add up to more than the number of articles. In 2025 the countries' counts sum to 6,492,051, against 5,178,877 articles that have any author country at all, or 1.25 countries per article on average.
A Quarter-Century Census of Articles by Author Country, 2000–2025
Finding: the total grew, but China's share grew from 4% to 21% of country-tagged articles while America's fell from 31% to 13%.
OpenAlex lists 2,471,723 articles published in 2000 and 7,045,423 in 2025. Not all of them carry an author country, a point the caveats section returns to, but those that do show the shape of the story clearly. In 2000 the United States appeared on 305,633 articles and China on 38,173. American output was 8.0 times China's, and China ranked 6th, behind the United States, Japan, the United Kingdom, Germany and France.
American output did not shrink. It grew 112% over the period and reached its highest level in 2025, at 648,560 articles. China's grew about 28-fold. The US is not losing ground in absolute terms; it is being outpaced. A reader looking at the blue band will see it thicken steadily through the 2000s and 2010s and then hold roughly level after 2020, dipping 8% between 2021 and 2023 before recovering.
| Year | China | United States | India | China ÷ US |
|---|---|---|---|---|
| 2000 | 0.12 | |||
| 2001 | 0.18 | |||
| 2002 | 0.22 | |||
| 2003 | 0.29 | |||
| 2004 | 0.44 | |||
| 2005 | 0.57 | |||
| 2006 | 0.70 | |||
| 2007 | 0.86 | |||
| 2008 | 0.87 | |||
| 2009 | 0.93 | |||
| 2010 | 0.97 | |||
| 2011 | 1.05 | |||
| 2012 | 0.96 | |||
| 2013 | 0.96 | |||
| 2014 | 0.90 | |||
| 2015 | 0.75 | |||
| 2016 | 0.62 | |||
| 2017 | 0.67 | |||
| 2018 | 0.76 | |||
| 2019 | 0.86 | |||
| 2020 | 0.90 | |||
| 2021 | 1.00 | |||
| 2022 | 1.28 | |||
| 2023 | 1.33 | |||
| 2024 | 1.52 | |||
| 2025 | 1.66 |
Research articles in OpenAlex with at least one author affiliated with the country (whole counting). Highlighted: 2011, the first year China's count passed the US, and 2021, when it passed for good.
On a Premature Lead: China's 2011 Crossing and the Dip That Followed
Finding: China first passed the US in 2011, with 533,320 articles to 508,754, then fell back for nine years.
The thin red line at the foot of the chart marks 2011. That year's count is the only one before 2021 in which China's number exceeds America's; the full list of years with China ahead is 2011, 2021, 2022, 2023, 2024, 2025. What follows in the OpenAlex record is odd. China's count peaked at 533,320 in 2011 and then fell to 361,708 by 2016, a drop of 32%, before climbing again. You can see it in the graphic as a pinch in the red band around 2015 and 2016.
The data cannot say why. A real fall of a third in a country's research output over five years would be remarkable, and other counts do not show one: the US National Science Foundation's statistics arm, using Scopus, reported that China's output grew by 173% between 2012 and 2022. A dip like this in one index and not another points first at coverage and metadata, such as which journals were indexed and how many records have usable affiliations, rather than at the laboratories themselves. Treat the shape of the red band between 2011 and 2018 as a property of the index as much as of China.
Twelve Hundred Papers: On the Near-Tie of 2021
Finding: in OpenAlex, China passed the United States for good in 2021, by 1,200 articles.
The dashed line on the graphic marks the crossing. In 2020 the US still led, 648,088 to 581,920. In 2021 the order flipped by the slimmest of margins, and every year since has widened it: 778,357 to 605,881 in 2022, 930,742 to 613,094 in 2024, and 1,074,591 to 648,560 in 2025, a gap of 426,031 articles. China's count alone rose 15% between 2024 and 2025.
Other trackers put the crossing earlier. Scientific American reported the NSF finding that China had "overtaken the United States" in total science publications in 2016, using fractional counts of Scopus records. The NSF's 2020 indicators report gives both methods for 2018: China at 528,263 articles against America's 422,808 by fractional counting, and 584,407 against 548,847 by whole counting. In OpenAlex's whole counts for 2018 the US was still ahead, 597,996 articles to China's 456,742. The two indexes agree on the direction and disagree on the date, which is itself a lesson in how much the choice of database matters.
The most recent NSF figures are blunter. In 2022, it says, China held 27% of global output and the United States 14%, by fractional counting. Fractional counting gives each country only its share of each paper's authors. On OpenAlex's whole counts the 2025 ratio is 1.66 to one; on NSF's fractional Scopus counts for 2022 it was nearly two to one. Different methods, different gaps, the same order.
From Fourteenth to Fourth: A Longitudinal Study of India
Finding: India's count grew about 18-fold, from 18,105 articles to 331,705, and its rank rose from 14th to 4th.
The black band is the thinnest of the three highlighted ones in 2000, barely a line under the red. It thickens without a break. India ranked 14th in 2000, 12th in 2010 and 8th in 2015. It passed Germany and Japan in 2017 and the United Kingdom in 2020. In 2025 it sat fourth, behind China, Indonesia and the United States, with 6% of country-tagged articles, up from 2% in 2000.
That climb matches the independent record. NSF's 2020 report noted India's share of world output "rose from 2% to 5%" between 2000 and 2018, and the 2024 edition lists India as the third-largest producer in 2022, "followed by the United States, then by India". The only disagreement is that OpenAlex has a fourth country ahead of it, and that country needs its own section.
| # | Country | Articles, 2025 | 2000–2025 | Rank in 2000 | Places gained |
|---|---|---|---|---|---|
| 1 | China | 1,074,591 | 6 | 5 | |
| 2 | Indonesia | 669,745 | 57 | 55 | |
| 3 | United States | 648,560 | 1 | ▼ 2 | |
| 4 | India | 331,705 | 14 | 10 | |
| 5 | United Kingdom | 210,741 | 3 | ▼ 2 | |
| 6 | Brazil | 205,727 | 12 | 6 | |
| 7 | Germany | 168,289 | 4 | ▼ 3 | |
| 8 | Japan | 150,018 | 2 | ▼ 6 | |
| 9 | Russia | 145,844 | 11 | 2 | |
| 10 | Turkey | 138,477 | 27 | 17 | |
| 11 | Italy | 131,152 | 8 | ▼ 3 | |
| 12 | Spain | 126,003 | 9 | ▼ 3 | |
| 13 | France | 120,274 | 5 | ▼ 8 | |
| 14 | Canada | 112,994 | 7 | ▼ 7 | |
| 15 | Australia | 102,650 | 10 | ▼ 5 |
Whole counts of OpenAlex articles by author country. Places gained compares the 2025 rank with the 2000 rank among all countries.
An Unexpected Second Author: Indonesia in the Open Index
Finding: Indonesia climbed from 57th in 2000 to 2nd in 2025, passing the United States in 2025, with 669,745 articles.
The largest grey band in 2025, just above the blue, is Indonesia. In 2000 OpenAlex credits it with 1,001 articles. By 2015 that was 52,955, and by 2025 669,745, a little more than the American total. The likeliest explanation lies in the shape of OpenAlex's net.
Indonesia runs an enormous number of small journals. The Public Knowledge Project, which makes the free Open Journal Systems software, found that Indonesia "overwhelmingly accounts for the largest" community of its users, with 11,535 journals, or 45% of all installations, in 2022 data. A 2025 paper in Science Editing counts 10,482 journals nationally accredited and ranked in the country's SINTA index. Incentives push the same way: a 2017 policy, Times Higher Education reported, tied academics' salary bonuses to publication counts, and output surged while becoming heavily domestic. OpenAlex indexes far more of this long tail than the commercial databases do; one study counted 34,217 active open-access journals in OpenAlex against 7,351 in Scopus. Indonesia is grey on the graphic because the point of the chart is the China and US crossing, not because its band is wrong. It is a real count of what OpenAlex holds.
The Displaced: Japan and the Old Second Tier
Finding: Japan fell from 2nd to 8th while still growing, from 110,677 articles to 150,018.
In 2000 Japan was the clear runner-up to the United States. Its count is higher in 2025 than in 2000, though it has slipped in several years along the way, and every country that moved past it moved faster. The same holds for Western Europe. In 2025 the United Kingdom stood at 210,741 articles, Brazil at 205,727 and Germany at 168,289. Turkey, outside the twelve drawn, reached 138,477 and ranked 10th. The muted bands that make up the top of the stream are all thicker in 2025 than in 2000; what changes is how small they look beside the red one.
The pale band at the bottom is a reminder that the twelve are not the world. "All other countries" accounts for 2,522,411 country credits in 2025, more than China alone. Research is spreading, not only concentrating.
Limitations of the Present Study
Finding: the direction is solid; the exact numbers depend on choices worth knowing.
Whole versus fractional counting. As the NSF's method notes put it, under whole counting "a nation receives credit for any publication with an author from that nation", while fractional counting prorates each paper by authors' shares. Whole counting flatters countries that collaborate a lot. The graphic uses whole counts because that is what OpenAlex groups by; it is not the measure NSF headlines.
Missing countries. Many articles in OpenAlex carry no institution country at all, and they appear in no band. That was 61% of articles in 2000 and 56% in 2010, falling to 23% in 2022 and 26% in 2025. Because the share changes over time, part of every band's growth is better metadata, not more papers.
| Year | Articles in OpenAlex | No affiliation country | Share |
|---|---|---|---|
| 2000 | 2,471,723 | 61% | |
| 2005 | 3,554,562 | 59% | |
| 2010 | 4,980,958 | 56% | |
| 2015 | 5,960,866 | 53% | |
| 2016 | 5,982,826 | 52% | |
| 2020 | 6,117,218 | 38% | |
| 2021 | 5,747,560 | 30% | |
| 2022 | 5,400,025 | 23% | |
| 2025 | 7,045,423 | 26% |
All OpenAlex works of type article for the year, and those with no country on any authorship. Those articles appear in no band of the chart.
A moving index. OpenAlex was launched as a replacement for Microsoft Academic Graph when it retired at the start of 2022, and in November 2025 its "Walden" rebuild added 190 million new works, held in an expansion corpus that default queries, including ours, leave out. A team at SUB Göttingen found that the share of recent records with institution data in its sample fell to 61% in the September 2025 snapshot. Counts for the same year can shift between retrievals; ours are from November 10, 2026.
Articles, not all works. Only works typed "article" are counted, which leaves out books, preprints, conference papers and datasets. Fields where conference papers carry much of the work count for less here than their activity suggests.
Recent-year lag. Journals and repositories keep reporting long after a year ends, so 2025, and to a lesser degree 2024, will probably rise in later retrievals.
Coverage beyond the big databases. An analysis comparing OpenAlex with Scopus found it is "a superset of Scopus" and reliable for country-level work, which is why the long tail, including Indonesia's journals, shows up here at all.
Concluding Remarks: What a Paper Count Measures
Finding: China now appears on more articles than any other country by a wide margin, and that holds whatever reasonable count you pick.
A count of articles is a measure of activity, not of quality or influence. China's own ministries said as much in February 2020, when they called for a break from "SCI-supremacy" and told institutions that paper counts in the Science Citation Index should not be a direct basis for promotions. Indonesia's band shows how incentives and open software can multiply output in a decade. Neither is a reason to dismiss the red band. Fractional or whole, Scopus or OpenAlex, the numbers point the same way: in a quarter of a century, the country that wrote one article for every eight of America's now writes five for every three, and it has pulled further ahead in every year since 2021.
Sources and method
- OpenAlex (OurResearch): works API, grouped by authorships.countries. Articles (type: article) by publication year, 2000–2025, retrieved November 10, 2026. Data released under CC0. Please cite: Priem, J., Piwowar, H., & Orr, R. (2022). OpenAlex: A fully-open index of scholarly works, authors, venues, institutions, and concepts. arXiv:2205.01833.
- NCSES / National Science Board: Publications Output: U.S. Trends and International Comparisons (NSB-2023-33). Scopus-based fractional counts, quoted for comparison.
Counts come from the OpenAlex works API with filter publication_year:YYYY,type:article and group_by=authorships.countries, one request per year (default core corpus), keeping the 200 largest country groups each year (the API's page limit; any countries beyond them held fewer articles than the 200th, at most a few dozen). This is whole counting: an article counts once for every country among its authors' affiliations, so an article with authors in China and the United States counts for both, and the country bands add up to more than the number of articles. Articles with no affiliation country (a large share, especially before 2010) are counted in OpenAlex's yearly totals but in no country band. The twelve countries drawn are those with the most articles summed over 2000–2025; every other country is grouped. The streamgraph uses a wiggle baseline, centred. OpenAlex changes its metadata over time (including the November 2025 'Walden' rebuild), so counts for the same year can shift between retrievals, and the most recent year is still being filled in as journals and repositories report.
Charts like this, from your own numbers.
Connect a spreadsheet or the tools you run on, and Parity builds the dashboard and writes the report, with every number checked.
Try Parity free

