Charts like this, from your own numbers.
Connect a spreadsheet or the tools you run on, and Parity builds the dashboard and writes the report, with every number checked.
Try Parity freeThe doors close at ground level and the car starts to climb. At 414 kilometres it passes the International Space Station, which takes about 92.95 minutes to circle the planet. By 500 kilometres it has passed more than ten thousand working satellites, most of them owned by one company. Around 800 kilometres the car slows down among thousands of fragments from collisions and weapons tests nearly twenty years old. At 35,786 kilometres the doors open onto a ring of satellites that seem to hang still over the equator.
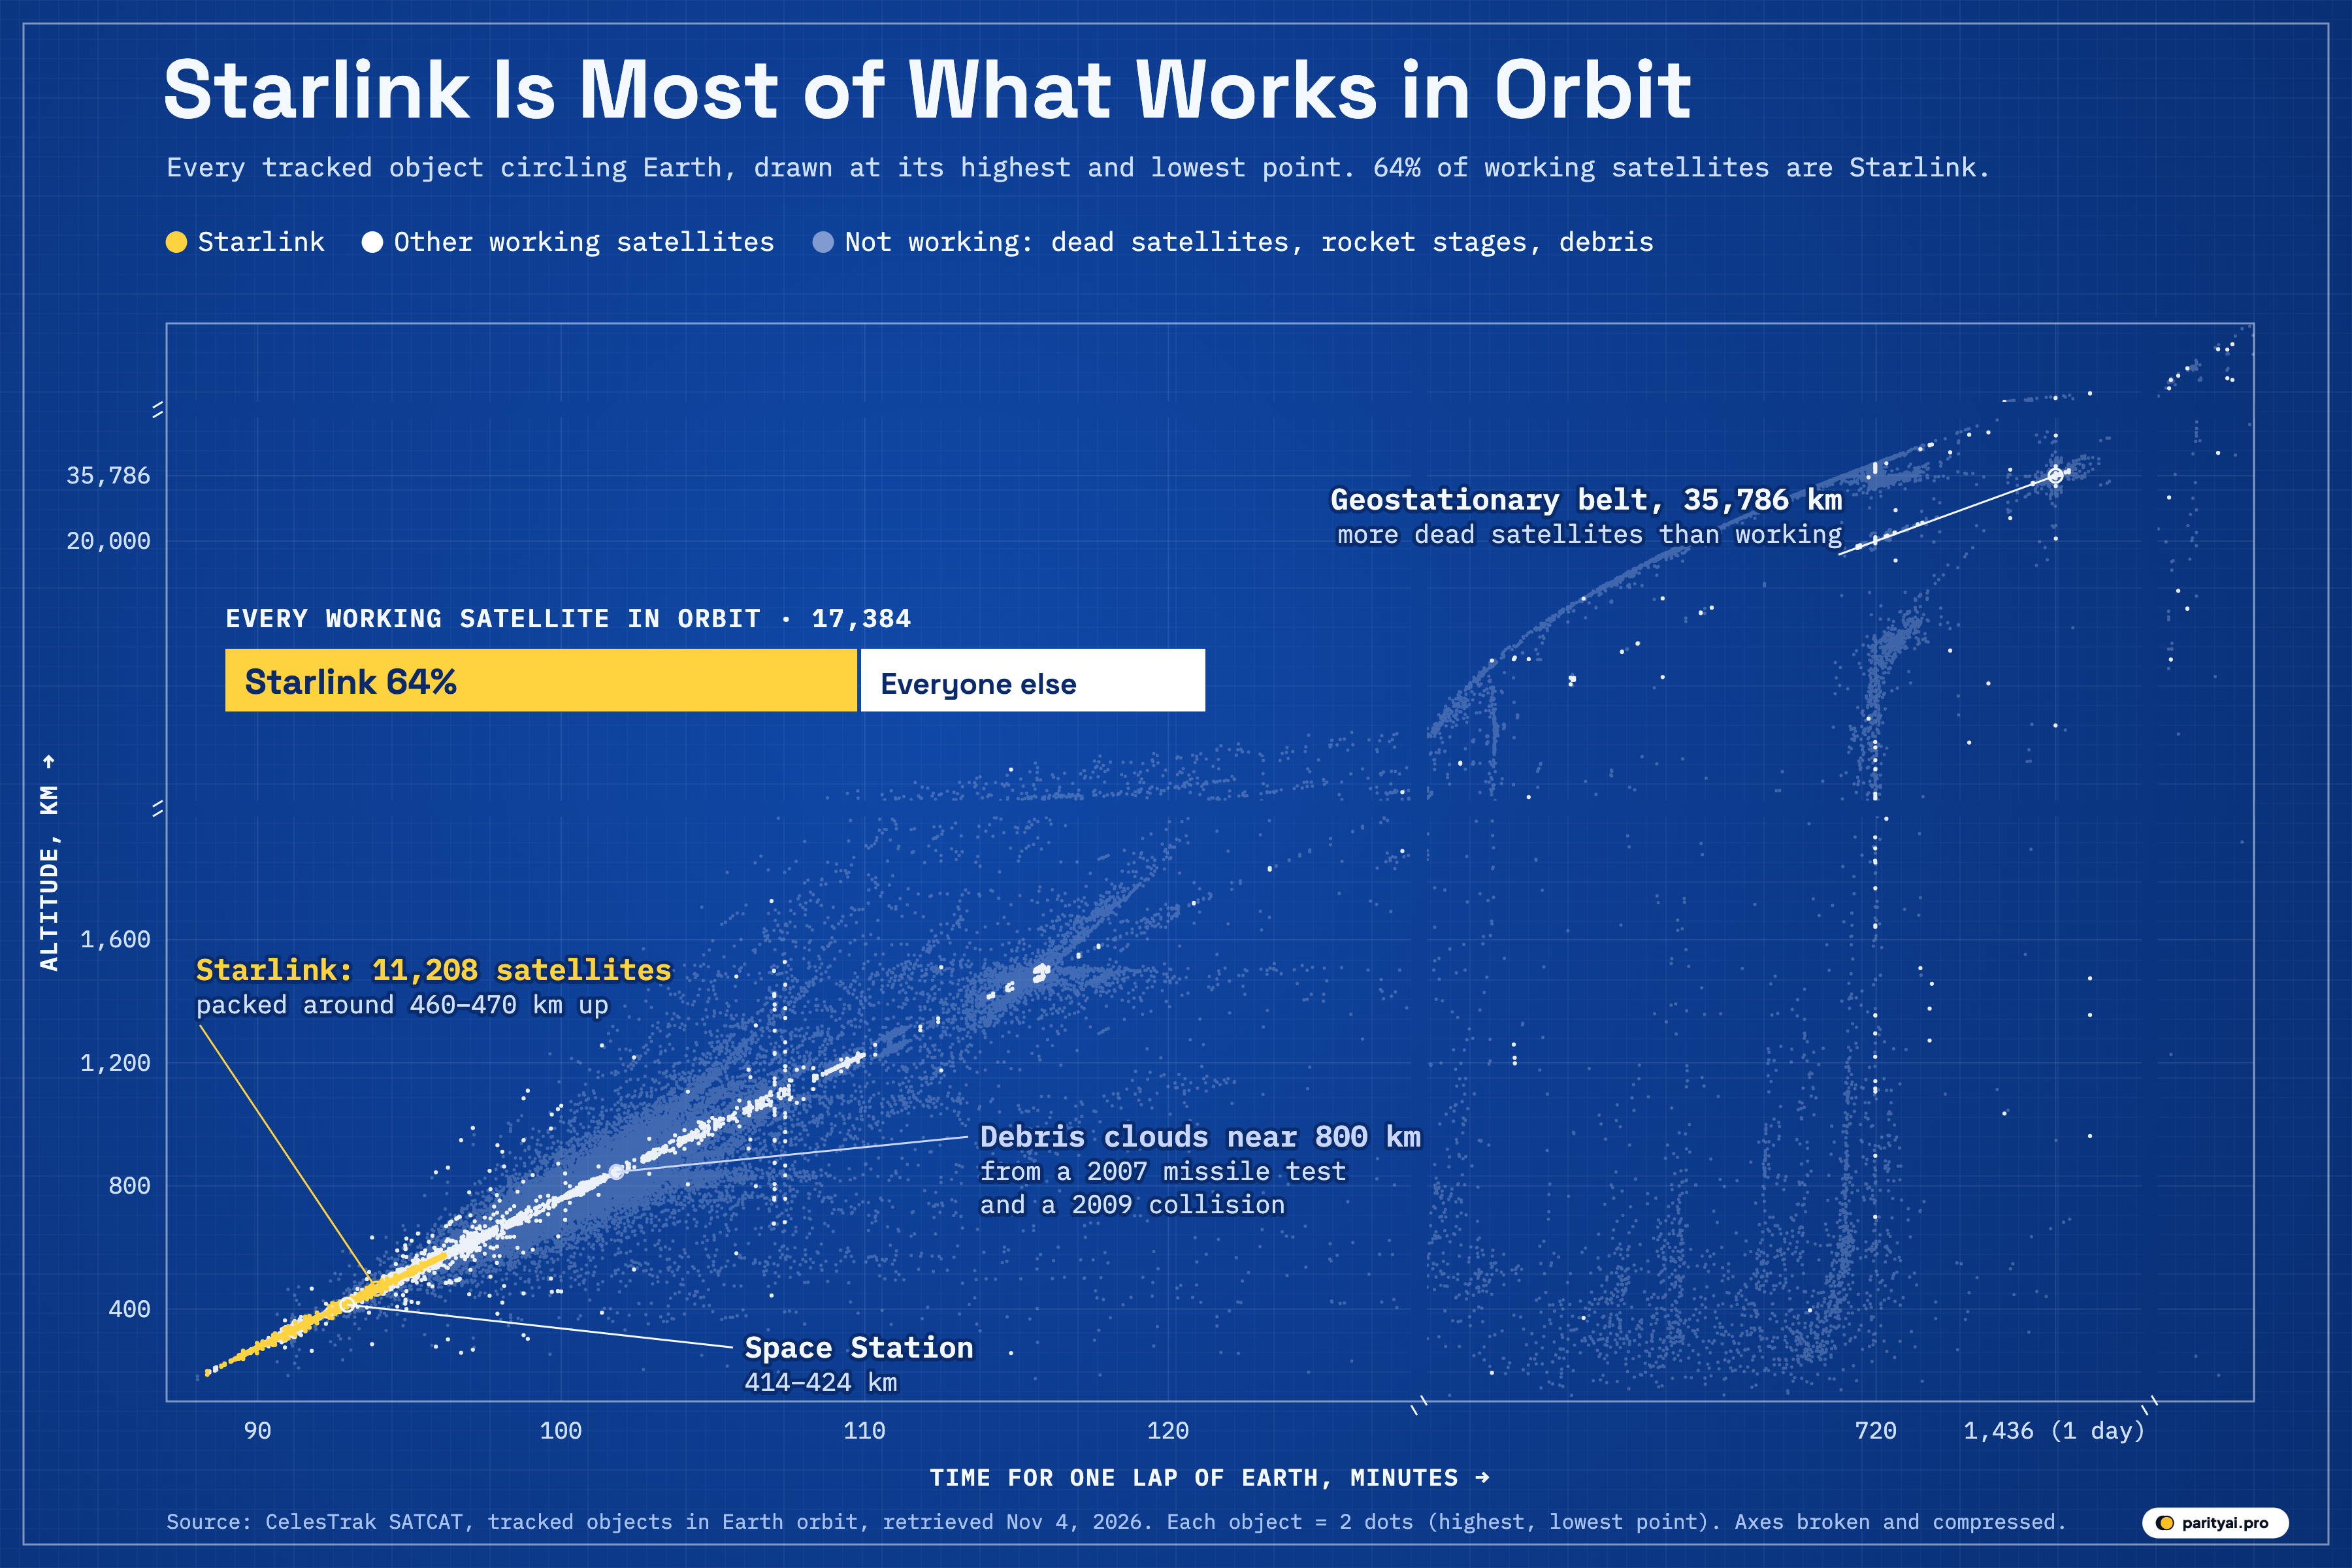
This article makes that ride floor by floor, using the public satellite catalogue that CelesTrak republishes from US tracking data. On November 4, 2026 the file listed 71,262 catalogued objects. 35,774 of them have already come down. 35,170 are still circling Earth, and 11,208 of those are working Starlink satellites, 64% of all 17,384 active satellites in the catalogue.
Lobby: reading the drawing
The graphic is a Gabbard diagram. The form is old: debris analysts use scatter plots "where the perigee and apogee of fragments are plotted with respect to their orbital period" to trace what happened when something broke up. It is named after John Gabbard, a NORAD employee who developed a technique for predicting where the fragments of exploded rocket stages would go, and who also coined the term "Kessler syndrome". Here it is used for the whole catalogue rather than one breakup.
Each object appears twice. The horizontal position is its orbital period, the minutes it takes to go once around Earth. The vertical position is its altitude, once at apogee (its highest point) and once at perigee (its lowest). An object on a near-circular orbit has two dots at almost the same height, so they merge into one. An object on a long ellipse has one dot high up and its twin far below it, at the same period. That is why the long, stretched orbits on the right half of the chart show up as tall vertical gaps.
The axes are stretched to fit. Below 128 minutes, which covers all of low Earth orbit, period and altitude run on even scales, so the dense band gets most of the room. Above that, both axes switch to a log scale and are compressed, with break marks where they change. The 34,838 objects with published orbits make 69,676 dots.
The chart uses only three colours. Yellow is Starlink. White is every other working satellite, using CelesTrak's definition that "Active is any satellite with an operational status of +, P, B, S, or X" (operational, partially operational, backup, spare or extended mission). Grey is everything that does not work. The catalogue splits that grey mass into three types. Payloads are satellites, here ones that are switched off, failed or have no stated status. Rocket bodies are the spent upper stages left in orbit after a launch. Debris is fragments, shrouds, lens caps and anything else that came off a launch or a breakup. The 8 objects the catalogue types as unknown are counted with debris. The tables below break the grey into those types.
"In orbit" here means a catalogue entry with no decay date whose orbit centre is Earth. That rule leaves out 318 objects that never came back but now orbit the Sun, the Moon or another planet.
Below 400 km: the arrivals hall
The lowest floor is short-lived. Air drag is strong enough here that nothing stays long without pushing back. The catalogue has 1,408 objects averaging under 400 kilometres. 1,050 of them are Starlink satellites. China's Tiangong station sits on this floor at 381–387 km.
There is almost no debris on this floor: 17 pieces, 1% of everything here. Whatever stops working at this height does not stay up long. ESA's 2025 space environment report notes that intact satellites or rocket bodies now fall back "on average more than three times a day."
400–500 km: one company's floor
This is the busiest floor in the building. 10,982 objects average between 400 and 500 kilometres, and 9,901 of them are Starlink satellites. On the diagram they are the bright yellow knot at the lower left, just above the space station.
The single busiest 10-kilometre shell in the whole catalogue is 460–470 km. It holds 5,071 objects, 4,954 of them Starlink. The next-busiest Starlink shell, 480–490 km, holds another 3,240. Half of all working Starlink satellites average below 466 km.
Between 400 and 600 km there are 13,277 objects, and 77% of them are Starlink. Across all of low Earth orbit, Starlink makes up 39% of the catalogued objects, and 32% of everything in orbit at any height.
The table below is the full ride, floor by floor. The highlighted row is the Starlink floor.
| Floor (average altitude) | Objects | Starlink | Other active | Inactive payloads | Rocket bodies | Debris | Debris share |
|---|---|---|---|---|---|---|---|
| Below 400 km | 1,050 | 290 | 24 | 27 | 17 | ||
| 400–500 km | 9,901 | 852 | 60 | 64 | 105 | ||
| 500–600 km | 257 | 1,523 | 98 | 83 | 334 | ||
| 600–700 km | 0 | 770 | 130 | 118 | 1,030 | ||
| 700–800 km | 0 | 196 | 233 | 155 | 2,162 | ||
| 800–900 km | 0 | 128 | 134 | 118 | 2,532 | ||
| 900–1,000 km | 0 | 205 | 276 | 211 | 1,256 | ||
| 1,000–1,500 km | 0 | 1,275 | 617 | 162 | 1,990 | ||
| 1,500–2,000 km | 0 | 7 | 98 | 59 | 429 | ||
| Medium Earth orbit | 0 | 185 | 238 | 161 | 196 | ||
| Geostationary belt | 0 | 632 | 708 | 231 | 122 | ||
| Above the belt | 0 | 5 | 53 | 50 | 18 | ||
| Highly elliptical | 0 | 60 | 219 | 809 | 2,175 |
Low Earth orbit floors use the average of apogee and perigee. Higher floors use the bands in the method note. Objects without orbital data are not included.
500–700 km: mixed tenants
Above 500 kilometres the mix changes. The 500–600 km floor holds 2,295 objects: 1,780 active satellites (only 257 of them Starlink), 98 inactive payloads, 83 rocket bodies and 334 pieces of debris. The Hubble Space Telescope is just below this floor at 468–471 km.
The 600–700 km floor is the turning point. Half of its 2,048 objects, 1,030, are debris, and only 770 are active. Below this height the catalogue is mostly working satellites. Above it, mostly not.
ESA's report makes the same point from its own modelling: near 550 km there is "the same order of magnitude of debris objects posing a threat as there are active satellites," once fragments too small to track are counted. The catalogue shows only the trackable part of that debris.
700–1,000 km: the debris floors
From 700 to 1,000 kilometres the elevator passes through the worst-polluted part of low Earth orbit. These three floors hold 7,606 catalogued objects. 5,950 of them, 78%, are debris. Only 529 are active satellites. On the 800–900 km floor the debris share reaches 87%.
Most of this debris comes from a few events:
- Fengyun-1C. On 11 January 2007, China destroyed one of its own weather satellites, at about 860 kilometres, with a missile. The catalogue still lists 2,310 pieces of it in orbit, more than any other source of debris. Half of them average below 832 km.
- Iridium 33 and Cosmos 2251. On February 10, 2009, a working Iridium communications satellite and a dead Russian military satellite collided at 789 km. It was the first accidental high-speed collision between two intact satellites. 606 pieces of Cosmos 2251 and 115 of Iridium 33 are still catalogued.
- Long March 6A upper stages. Two Chinese upper stages broke up after launches in November 2022 and August 2024. Space.com reported that the 2024 breakup created "more than 300 pieces of trackable debris" at first. The catalogue now lists 612 fragments from the 2022 launch and 573 from the 2024 one. Half of all CZ-6A fragments average below 792 km.
A NASA library guide says that "the deliberate destruction of the Chinese Fengyun-1C spacecraft in 2007" and "the accidental collision of an American and a Russian spacecraft in 2009" together increased the large debris population in low Earth orbit by about 70%. On the diagram, these fragments are the grey haze around the diagonal between roughly 100 and 105 minutes.
Not every breakup stays up for long. When Russia destroyed its Kosmos 1408 satellite in a missile test on 15 November 2021, the State Department reported about 1,500 trackable pieces. Within a day its debris was orbiting between 440 and 520 km, lower and in thicker air than the 2007 and 2009 clouds, and today the catalogue lists only 4 pieces of it still in orbit. Height decides how long debris lasts.
1,000–2,000 km: the quiet top floors
Above 1,000 kilometres the elevator thins out. The 1,000–1,500 km floor holds 4,044 objects, 1,275 of them active. Most of OneWeb's 651 active satellites, all under the UK owner code, fly here, near 1,200 km. Debris is still 49% of the floor. The last floor of low Earth orbit, 1,500 to 2,000 km, has 593 objects and only 7 active satellites.
The short grey streak on the diagram near 115 minutes, around 1,400 km, is a cluster of 442 inactive payloads. 402 of them are Soviet and Russian Cosmos satellites. None is listed as active.
The long gap and the navigation floor
Past 2,000 kilometres the car climbs a long way with little to see. Medium Earth orbit, the band between low orbit and the geostationary ring, has only 780 objects with both apogee and perigee inside it. The main group is the navigation satellites: GPS satellites orbit at about 20,180 km in six planes, and Europe's Galileo, Russia's GLONASS and China's BeiDou use similar heights. The catalogue counts 40 active satellites named NAVSTAR, the GPS series. On the diagram they are the white cluster near 720 minutes, two laps a day.
This band holds 185 active satellites, 238 inactive payloads, 161 rocket bodies and 196 pieces of debris. No Starlink satellites fly here.
35,786 km: the ring
At 35,786 kilometres the car stops at the geostationary belt, a circular orbit where a satellite takes one sidereal day to circle Earth and so seems to stay over one spot on the equator. On the diagram it is the knot of white and grey dots at 1,436 minutes.
The belt has 1,693 catalogued objects by this story's definition. 632 are active. 708 are dead or of unknown status, more than the active ones. There are also 231 rocket bodies and 122 pieces of debris. Just above the belt, 126 more objects have a lowest point higher than 34,000 km but fall outside this story's window for the belt.
Between floors: the long ellipses
3,263 objects don't fit any floor. Their orbits are stretched ellipses with a low point in or near low orbit and a high point thousands of kilometres up. Each one draws a vertical gap on the diagram, with one dot high and one low.
The most stretched are the 668 objects with a perigee below 2,000 km and an apogee above 30,000 km, the shape of the transfer orbits used to reach the geostationary belt. A separate column near 720 minutes, two laps a day, holds 401 objects with apogees above 30,000 km, the Molniya-type orbits. 282 of them are under the Russia (and Soviet) code. Across all the long ellipses there are 809 rocket bodies and 2,175 pieces of debris, against 60 active satellites.
Who owns the building
The catalogue assigns every object to an owner, and debris belongs to whoever owned the object it broke off. The United States owns 18,511 objects, 53% of everything in orbit, and 13,122 of the active satellites. Take away Starlink and the US total falls to 7,303.
Russia's code covers the Soviet Union too. It accounts for 6,601 objects, but only 374 are active, with 3,890 pieces of debris and 1,038 rocket bodies. China owns 6,182 objects: 1,574 active satellites and 4,233 pieces of debris, more than half of it from Fengyun-1C. China's new broadband constellations are still small next to Starlink: the catalogue has 257 active Qianfan satellites and 252 named Hulianwang. Amazon's Kuiper has 391.
| # | Owner (SATCAT code) | All objects | Active satellites | of which Starlink | Debris | Rocket bodies |
|---|---|---|---|---|---|---|
| 1 | United States | 11,208 | 3,910 | 680 | ||
| 2 | Russia (incl. Soviet Union) | — | 3,890 | 1,038 | ||
| 3 | China | — | 4,233 | 285 | ||
| 4 | United Kingdom | — | 0 | 1 | ||
| 5 | France | — | 351 | 160 | ||
| 6 | Japan | — | 35 | 46 | ||
| 7 | India | — | 35 | 42 | ||
| 8 | Owner not yet assigned | — | 0 | 0 | ||
| 9 | Intelsat | — | 49 | 0 | ||
| 10 | European Space Agency | — | 11 | 8 | ||
| 11 | Germany | — | 0 | 0 | ||
| 12 | Italy | — | 0 | 1 |
Owner is the SATCAT owner code: the country or organisation responsible. The former Soviet Union and Russia share one code (CIS). Debris is assigned to the owner of the object it broke off.
How new the building is
Much of what is in orbit is recent. Half of everything still up, 17,696 objects, was launched in 2020 or later, and 15,938 of those are active satellites. 4,480 objects launched in 2025 are still up, more than from any other year, and 3,789 from 2026 so far. For comparison, only 197 objects launched in 2015 remain.
The one older year that stands out is 1999, with 2,599 objects. 2,467 of them are debris, because the catalogue dates fragments by their parent's launch, and Fengyun-1C went up in 1999. The oldest object still in orbit is Vanguard 1, launched in 1958, still going between 651 and 3,819 km.
| Launched | Still in orbit | Year by year | Active now | Debris |
|---|---|---|---|---|
| 1957–1979 | 13 | 3,076 | ||
| 1980–1999 | 67 | 5,957 | ||
| 2000–2009 | 264 | 989 | ||
| 2010–2019 | 1,102 | 1,182 | ||
| 2020–2022 | 3,101 | 652 | ||
| 2023–2024 | 4,824 | 592 | ||
| 2025–2026 | 8,013 | 97 |
Debris is dated by the launch of the object it came from, so the 2007 Fengyun-1C breakup counts under 1999. 2026 covers launches to November 2.
Roof access: what the catalogue leaves out
The catalogue is a list of objects that tracking networks can follow and that have been formally catalogued. It is not a census of everything up there.
- Small debris is mostly missing. The catalogue has 12,537 debris objects. ESA estimates over 1.2 million objects larger than 1 cm, and over 50,000 larger than 10 cm. Most objects that could badly damage a spacecraft are not on this chart.
- Some objects have no orbit. 332 objects in orbit have no published period or altitude, so they are not drawn. 301 of them are listed under the United States. The file doesn't say why, but objects whose orbits are kept secret would look like this. In all, 818 catalogue entries are marked "No Elements Available".
- Active is a label, not a measurement. The active count depends on the status codes CelesTrak assigns. ESA counted "about 11 000" active payloads among about 40,000 tracked objects at the end of 2024. That was a different date, a different source and a different definition, so the figures don't line up exactly.
- The bands are this story's own. The limits used here (2,000 km for low orbit, a window around 35,786 km for the belt) are common conventions, not official boundaries. An object counted on one floor can drift to the next.
Back down
ESA's report states that "even without any additional launches, the number of space debris would keep growing." That is the scenario Donald Kessler and Burton Cour-Palais described in 1978, in which collisions make debris faster than the air can clear it. The diagram shows the two halves of that problem on separate floors.
The lowest floors are full but new. Of the 14,685 objects averaging below 600 km, 89% were launched in the past five years, and most belong to one operator. The floors from 700 to 1,000 kilometres are the reverse: fewer satellites, and fragments from 2007 and 2009 that will stay for a long time. The geostationary ring has more dead or silent satellites than working ones.
On the way down, the elevator passes 11,208 yellow dots. The first of them went up in May 24, 2019. Seven and a half years later, they make up 64% of every active satellite in the catalogue.
Sources and method
- CelesTrak, SATCAT (satellite catalogue) CSV. Retrieved November 4, 2026; objects with no decay date orbiting Earth
- Space-Track.org, 18th Space Defense Squadron: the public satellite catalogue CelesTrak's SATCAT is built on
- CelesTrak, SATCAT operational status codes
- ESA Space Environment Report 2025
Objects are every SATCAT entry with no decay date and Earth as the orbit centre. Each object with orbital elements is drawn twice: at its apogee (highest altitude) and its perigee (lowest altitude), both at its orbital period. Active means an operational status of operational, partially operational, backup, spare or extended mission, as CelesTrak defines it; payloads with any other status (including blank) are grouped as inactive or unknown. Starlink means payloads whose catalogue name starts with STARLINK. The eight objects typed unknown are grouped with debris. Altitude bands: low Earth orbit has apogee below 2,000 km; medium Earth orbit has perigee at or above 2,000 km and apogee below 34,000 km; geostationary has perigee above 34,000 km and apogee below 37,600 km with a period of 1,400–1,480 minutes; everything else is highly elliptical or beyond. Owners are SATCAT owner codes. Debris is dated by the launch of the object it came from. The catalogue holds only tracked, catalogued objects of roughly 10 cm and larger; classified objects may be listed without orbits.
Charts like this, from your own numbers.
Connect a spreadsheet or the tools you run on, and Parity builds the dashboard and writes the report, with every number checked.
Try Parity free

