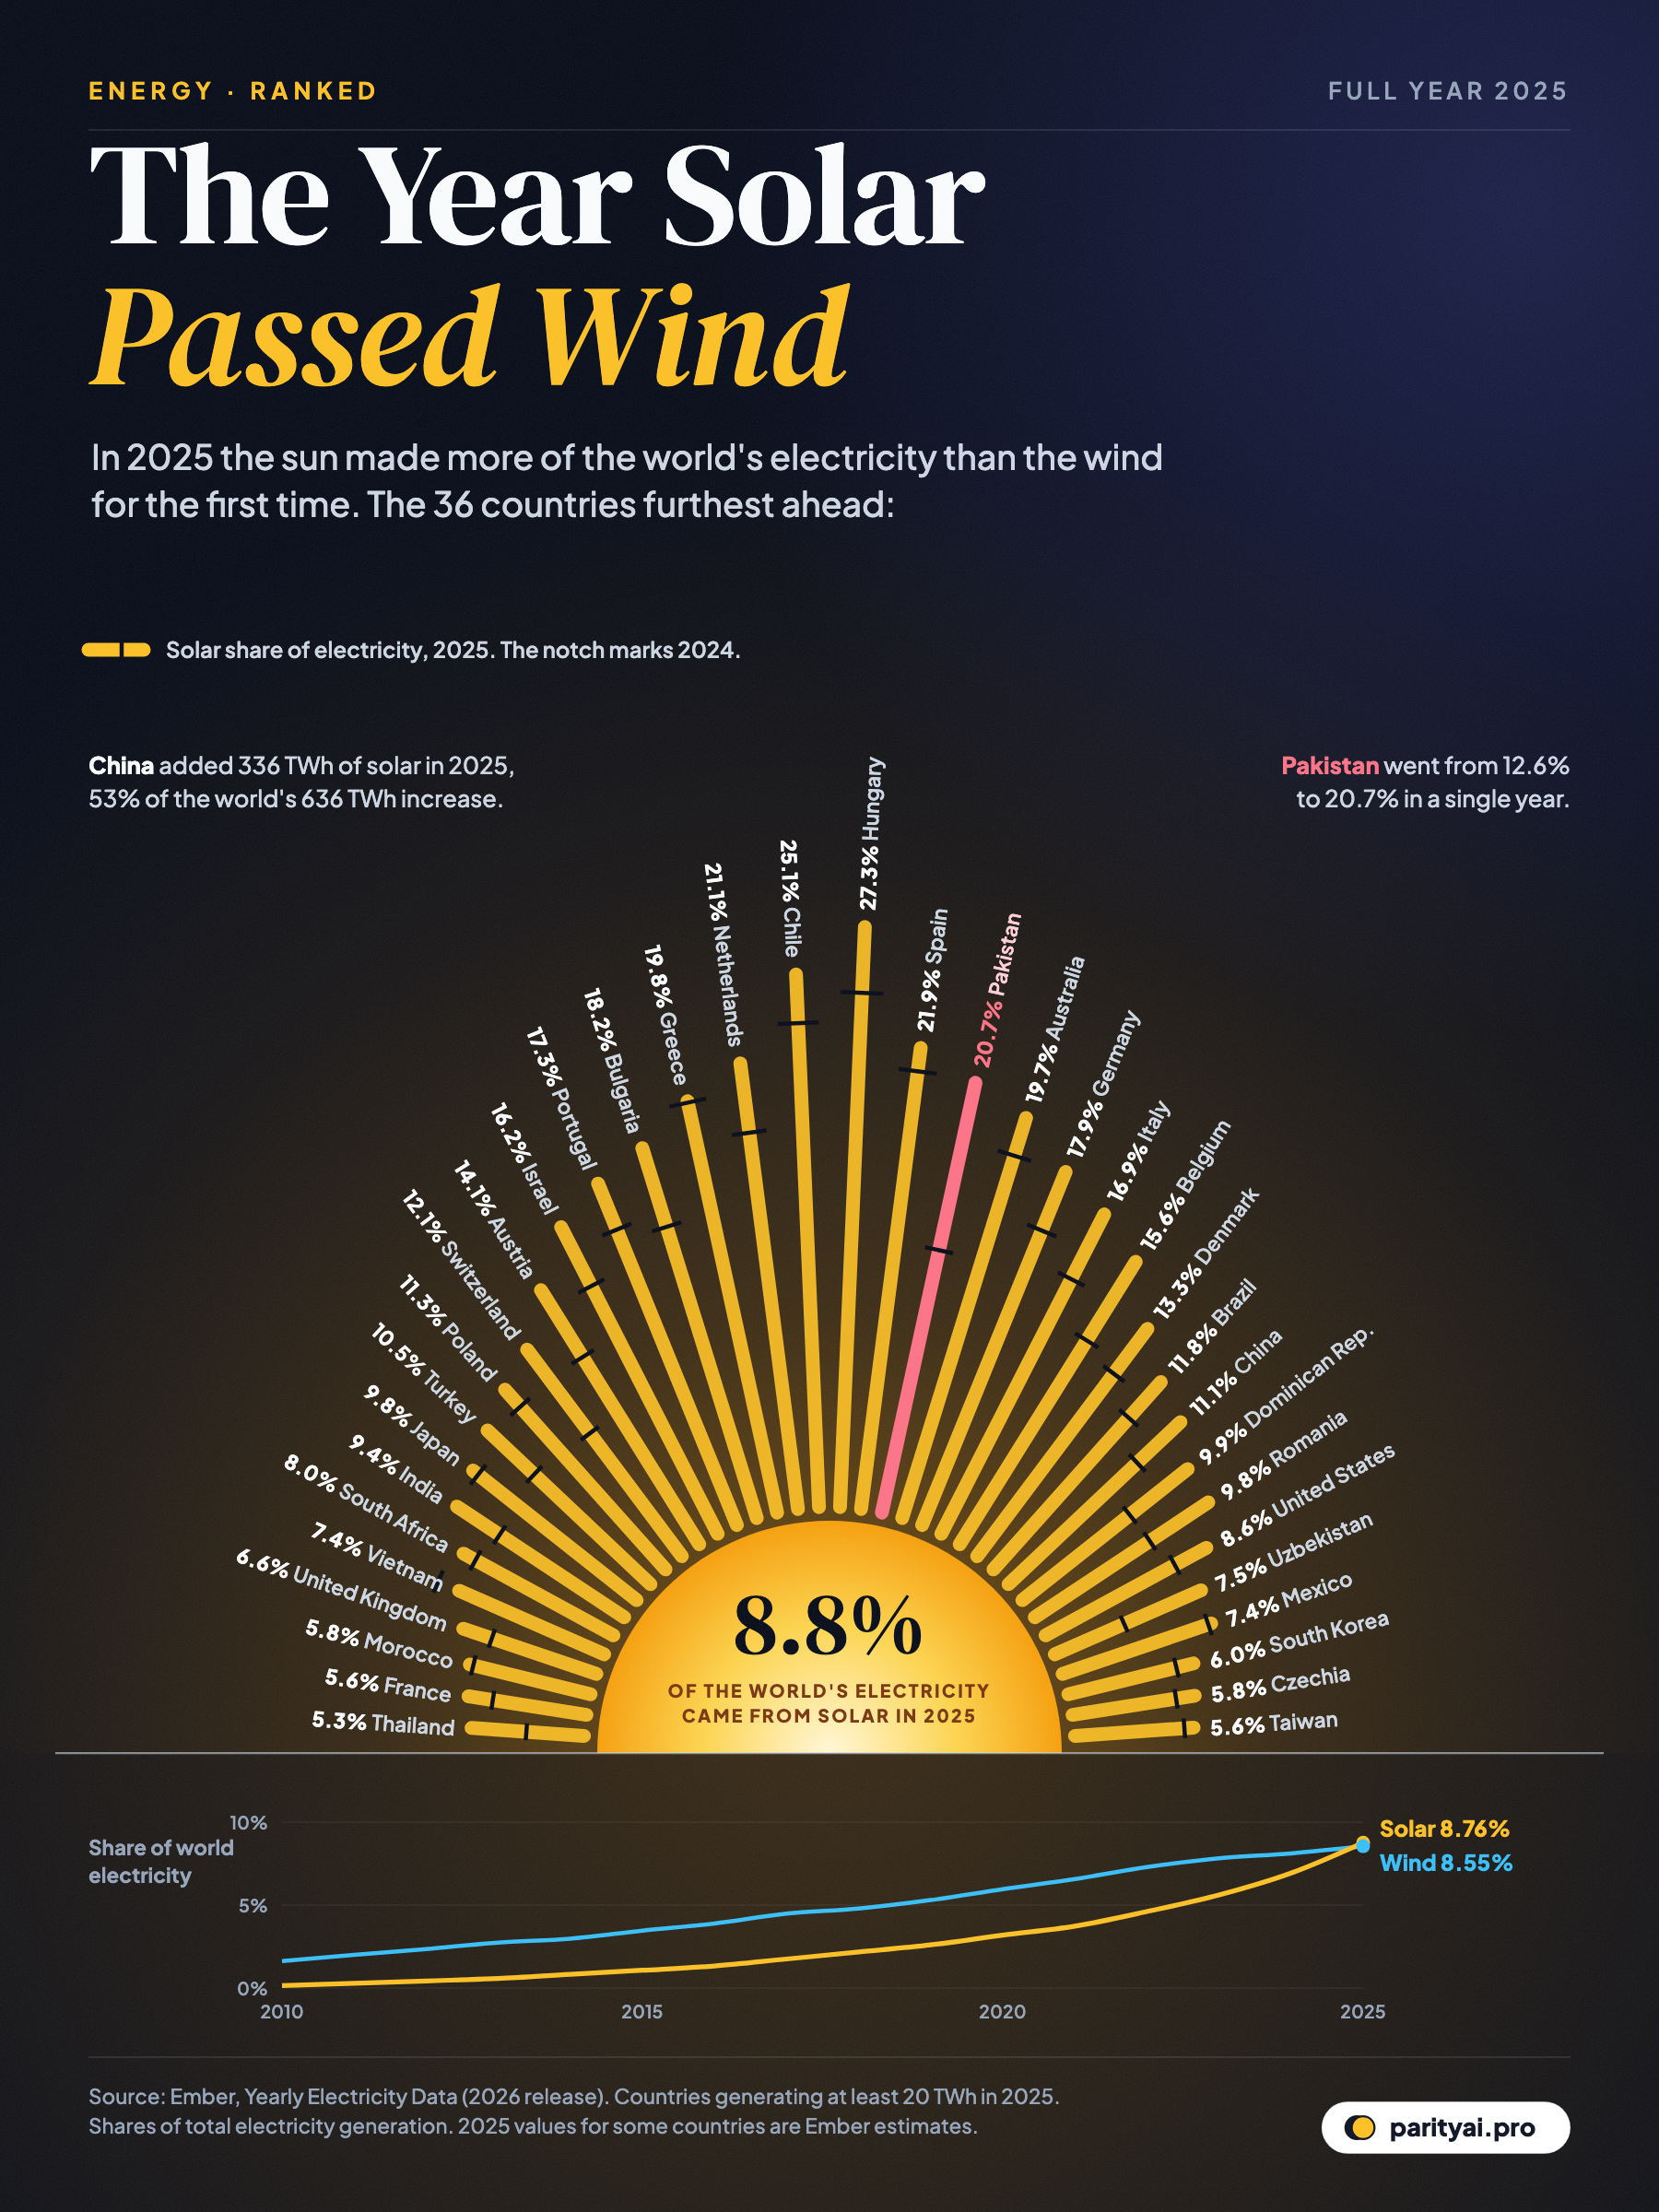
Ten years ago, solar power was a rounding error. In 2015 it supplied 1.1% of the world's electricity. In 2025 it supplied 8.76%, and for the first time it made more electricity than the world's wind turbines.
Our chart shows where that shift has gone furthest. Picture a sunrise in which each ray is a country. Its length is the share of that country's electricity that came from solar in 2025, and the dark notch on each ray marks where it stood in 2024. The biggest shares sit at the top of the sunrise and fall away towards the horizon. Below the horizon, the two lines trace solar and wind's share of world electricity since 2010 and meet in 2025.
The data comes from Ember, an energy think tank that compiles electricity statistics for more than 200 countries. We ranked the 36 countries with the highest solar shares among the 66 that generated at least 20 TWh of electricity in 2025 and have 2025 data in Ember's release. Very small grids are left out because one new solar farm can swing their share.
The crossover
Wind had a long head start. Turbines were already making 8.1% of the world's electricity in 2024, while solar sat at 6.9%. Wind kept growing in 2025, adding 204 TWh. Solar simply grew three times as fast in absolute terms. Its output rose from 2,143 TWh to 2,779 TWh, a jump of 636 TWh, or 30% in a single year.
In its Global Electricity Review 2026, Ember called it a record. By its count, solar met about 75% of the growth in global electricity demand in 2025, and solar and wind together met 99% of it. Clean sources grew by more than demand did, so fossil generation fell slightly, by about 0.2%. It was the first year without fossil growth since the pandemic dip of 2020. Coal's share slipped to 33.1%, down from 38.7% in 2015, and Ember reports that renewables as a group overtook coal.
None of that means the grid is finished with fossil fuels. Coal still makes about a third of the world's electricity. Solar's share is less than a tenth, and it only produces while the sun is up. But the direction of travel is now clear. In the 66 countries in our ranking pool, solar already out-produces wind in 32 of them.
Who runs most on sunshine
The top of the sunrise is not where many people would guess. The countries with the largest solar shares are mid-sized economies with good sun, fast permitting, or both.
Hungary (27.3%) leads the ranking, up from 24.2% in 2024. That is a striking position for a central European country better known for nuclear and gas. Canary Media reported that solar's share in Hungary was around 7% five years earlier. Since then, a wave of utility-scale farms and household panels has made it the world's highest solar share among countries of meaningful size, as Hungary Today noted.
Chile (25.1%) has the Atacama, one of the sunniest places on Earth, and long transmission lines that carry desert power south to Santiago. Spain (21.9%) and Greece (19.8%) have built huge utility-scale fleets under strong Mediterranean sun. The Netherlands (21.1%) shows that sunshine is not everything. With high rooftop density and generous rules for households selling power back to the grid, it rose from 17.8% to 21.1% despite its grey skies.
Further down are the large economies, where even a modest share means a lot of power. Germany got 17.9% of its electricity from solar (89.6 TWh). Australia, a rooftop-solar pioneer, reached 19.7%. Japan generated 101.1 TWh from solar, more than Spain and Germany, but that is still 9.8% of a very large grid. Brazil climbed to 11.8%.
Pakistan's rooftop revolution
The ray that stands out in pink is Pakistan. Its solar share rose from 12.6% in 2024 to 20.7% in 2025, the biggest jump of any country in the ranking, and it now ranks fifth.
What makes Pakistan unusual is that most of this happened without a national solar programme. Households, shops and factories bought cheap Chinese panels and installed them on their own roofs, often to escape high grid tariffs and frequent outages. Arab News reported that Pakistan imported about 16,600 MW of panels from China in 2024 alone, up from about 3,500 MW in 2022.
Ember's own analysis of Pakistan goes further. It estimates that distributed solar supplied 28% of Pakistan's electricity in fiscal year 2025, up from 10% two years earlier, while generation on the national grid fell. That figure uses a different method from the national statistics behind our ranking, so the two numbers are not directly comparable. Both point the same way.
The boom has put pressure on the state utilities, which lose paying customers while still owing fixed payments to power plants. In early 2026, the regulator proposed moving new rooftop users from net metering to net billing. Under that plan, exported power would be paid at a much lower rate than the grid charges, according to Profit. How that plays out will shape whether Pakistan's ray keeps growing.
China builds the bulk
The share ranking hides scale. China's solar share was 11.1% in 2025, up from 8.3%. That puts it in the middle of the sunrise, below a dozen European countries. But China's grid is so large that its solar fleet produced 1,175 TWh, more than any other country by a wide margin.
China added 336 TWh of solar generation in 2025, 53% of the global increase. Its National Energy Administration reported 315 GW of new solar capacity in 2025, bringing its total to about 1.2 terawatts. Globally, the industry group SolarPower Europe counted a record 664 GW installed in 2025, with China accounting for 57%. The two counts measure capacity slightly differently (AC and DC), which explains the gap between them.
Other big grids moved quickly too. The United States rose from 6.9% to 8.6% and added 85 TWh. India went from 7.0% to 9.4%, adding 53 TWh. SolarPower Europe says India installed 45.7 GW in 2025, up 49% on the year before.
Cheap panels, crowded afternoons
Two forces explain why solar grew faster than anything else in power.
The first is price. Module prices fell to around 7 to 9 US cents per watt in 2024 and early 2025, a level that makes panels a minor part of the cost of a rooftop system. Prices firmed late in 2025 after China ended a tax rebate on exports, but panels remain far cheaper than a few years ago.
The second is speed. A solar farm can be permitted and built in months, and a rooftop system in days. That suits fast-growing demand in places like Pakistan, India and Brazil, and lets households act without waiting for utilities.
The flip side is the duck-shaped day. When everyone's panels peak at the same time, midday power can become worth less than nothing. In 2025 the Netherlands, Germany and Spain each recorded roughly 570 to 600 hours of negative wholesale prices, according to oEnergetice. That is the sign of a grid that has more sun than it can use at noon.
Batteries are the fix, and they are arriving quickly. The IEA counted 108 GW of battery storage added worldwide in 2025, up 40% in a year. Storage lets solar's midday surplus move into the evening peak, which is what the countries at the top of the sunrise will need most.
Where the sunrise goes next
Not every ray grew in 2025. Vietnam's share slipped from 8.5% to 7.4%, one of the few falls in the ranking, years after its early rooftop boom. Greece held roughly steady at 19.8%, a sign that the most saturated grids grow more slowly once midday power becomes cheap.
The next year looks less explosive. SolarPower Europe expects global installations to dip by about 8% in 2026, the first fall in years, as China's market cools after a record 2025. Even so, a fleet that passed 3 terawatts in early 2026 will keep adding output as last year's projects run for a full year. That points to solar's share of world electricity rising again in 2026, and to the gap over wind widening. Passing wind was a milestone for a technology that supplied barely 1% of the world's power a decade ago. Passing coal, still about four times larger, would be the next and far bigger one.
| # | Country | Share 2025 | Change since 2024 (pts) | Solar output (TWh) |
|---|---|---|---|---|
| 1 | Hungary | ▲ 3.1 | 11.0 | |
| 2 | Chile | ▲ 2.3 | 22.2 | |
| 3 | Spain | ▲ 1.1 | 62.9 | |
| 4 | Netherlands | ▲ 3.3 | 28.5 | |
| 5 | Pakistan | ▲ 8.0 | 36.6 | |
| 6 | Greece | ▲ 0.1 | 11.5 | |
| 7 | Australia | ▲ 1.9 | 56.4 | |
| 8 | Bulgaria | ▲ 3.9 | 6.9 | |
| 9 | Germany | ▲ 3.0 | 89.6 | |
| 10 | Portugal | ▲ 2.3 | 8.9 | |
| 11 | Italy | ▲ 3.4 | 44.6 | |
| 12 | Israel | ▲ 3.1 | 13.3 | |
| 13 | Belgium | ▲ 4.4 | 10.5 | |
| 14 | Austria | ▲ 3.7 | 10.3 | |
| 15 | Denmark | ▲ 2.6 | 4.6 | |
| 16 | Switzerland | ▲ 4.9 | 7.9 | |
| 17 | Brazil | ▲ 2.3 | 88.6 | |
| 18 | Poland | ▲ 1.1 | 19.6 | |
| 19 | China | ▲ 2.8 | 1174.9 | |
| 20 | Turkey | ▲ 3.0 | 37.3 | |
| 21 | Dominican Rep. | ▲ 3.5 | 2.3 | |
| 22 | Japan | ▲ 0.3 | 101.1 | |
| 23 | Romania | ▲ 3.3 | 4.9 | |
| 24 | India | ▲ 2.4 | 196.0 | |
| 25 | United States | ▲ 1.7 | 388.8 | |
| 26 | South Africa | ▲ 0.6 | 19.5 | |
| 27 | Uzbekistan | ▲ 3.9 | 6.5 | |
| 28 | Vietnam | ▼ 1.1 | 23.1 | |
| 29 | Mexico | ▲ 0.1 | 26.3 | |
| 30 | United Kingdom | ▲ 1.4 | 19.3 | |
| 31 | South Korea | ▲ 0.8 | 37.8 | |
| 32 | Morocco | ▲ 0.2 | 2.6 | |
| 33 | Czechia | ▲ 0.9 | 4.4 | |
| 34 | France | ▲ 1.2 | 32.0 | |
| 35 | Taiwan | ▲ 0.4 | 16.1 | |
| 36 | Thailand | ▲ 2.6 | 10.0 |
Countries that generated at least 20 TWh of electricity in 2025. World: solar 8.76%, wind 8.55%.
Counting the sun
A country's solar share here means solar's slice of all the electricity it generated in the year, not of its installed capacity. That distinction matters: a solar panel produces at full output only around midday on sunny days, so solar's share of capacity is always much larger than its share of generation. Shares are taken directly from Ember's yearly data (long-format release, downloaded October 2026). Ember's 2025 figures for some countries are estimates built from monthly data and may be revised. The ranking covers countries that generated at least 20 TWh in 2025. Our world solar total (2,779 TWh) can differ from Ember's headline figure by about 1 TWh because of rounding between releases.
Sources and method
- Ember, Yearly Electricity Data (full release, long format). Downloaded October 7, 2026. Licensed CC BY 4.0
Shares are each source's percentage of total electricity generation as published by Ember. The ranking covers countries that generated at least 20 TWh in 2025 and have 2025 data in Ember's release; small grids are left out because a single plant can swing their shares. Ember's 2025 figures for some countries are estimates built from monthly data and may be revised.
Charts like this, from your own numbers.
Connect a spreadsheet or the tools you run on, and Parity builds the dashboard and writes the report, with every number checked.
Try Parity free

