Charts like this, from your own numbers.
Connect a spreadsheet or the tools you run on, and Parity builds the dashboard and writes the report, with every number checked.
Try Parity freeNine tonnes. That is how much primary gallium the whole world outside China made in 2025, by the estimate of the U.S. Geological Survey. Russia and Japan account for all of it. China made about 900 tonnes, so of the 909 tonnes on the USGS ledger, 99% came from one country. Gallium is not obscure in use, only in name: the USGS says gallium arsenide is used to make "compound semiconductor wafers used in integrated circuits (ICs)", and that ICs took 73% of US gallium consumption (USGS, gallium chapter).
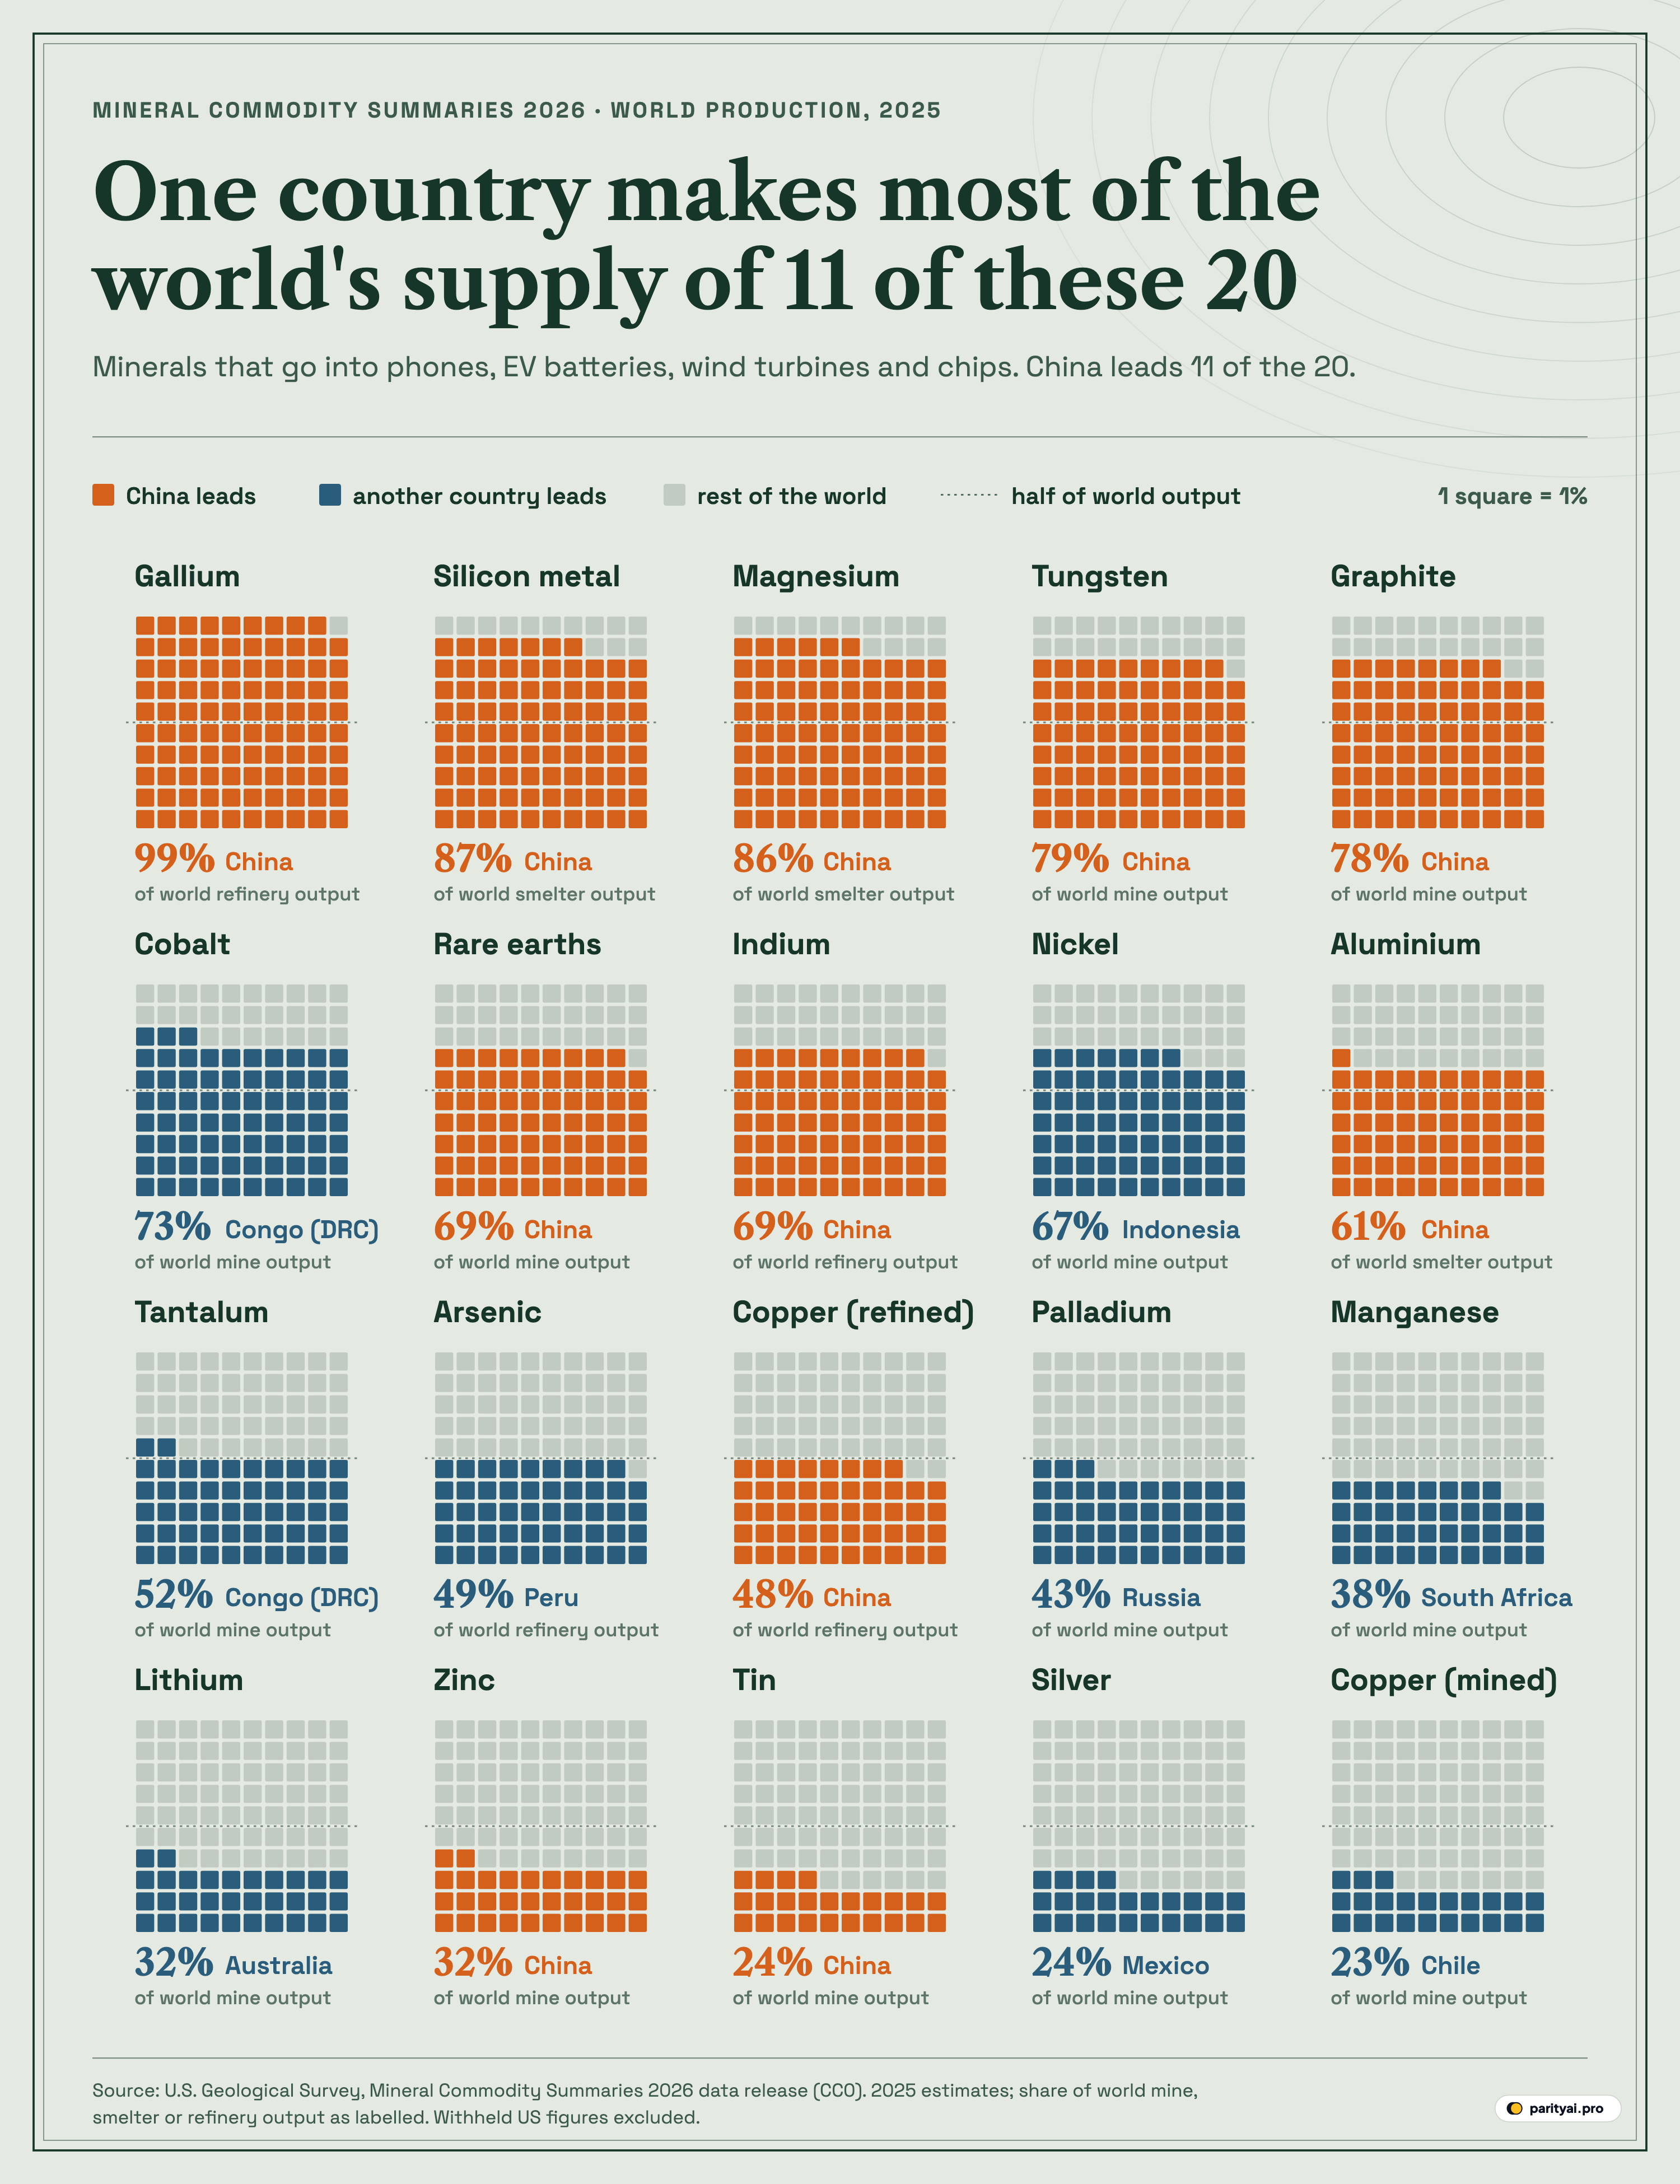
Gallium is the extreme case, but it is not alone. The graphic above takes 20 minerals that end up in four ordinary products (a phone, an electric car's battery, a wind turbine and a computer chip) and draws each one's 2025 world production as a tray of 100 squares. Each square is 1% of the world's output. The leading country's squares are filled from the bottom up, in orange when that country is China and in dark blue when it is anyone else. Grey is everybody else put together. A dotted line crosses each tray at the halfway mark, so any colour that rises above it means a single country produced most of the world's supply.
Count the trays where the colour crosses that line and you get 11 of 20. China leads 11 of the 20, and 8 of the trays above the halfway line are orange. The other three are cobalt from Congo (DRC), nickel from Indonesia and tantalum from Congo (DRC). The trays are sorted from most to least concentrated, so the eye runs downhill from gallium at 99% to mined copper at 23%. The median share across the set is 56%.
Under each tray a small line says what was counted: mine output, smelter output or refinery output. That label matters more than it looks, and we come back to it below. The rest of this piece reads the graphic the way a factory reads a parts list: product by product, line by line, asking who supplies each one.
| # | Mineral | Measured | Leading producer | Leader's share | Runner-up | Goes into |
|---|---|---|---|---|---|---|
| 1 | Gallium | refined | China | Russia (1%) | Chip | |
| 2 | Silicon metal | smelted | China | Brazil (4%) | Chip | |
| 3 | Magnesium | smelted | China | Russia (5%) | Phone | |
| 4 | Tungsten | mined | China | Vietnam (4%) | Phone | |
| 5 | Graphite | mined | China | Madagascar (4%) | EV battery | |
| 6 | Cobalt | mined | Congo (DRC) | Indonesia (14%) | EV battery | |
| 7 | Rare earths | mined | China | United States (13%) | Wind turbine | |
| 8 | Indium | refined | China | South Korea (16%) | Phone | |
| 9 | Nickel | mined | Indonesia | Philippines (7%) | EV battery | |
| 10 | Aluminium | smelted | China | India (6%) | Wind turbine | |
| 11 | Tantalum | mined | Congo (DRC) | Rwanda (16%) | Phone | |
| 12 | Arsenic | refined | Peru | China (39%) | Chip | |
| 13 | Copper | refined | China | Congo (DRC) (10%) | Wind turbine | |
| 14 | Palladium | mined | Russia | South Africa (36%) | Chip | |
| 15 | Manganese | mined | South Africa | Gabon (25%) | EV battery | |
| 16 | Lithium | mined | Australia | China (21%) | EV battery | |
| 17 | Zinc | mined | China | Peru (12%) | Wind turbine | |
| 18 | Tin | mined | China | Indonesia (21%) | Phone | |
| 19 | Silver | mined | Mexico | Peru (14%) | Phone | |
| 20 | Copper | mined | Chile | Congo (DRC) (14%) | Wind turbine |
Shares of 2025 world production, USGS estimates. Highlighted rows: one country made more than half. Orange dot: China leads; blue: another country leads.
Line items for a phone
The USGS has a picture of a mobile device taken apart into its ores, and several of the trays come straight off it. Six of the minerals on the graphic belong to this list, and one country makes most of the world's supply of 4 of them.
Indium. Most of the world's indium becomes indium tin oxide, a thin coating that conducts electricity on flat-panel displays and touchscreens (USGS, indium chapter). It is recovered at refineries, and the USGS traces it to sphalerite, the main ore of zinc (USGS). China refined 69% of the world's indium in 2025; the runner-up, South Korea, refined 16%.
Tungsten. In a phone, the USGS says, tungsten "provides the mass for mobile phone vibration". China mined 79% of the world's tungsten. The next country, Vietnam, mined 4%. That is one of the steepest drops between first and second place on the whole graphic, and the USGS notes that after China brought in new export controls on some tungsten items in February 2025, "prices rose sharply throughout 2025" (USGS, tungsten chapter).
Magnesium. The USGS lists magnesium among the metal alloys used in the aerospace, automotive and electronics industries. Its smelter output is even more lopsided than tungsten's: China made 86%, and Russia, in second place, made 5%.
Tantalum. Tantalum goes into capacitors, which were an estimated 37% of global tantalum use in 2021 (USGS Minerals Yearbook), and into "components for items as ubiquitous as cell phones" (USGS fact sheet). Congo (DRC) mined 52% of it in 2025, Rwanda 16%, and China only 3%.
Tin and silver. These two show what an unconcentrated mineral looks like. China led tin mining with 24%, just ahead of Indonesia at 21%. Solder takes 11% of US tin use, according to the USGS tin chapter. For silver, which the USGS lists for electrical circuits among other uses, Mexico led with 24% and China came third at 13%. In both trays the grey takes up most of the space.
Line items for an EV battery
The International Energy Agency's Global Critical Minerals Outlook 2025 gives the shopping list in one line: "Battery metals include lithium, nickel, cobalt, graphite and manganese." All five are on the graphic, and this is the product where China leads least often: just 1 of 5. But that only holds at the mine, a point the next section of this list makes plain.
Graphite. The IEA calls graphite "the only critical mineral used for anodes today". It is the battery's orange tray: China mined 78% of the world's natural graphite in 2025, about 1,400,000 metric tons of 1,800,000 metric tons. The next country, Madagascar, mined 4%.
Cobalt. Congo (DRC) mined 73% of the world's cobalt. China mined 1%. But the IEA's Global EV Outlook 2025 adds what the tray cannot show: in 2023 "three-quarters of all cobalt refining was handled in China". The USGS cobalt chapter likewise says China "remained the world leading producer of refined cobalt" (USGS, cobalt chapter).
Nickel. Indonesia mined 67% of the world's nickel in 2025, up from 62% in 2024; the runner-up, the Philippines, mined 7%. Indonesia has banned exports of nickel ore since January 2020, requiring the metal to be processed in the country first (IEA policy database). The USGS says Indonesian output rose by an estimated 13% in 2025 "as new operations continued to ramp up production" (USGS, nickel chapter).
Manganese. South Africa mined 38%, with Gabon next at 25%. China mined 3%.
Lithium. The metal most people link with batteries is one of the least concentrated at the mine. Australia led with 32%, followed by China at 21%; Australia, China and Chile together mined 72%. The USGS estimates that batteries take 88% of lithium use worldwide (USGS, lithium chapter). And again, refining tells another story: the IEA says that in 2023 "almost 65%" of lithium was refined in China and another 25% in Chile.
Not every battery needs every line. The IEA's Global EV Outlook 2026 says LFP batteries, which use iron and phosphate instead of nickel and cobalt, were "over 55% of EV batteries deployed globally" in 2025.
Line items for a wind turbine
The IEA's list for a wind farm is long: "Wind turbines require concrete, steel, iron, fibreglass, polymers, aluminium, copper, zinc and REEs" (IEA). Five trays on the graphic come from it. China leads 4 of the 5.
Rare earths. Rare-earth magnets are used in "permanent magnet synchronous generators (PMSG), also referred to as direct drive generators", the US Department of Energy says in its magnet supply chain report. China mined 69% of the world's rare-earth oxides in 2025. The second-largest miner was the United States, at 13%, and Myanmar mined 6%. Mining is where China's grip is loosest. The IEA's rare earths report puts China at 60% of mined magnet rare earths in 2024, but at "91% of global refined output", and at 94% of sintered permanent magnets.
Aluminium. China smelted 61% of the world's aluminium in 2025. The runner-up, India, smelted 6%.
Zinc. Zinc protects steel from rust (the USGS lists it for "protective coatings for iron and steel"). China mined 32% and Peru 12%; most of the tray is grey.
Copper, twice. Copper is the only mineral drawn twice, and the pair is the clearest lesson on the page. Chile mined the most copper ore, 23% of the world total, with China at 8%. But China refined 48% of the world's copper. Same metal, same year: the leading country's share jumps by 25 percentage points between the mine and the refinery, and the leader changes.
Line items for a chip
The last product is the smallest, and its list holds both the top of the graphic and the closest race on it. One country makes most of the world's supply of 2 of these 4 minerals.
Gallium, at 99%, opens this piece. China first required export licences for gallium and germanium products from 1 August 2023 (Reuters, via the Jakarta Post). The USGS records "China's ban of all gallium exports to the United States in December 2024", and that in November 2025 China lifted that ban for one year.
Silicon metal. Chips are made on wafers of ultra-pure silicon. The USGS explains that silicon metal "may be further processed into ultra-high-purity semiconductor- or solar-grades, commonly referred to as polysilicon", though most silicon metal goes into aluminium alloys and chemicals (USGS, silicon chapter). China smelted 87% of it; Brazil was second with 4%.
Arsenic. The USGS says high-purity arsenic is used to make gallium arsenide and other compound semiconductors (USGS, arsenic chapter). This is the closest race on the graphic. Peru produced 49% of the world's arsenic trioxide, just short of the halfway line, and China produced 39%.
Palladium. The USGS lists electronics among palladium's uses, alongside catalytic converters. Russia mined 43% and South Africa 36%. Palladium is the only tray on the graphic where China does not appear in the USGS country list at all.
Adding up the order
Totalled across all four products, the bill of materials reads like this. Out of 20 minerals, 11 come mostly from a single country. China is first for 11, and 9 countries lead at least one: China, Congo (DRC), Indonesia, Peru, Russia, South Africa, Australia, Mexico and Chile. China is among the top three producers of 14 of the 20. The 6 where it is not are cobalt, nickel, tantalum, palladium, manganese and copper (mined).
The table below takes the nine blue trays and asks where China stands in each. In some, like lithium and arsenic, China is a strong second. In others, such as cobalt and nickel, it barely mines at all, yet it is the leading refiner of cobalt, according to the USGS and IEA quotes above.
| Mineral | Leader | Leader's share | China's share | China minus leader (points) |
|---|---|---|---|---|
| Cobalt | Congo (DRC) | 73% | ▼ 72 | |
| Nickel | Indonesia | 67% | ▼ 64 | |
| Tantalum | Congo (DRC) | 52% | ▼ 49 | |
| Arsenic | Peru | 49% | ▼ 10 | |
| Palladium | Russia | 43% | ▼ 43 | |
| Manganese | South Africa | 38% | ▼ 34 | |
| Lithium | Australia | 32% | ▼ 10 | |
| Silver | Mexico | 24% | ▼ 11 | |
| Copper (mined) | Chile | 23% | ▼ 15 |
The nine minerals on the graphic led by a country other than China. 'None listed': the USGS table names no Chinese output.
The mine is not the factory gate
Each tray counts one stage of a long chain, and the stage changes the answer. Ores are counted at the mine; aluminium, magnesium and silicon metal at the smelter; indium, gallium, arsenic and the second copper tray at the refinery. The IEA's summary of 20 minerals is blunt: "China is the dominant refiner for 19 of the 20 minerals analysed, holding an average market share of around 70%" (IEA). So the blue trays for cobalt, lithium and mined copper understate how much of the finished material passes through China, while orange trays such as gallium, silicon metal, magnesium and refined copper already measure the processed product.
There is a third layer under the mine: what's still in the ground. The USGS also estimates each country's reserves, and the biggest miner is not always the biggest holder. Australia holds the most manganese and zinc reserves but leads neither mine. Chile holds the most lithium reserves, while Australia mines the most.
| Mineral | Top miner, 2025 | Share of output | Largest reserves | Share of reserves |
|---|---|---|---|---|
| Tungsten | China | 79% | China | |
| Graphite | China | 78% | China | |
| Cobalt | Congo (DRC) | 73% | Congo (DRC) | |
| Rare earths | China | 69% | China | |
| Nickel | Indonesia | 67% | Indonesia | |
| Manganese | South Africa | 38% | Australia | |
| Lithium | Australia | 32% | Chile | |
| Zinc | China | 32% | Australia | |
| Tin | China | 24% | Indonesia | |
| Silver | Mexico | 24% | Peru | |
| Copper | Chile | 23% | Chile |
Mined minerals only; reserves are the USGS's 2025 estimates of economically extractable deposits. Where the USGS gives the world total only as a minimum (“more than”), the share is a ceiling and is marked “under”. Tantalum is left out because the USGS gives no world or Congo reserve figure. Highlighted: the biggest miner is not the biggest reserve holder.
The small print on the parts list
These numbers are estimates, and the USGS marks them that way. The 2025 figures were published in February 2026 and will be revised next year; a few points of movement is normal. For example, the leader's share slipped from 82% to 79% for tungsten between the 2024 and 2025 columns of the same release.
Some numbers are hidden. Where printing a country's figure would reveal a company's production, the USGS writes "W" for withheld. For silicon metal and lithium, US output is withheld and left out of the world total, as the USGS does. Including a US figure would lower the other countries' shares a little, Australia's lithium share among them.
Some world totals are rounded more than the country figures. We divide by the larger of the rounded world total and the sum of all listed countries, so shares never add up to more than 100%. That is why gallium shows 99% here even though the USGS's own summary table lists 100%.
Some minerals are missing. Germanium is a chip material, but the USGS has no country table for it and calls the data "difficult to verify" (USGS, germanium chapter). Boron, used in rare-earth magnets, has no comparable world total either.
The grouping is ours. Most of these minerals go into many products: copper into nearly everything electrical, rare earths into phone speakers as well as turbines. We put each mineral under one product to make the list readable. And a mineral being concentrated does not mean it is scarce, only that most of it comes from one place.
Reading the invoice
A bill of materials normally lists parts and prices. This one lists places, and it's short. One country accounts for most of the world's output of gallium, silicon metal, magnesium, tungsten, graphite, rare earths, indium and aluminium, and in each case it is the same country. Three more trays cross the halfway line for other countries: Congo (DRC) for cobalt and tantalum, Indonesia for nickel. The rest of the list looks more spread out, but for cobalt and lithium that is only true at the mine: the IEA's refining figures put most of the processing in China.
The last few months of 2025 showed what that means in practice. In April 2025 China put export controls on seven rare earths, and in October it announced five more, plus controls on battery cathode and graphite anode materials, before suspending the October rules for a year (USGS, rare earths chapter; IEA). Weeks later, on 7 November 2025, the US published its final list of critical minerals: 60 of them (Federal Register). Every tray on the graphic is a line on that list somewhere, and for 11 of the 20, the first name in the supplier column is China.
Sources and method
- U.S. Geological Survey, National Minerals Information Center: Mineral Commodity Summaries 2026 Data Release (MCS2026_Commodities_Data.csv). World production tables, 2025 estimates. Released under CC0 1.0 (public domain dedication). Cite as: National Minerals Information Center, 2026, U.S. Geological Survey Mineral Commodity Summaries 2026 Data Release: U.S. Geological Survey data release, https://doi.org/10.5066/P1WKQ63T. Retrieved November 10, 2026.
- U.S. Geological Survey: Mineral Commodity Summaries 2026 (chapter PDFs)
- International Energy Agency: Global Critical Minerals Outlook 2025 and Global EV Outlook 2025
Each grid is one mineral's 2025 world production as estimated by the USGS in Mineral Commodity Summaries 2026. The leading country's share is its production divided by the larger of the USGS's rounded world total and the sum of the listed countries plus 'Other countries', then rounded to whole squares. What is measured differs by mineral and is stated on each grid: mine output for ores (lithium, cobalt, nickel, graphite, manganese, tantalum, tin, tungsten, silver, palladium, zinc, rare earths and mined copper), smelter output for aluminium, magnesium metal and silicon metal, and refinery output for indium, gallium (primary low-purity gallium), arsenic (arsenic trioxide) and refined copper. Where the USGS withholds US production ('W') it is left out of both the country's figure and the world total, as the USGS does for lithium and silicon. All 2025 figures are estimates and will be revised. Grouping minerals by product follows USGS and IEA descriptions of their main uses; many minerals go into more than one of the four products.
Charts like this, from your own numbers.
Connect a spreadsheet or the tools you run on, and Parity builds the dashboard and writes the report, with every number checked.
Try Parity free

