Has America finally run out of new flyers?
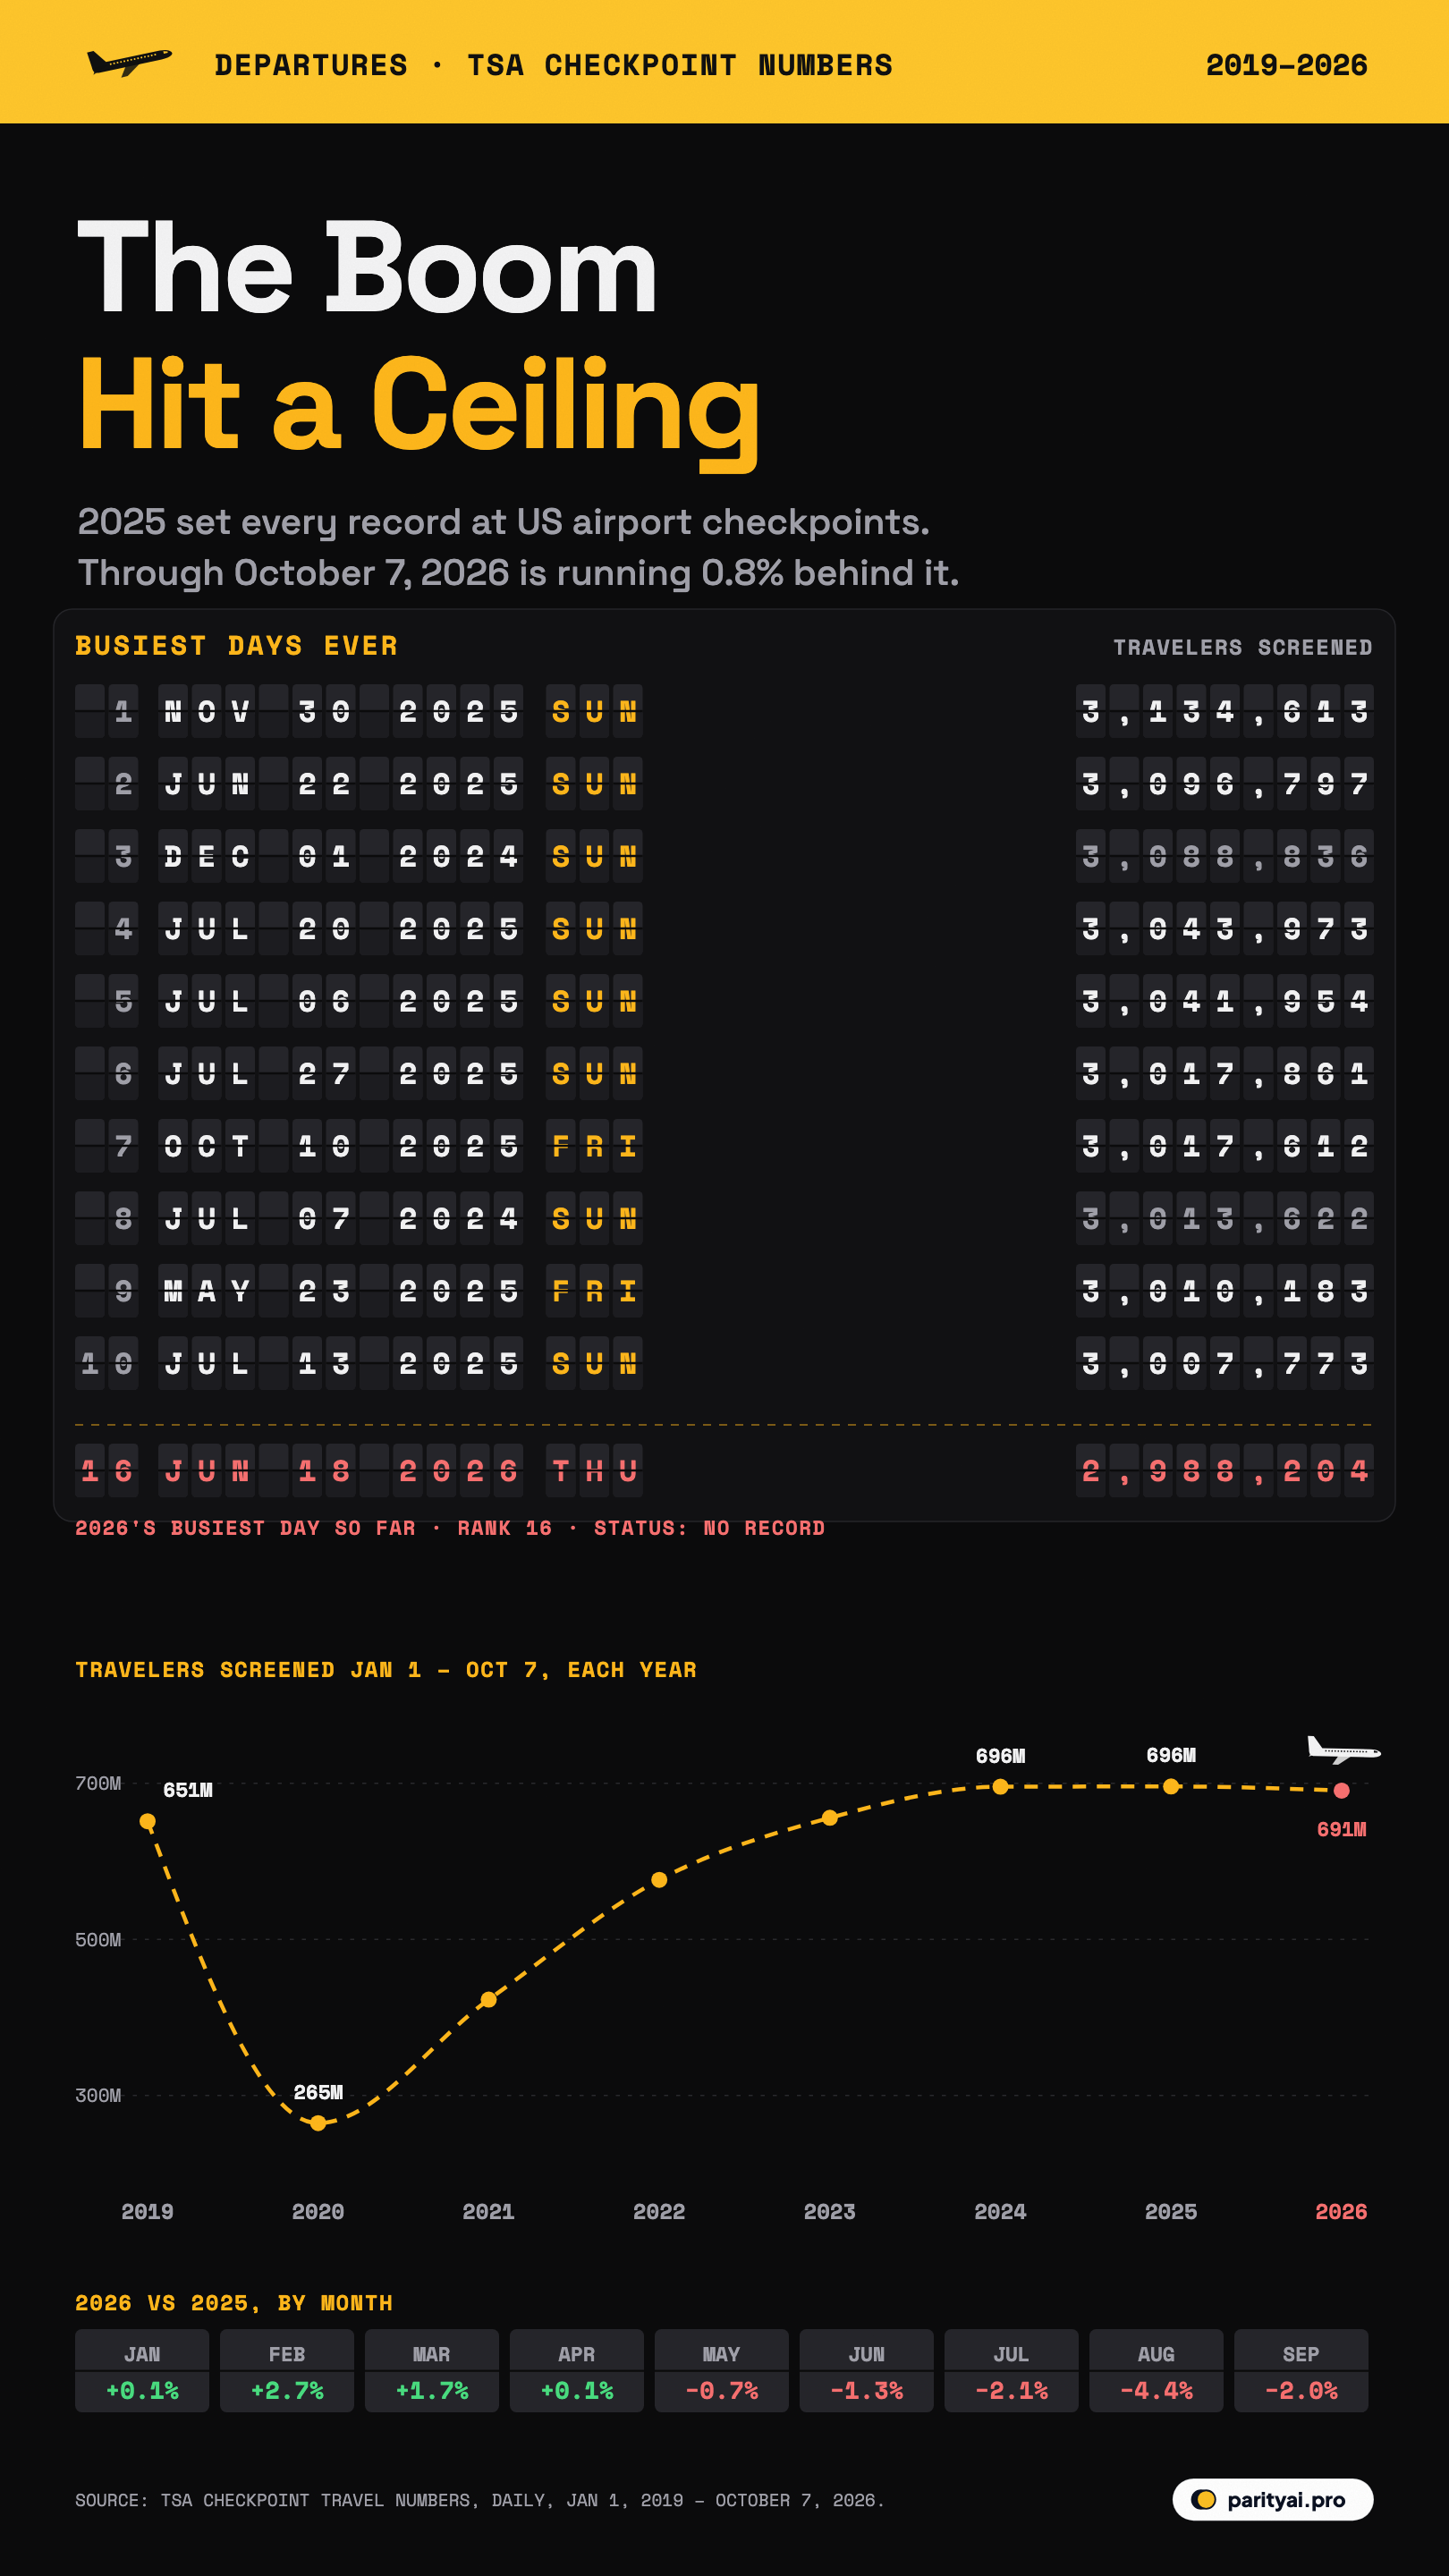
Not quite. But the number of people passing through airport security has stopped growing. The Transportation Security Administration publishes a count of everyone it screens, every day. From January 1 to October 7, 2026, it screened 690.5 million people, −0.8% fewer than in the same stretch of 2025. Not one day of 2026 has made the all-time top ten.
The graphic above is laid out like an airport departure board. Its rows are the ten busiest days in TSA's records, every one of them in 2024 or 2025. Below the dashed line, in red, is 2026's best day so far, which ranks 16th. Underneath, a flight path traces the total screened from January 1 to October 7 in each year since 2019. Below that, a row of tiles compares each month of 2026 with the same month of 2025. The data comes from TSA's daily checkpoint numbers, which run back to 2019.
This piece works through the questions those numbers raise.
What exactly does TSA count?
TSA reports the number of people screened at its airport security checkpoints each day. That is not the same as the number of passengers airlines carry. Someone connecting between flights inside the same terminal is usually counted once, at their first airport. Airline crews who go through the checkpoint are counted too, according to The Points Guy. The figure is still the best daily measure of air travel demand in the United States, which is why airlines, analysts and journalists watch it.
TSA updates the numbers each weekday morning and occasionally revises them. The record day of November 30, 2025 was first reported as 3,133,924 people. TSA's table now lists 3,134,613.
How big did the boom get?
Very big, and quickly. In 2019, before the pandemic, TSA screened 848.1 million people. In 2020 that collapsed to 339.8 million. The recovery took until 2023, when the full-year total (858.5 million) finally passed 2019's.
Then came two record years in a row: 904.1 million in 2024 and 906.7 million in 2025, an average of 2,484,208 people a day. In 2025, TSA passed three million screenings on 8 separate days. In 2024 it did so on 2.
The board shows where those peaks fall. 8 of the ten busiest days ever were in 2025 and 2 in 2024. 8 of the ten were Sundays, when holiday travellers and weekenders fly home at the same time. The busiest of all was November 30, 2025, the Sunday after Thanksgiving, with 3,134,613 people screened. Next came June 22, 2025 (3,096,797) and December 1, 2024 (3,088,836), another post-Thanksgiving Sunday. The summer of 2025 filled the rest of the board: July 20, 2025, July 6, 2025, July 27, 2025 and July 13, 2025 are all July Sundays.
Why are the records all Sundays?
Because that is when everyone comes home. In 2025 the average Sunday saw 2,736,967 people screened, more than any other day of the week, with Friday second. The quietest day was Tuesday, at 2,163,031. That is a 27% swing between the busiest and quietest days of an ordinary week, before holidays are even considered.
Holidays stack on top of that weekly rhythm. The Sunday after Thanksgiving combines the biggest travel holiday of the year with the busiest day of the week, which is why it holds the top spot and one of the next two. July Sundays dominate the rest of the board because summer is the peak season for leisure travel, and families heading home from week-long trips tend to fly at the weekend. Two Fridays made the list, both at the start of long weekends: Memorial Day weekend (May 23, 2025) and the Columbus Day weekend (October 10, 2025).
That rhythm is one reason to read daily records with care. A year in which a big holiday falls on a Sunday has a better chance of setting a single-day record than one in which it falls midweek, even if the total number of travellers is the same. The year-to-date totals in the flight path smooth those quirks out, which makes them the better guide to whether demand is really growing.
Did 2026 set any records?
No. The busiest day of 2026 so far was June 18, 2026, a Thursday, with 2,988,204 people screened. That is high by any historical standard. It would have been the busiest day ever as recently as 2023. But it ranks only 16th overall, and TSA has not screened three million people on a single day all year. In 2025 it did that 8 times.
The flight path shows the bigger picture. From January 1 to October 7, TSA screened 695.5 million people in 2024, 695.8 million in 2025 and 690.5 million in 2026. The line rose steeply out of the pandemic, flattened in 2024 and 2025, and has now tipped slightly down. Air travel is still +6.0% above 2019's level for the same dates, but it has stopped climbing.
When did it start slipping?
Spring. The month tiles at the bottom of the graphic compare each month of 2026 with the same month of 2025. January (+0.1%), February (+2.7%), March (+1.7%) and April (+0.1%) were all level with or ahead of 2025.
From May the tiles turn red: May −0.7%, June −1.3%, July −2.1%, August −4.4% and September −2.0%. August was the weakest month. Calendar quirks explain some of the swings. A month with an extra weekend, or a holiday that moves between months, can shift a comparison by a point or so. They don't explain five straight months of decline in the busiest season of the year.
Is it the price of a ticket?
Prices are the most likely suspect. The war that began with US and Israeli strikes on Iran on February 28 sent oil prices soaring. A report by the Scripps News network, citing federal transport statistics, said jet fuel prices more than doubled after the war began. It put the average US domestic airfare at $428, up 4.7% from the last quarter of 2025 and 7.7% from a year earlier.
The timing fits. Fuel is one of an airline's biggest costs, and fares bought weeks or months ahead take time to pass higher costs on. The first quarter of 2026, when most tickets had been bought at pre-war prices, held up well. The summer, when many fares had been bought after the price shock, did not. That is a pattern, not proof. Airline capacity, the economy and consumer confidence all play a part, and TSA's numbers alone can't separate them.
Didn't the government shutdown hurt air travel too?
It did, but in late 2025, not in 2026. During the 43-day federal shutdown, the Federal Aviation Administration ordered airlines to cut flights at 40 major airports because of air traffic controller shortages. The cuts began at 4%, rose to 6% and were then reduced to 3%, before the FAA lifted the order on November 17, 2025, according to the AP. On November 9, airlines cancelled more than 2,900 flights.
The dent was small in the monthly totals: TSA screened −0.2% fewer people in November 2025 than in November 2024. The travel rush also came back quickly: the record day of November 30, 2025 came less than two weeks after the order was lifted. The pressure on air traffic control has not gone away. Newark's airport has operated under a cap of 72 flights an hour, and the FAA has said it is short of about 3,000 controllers, according to Reuters.
Did REAL ID enforcement keep people away?
Probably not by much. TSA began fully enforcing the REAL ID requirement on May 7, 2025, when it stopped accepting state-issued IDs that don't meet the federal standard. At the time, TSA said 81% of travellers were already showing an acceptable form of ID. The summer of 2025 still set records, which suggests the rule did not hold travel back in any lasting way.
Is this a peak, or a pause?
That depends on what happens to fuel prices and fares. Air travel has hit plateaus before and resumed its climb, and the long-term pressure on demand is upward: a growing population, rising incomes and a habit of travel that the pandemic interrupted but did not break.
The next real test comes at Thanksgiving. This year the holiday falls on November 26, which makes Sunday, November 29 the day to watch. If fares stay high, it would not be surprising to see it fall short of last year's record. If the board flips, the plateau may turn out to have been a pause.
What the checkpoint numbers show for now is a ceiling. Since the start of 2024, the total screened in each year's first nine months has barely moved, going from 695.5 million to 695.8 million to 690.5 million. Two years of records were followed by a year of almost exactly the same.
| Year | Jan 1 – Oct 7 | vs year before | Full year | Busiest day |
|---|---|---|---|---|
| 2026 | ▼ 0.8% | – | 2,988,204 | |
| 2025 | 0.0% | 906.7M | 3,134,613 | |
| 2024 | ▲ 6.1% | 904.1M | 3,088,836 | |
| 2023 | ▲ 13.8% | 858.5M | 2,908,785 | |
| 2022 | ▲ 36.3% | 760.1M | 2,639,616 | |
| 2021 | ▲ 59.8% | 585.3M | 2,458,325 | |
| 2020 | ▼ 59.4% | 339.8M | 2,507,588 | |
| 2019 | – | 848.1M | 2,882,915 |
People screened at TSA checkpoints, including airline crew. 2026 is partial.
The busiest days, ranked
| Rank | Date | Day | Screened |
|---|---|---|---|
| 1 | November 30, 2025 | Sunday | 3,134,613 |
| 2 | June 22, 2025 | Sunday | 3,096,797 |
| 3 | December 1, 2024 | Sunday | 3,088,836 |
| 4 | July 20, 2025 | Sunday | 3,043,973 |
| 5 | July 6, 2025 | Sunday | 3,041,954 |
| 6 | July 27, 2025 | Sunday | 3,017,861 |
| 7 | October 10, 2025 | Friday | 3,017,612 |
| 8 | July 7, 2024 | Sunday | 3,013,622 |
| 9 | May 23, 2025 | Friday | 3,010,183 |
| 10 | July 13, 2025 | Sunday | 3,007,773 |
The board will flip again when a new day beats 3,134,613. Based on 2026 so far, that won't happen before the Thanksgiving rush, if it happens at all this year.
Sources and method
- Transportation Security Administration, TSA checkpoint travel numbers. Daily throughput for 2019 through October 7, 2026, retrieved October 8, 2026
TSA publishes the number of people screened at its airport security checkpoints each day. Year-to-date comparisons add up January 1 through October 7 of each year, so every year covers the same calendar days (2020 and 2024 were leap years, which adds one day to their totals). Days of the week differ from year to year, which can shift monthly comparisons by about a percentage point.
Charts like this, from your own numbers.
Connect a spreadsheet or the tools you run on, and Parity builds the dashboard and writes the report, with every number checked.
Try Parity free

