Key takeaways
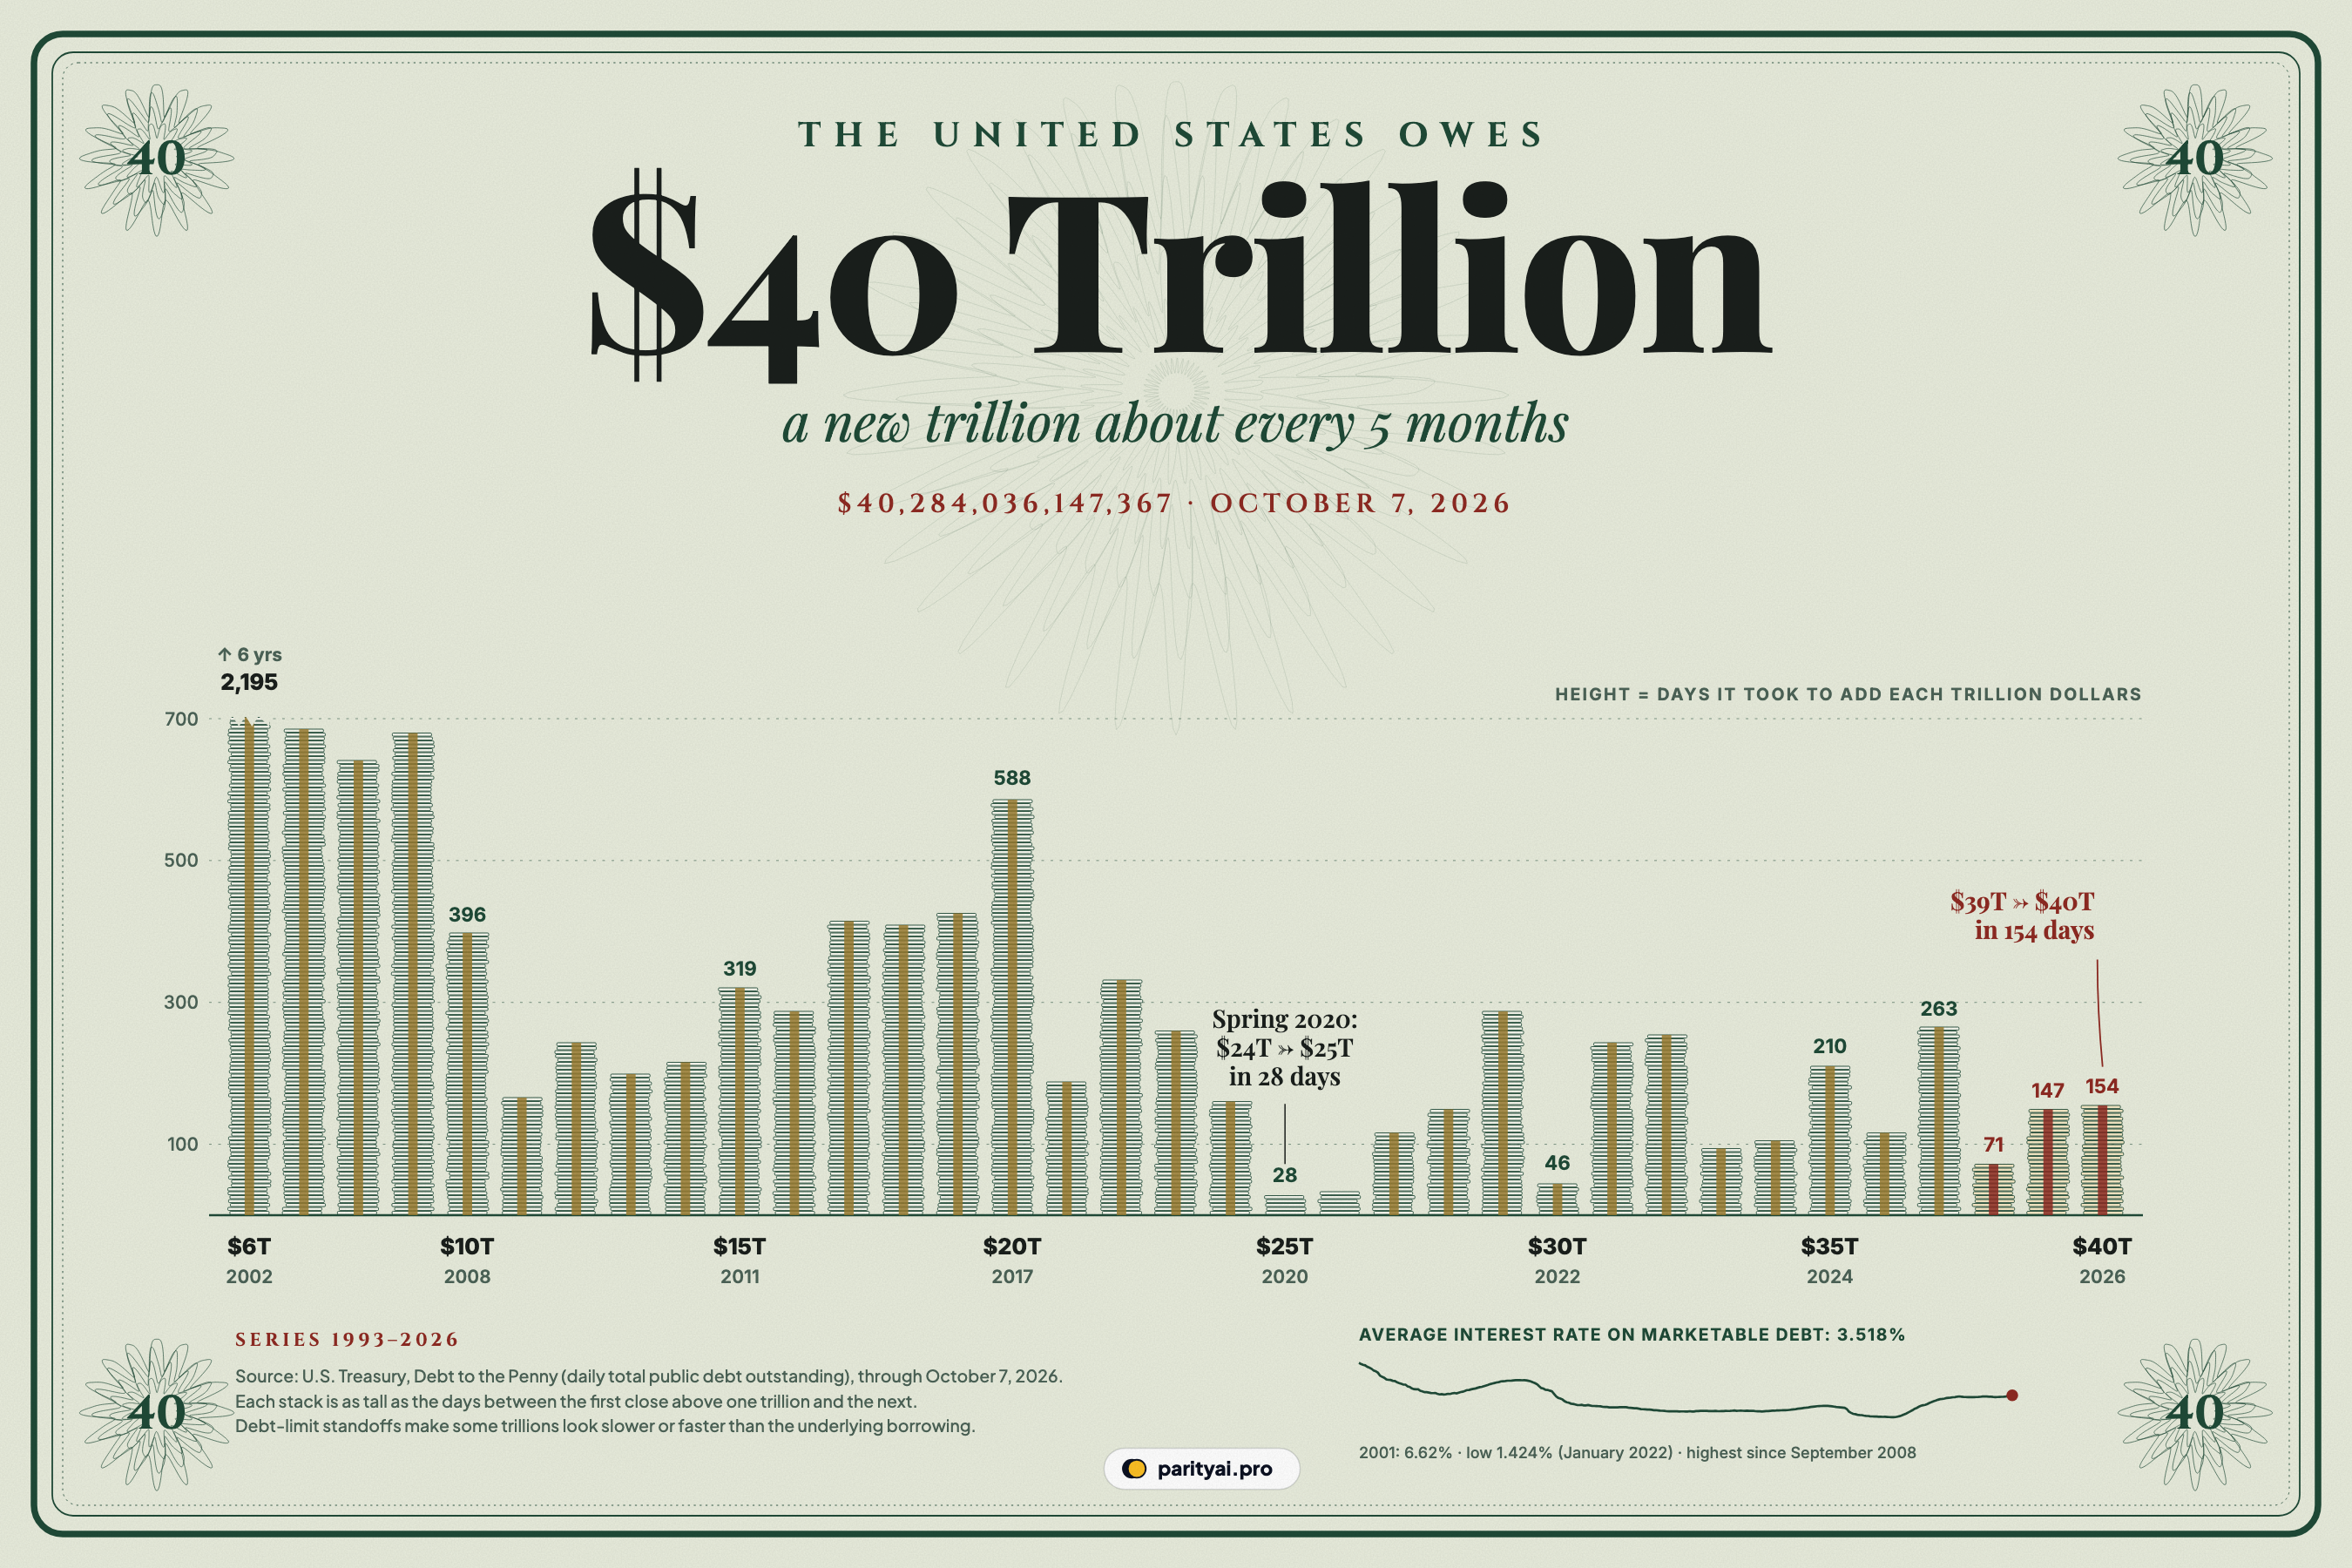
- The US government's total debt was $40,284,036,147,367.19 at the close of business on October 7, 2026. It first passed $40 trillion on August 18, 2026.
- Going from $5 trillion to $6 trillion took 2,195 days, ending in 2002. The last five trillions took an average of 151 days each.
- The average interest rate on the government's marketable debt has risen to 3.518%, its highest since September 2008. That turns the size of the debt into a growing annual bill.
Forty trillion, two hundred eighty-four billion, thirty-six million, one hundred forty-seven thousand, three hundred sixty-seven dollars and nineteen cents. That is what the US Treasury reported it owed on October 7, 2026, in its daily "Debt to the Penny" release. The figure is so large that its digits stop meaning much, so the graphic above breaks it into pieces the size of one trillion dollars each.
Each stack of banknotes is one trillion, from the sixth to the fortieth. Its height is the number of days it took to add that trillion, counted from the first day the debt closed above one whole trillion to the first day it closed above the next. Tall stacks are slow trillions; short ones are fast. The first stack is so tall it is broken off at the top. The two newest stacks are printed in red. The small line in the corner traces the average interest rate the government pays on its marketable debt.
Read from left to right, the stacks fall into four eras.
$5 trillion to $10 trillion: the slow years (1996–2008)
Treasury's daily series begins on April 1, 1993, when total debt stood at $4.23 trillion. It crossed $5 trillion on February 23, 1996 and didn't reach $6 trillion until February 26, 2002, 2,195 days later. Those were the years of the late-1990s budget surpluses. For a while the government was paying down the part of its debt held by investors, and total debt barely moved.
After 2001, tax cuts, two wars and a new Medicare drug benefit pushed borrowing back up. The trillions came faster, roughly one every 21 to 23 months, as the next stacks show. The debt reached $10 trillion on September 30, 2008, the day after the House of Representatives rejected the first version of the bank bailout in the depths of the financial crisis.
$10 trillion to $20 trillion: the crisis and its long tail (2008–2017)
The financial crisis changed the pace. With tax revenue collapsing and stimulus spending rising, the eleventh trillion took only 167 days. Through 2009 and 2010 a new trillion arrived roughly every six to eight months.
Then the stacks grow taller again. The years after 2011 brought spending caps, rising tax receipts as the economy recovered, and repeated fights over the debt limit, the legal cap on how much the Treasury may borrow. Those fights leave a distinctive mark on this chart. While the limit binds, the recorded debt stays almost flat, because the Treasury uses accounting manoeuvres to keep paying the bills. When the limit is finally raised or suspended, the debt jumps as those manoeuvres are reversed. That is why the stack for the twentieth trillion, completed on September 8, 2017, is one of the tallest of its era, and the twenty-first, at 188 days, is short. The underlying borrowing was steadier than the stacks suggest.
$20 trillion to $30 trillion: the pandemic (2017–2022)
The most dramatic part of the chart sits in the middle. In the spring of 2020, Congress passed trillions of dollars of pandemic relief in a matter of weeks. The debt went from $24 trillion to $25 trillion in 28 days, ending on May 5, 2020. It went from $25 trillion to $26 trillion in 35 more. These are the two shortest stacks in the chart.
The pace eased after 2020, but the debt kept climbing through the recovery. It passed $30 trillion on January 31, 2022. That trillion took only 46 days, partly because a debt-limit increase in December 2021 released borrowing that had been held back.
All told, going from $20 trillion to $30 trillion took 4.4 years.
$30 trillion to $40 trillion: the new normal (2022–2026)
The final ten trillions came almost exactly as fast as the previous ten, in 4.5 years, without a pandemic or a financial crisis to drive them. This era is the one that worries budget analysts most. The borrowing is not an emergency response. It is the regular gap between what the government spends and what it collects.
The last five stacks average 151 days. The debt passed $36 trillion on November 21, 2024, then stalled through the first half of 2025 at the debt limit before jumping once Congress raised the cap by $5 trillion in July 2025. The $5 trillion increase was part of the tax and spending law President Trump signed on July 4, 2025, according to Fox Business. That law put the limit at about $41.1 trillion. The thirty-seventh trillion was done on August 11, 2025, and the thirty-eighth took just 71 days, ending October 21, 2025. The AP called that the fastest trillion outside the pandemic. The thirty-ninth arrived on March 17, 2026, and the fortieth on August 18, 2026, after 154 days.
Over the past twelve months alone, the debt grew by $2.39 trillion, from $37.89 trillion to $40.28 trillion. That averages about $6.6 billion a day.
Where the $40 trillion sits
Not all of the total is owed to outside lenders. About $7.84 trillion is "intragovernmental", money the government owes itself, mostly to trust funds such as Social Security's. The rest, $32.44 trillion or 81% of the total, is debt held by the public: Treasury bills, notes and bonds owned by investors, banks, pension funds, the Federal Reserve and foreign governments. Economists usually focus on the second number, because it is the part financed in markets.
Foreign holders own a large slice of it. In July 2026, foreigners held about $9.25 trillion of Treasury securities, according to Treasury data reported by Reuters. Japan held about $1.1 trillion, the United Kingdom just under $1 trillion and China about $618 billion, far below its peak a decade ago.
The part that really changed: the interest bill
For most of the 2010s, the size of the debt mattered less than it seemed, because borrowing was cheap. The line in the corner of the graphic shows the average interest rate on the government's marketable debt. It was 6.62% in 2001, and it fell to a low of 1.424% in January 2022. Since then it has climbed steadily, as old cheap debt matures and is replaced at higher rates. In September 2026 it reached 3.518%, the highest since September 2008.
Some simple arithmetic shows why this matters. Debt held by the public is now about $32.44 trillion. If the average rate on that debt ends up one percentage point higher, the government's annual interest bill eventually rises by more than $300 billion. That is more than the federal government spends on most individual departments. It does not happen overnight, because existing bonds keep their original rates until they mature. But a large share of the debt is in short-term bills and notes that roll over within a few years, so higher rates reach the budget faster than many people expect.
Higher rates on a bigger debt add up fast. The Committee for a Responsible Federal Budget estimates that net interest cost about $1.1 trillion in fiscal 2026, a record 3.4% of GDP. That made interest the second-largest item in the federal budget, larger than defense or Medicare. The same group estimates that the government ran a deficit of about $2.0 trillion in the year, or 6.2% of GDP.
The Congressional Budget Office, Congress's official scorekeeper, projects that the problem grows. In its February 2026 outlook, as summarised by the CRFB, annual interest costs rise from $970 billion in 2025 to $2.1 trillion by 2036. Debt held by the public reaches 120% of GDP.
What the ratings agencies say
Credit rating agencies watch these trends closely. Moody's cut the US government from its top Aaa rating to Aa1 in May 2025, the last of the three big agencies to remove the perfect score. Fitch and S&P both affirmed their AA+ ratings in 2026. Fitch said it expects the general government deficit to widen to 7.4% of GDP this year, according to Reuters. None of them expects the US to have trouble paying. The concern is the long-run path, and the political fights over the debt limit that come with it.
The next stack
Under the current law, the debt limit is projected to bind again around the end of the coming winter, according to estimates reported by Fox. That is roughly when the forty-first trillion would arrive at today's pace. Watch for the familiar pattern: a flat stretch as the Treasury works around the limit, then a sudden jump when Congress acts. Either way, the forty-first stack will probably be a short one.
| Milestone | First day above | Days since previous trillion |
|---|---|---|
| $40 trillion | August 18, 2026 | |
| $39 trillion | March 17, 2026 | |
| $38 trillion | October 21, 2025 | |
| $37 trillion | August 11, 2025 | |
| $36 trillion | November 21, 2024 | |
| $35 trillion | July 26, 2024 | |
| $34 trillion | December 29, 2023 | |
| $33 trillion | September 15, 2023 | |
| $32 trillion | June 15, 2023 | |
| $31 trillion | October 3, 2022 | |
| $30 trillion | January 31, 2022 | |
| $29 trillion | December 16, 2021 | |
| $28 trillion | March 1, 2021 | |
| $27 trillion | October 1, 2020 | |
| $26 trillion | June 9, 2020 | |
| $25 trillion | May 5, 2020 | |
| $24 trillion | April 7, 2020 | |
| $23 trillion | October 31, 2019 | |
| $22 trillion | February 11, 2019 | |
| $21 trillion | March 15, 2018 | |
| $20 trillion | September 8, 2017 | |
| $19 trillion | January 29, 2016 | |
| $18 trillion | November 28, 2014 | |
| $17 trillion | October 17, 2013 | |
| $16 trillion | August 31, 2012 | |
| $15 trillion | November 15, 2011 | |
| $14 trillion | December 31, 2010 | |
| $13 trillion | June 1, 2010 | |
| $12 trillion | November 16, 2009 | |
| $11 trillion | March 16, 2009 | |
| $10 trillion | September 30, 2008 | |
| $9 trillion | August 31, 2007 | |
| $8 trillion | October 18, 2005 | |
| $7 trillion | January 15, 2004 | |
| $6 trillion | February 26, 2002 | |
| $5 trillion | February 23, 1996 |
Total public debt outstanding. Bars are capped at 700 days; the sixth trillion took 2,195. Debt-limit standoffs make some trillions look unusually slow or fast.
Sources and method
- U.S. Treasury, Fiscal Data: Debt to the Penny. Daily total public debt outstanding, April 1993 to October 7, 2026
- U.S. Treasury, Fiscal Data: Average Interest Rates on U.S. Treasury Securities. Total marketable debt, monthly
Total public debt outstanding includes debt held by the public and intragovernmental holdings (mainly trust funds such as Social Security). A milestone date is the first day Treasury's daily figure closed above each whole trillion. 'Days' are calendar days between consecutive milestones. Debt-limit standoffs distort the timing: while the limit binds, recorded debt stays flat, and it jumps once the limit is raised, so some trillions look unusually slow or fast.
Charts like this, from your own numbers.
Connect a spreadsheet or the tools you run on, and Parity builds the dashboard and writes the report, with every number checked.
Try Parity free

