Charts like this, from your own numbers.
Connect a spreadsheet or the tools you run on, and Parity builds the dashboard and writes the report, with every number checked.
Try Parity freeIn the second quarter of 2022, the price of a typical American house was 20.4% higher than a year earlier, according to the Federal Housing Finance Agency. No year in the half-century of its data had seen a faster rise. Four years later, in the year to 2026 Q2, the same index rose 3.0%. Mortgage rates explain much of the difference: Freddie Mac's weekly survey put the 30-year fixed rate at 7.24% on October 29, 2026, against 6.17% a year before.
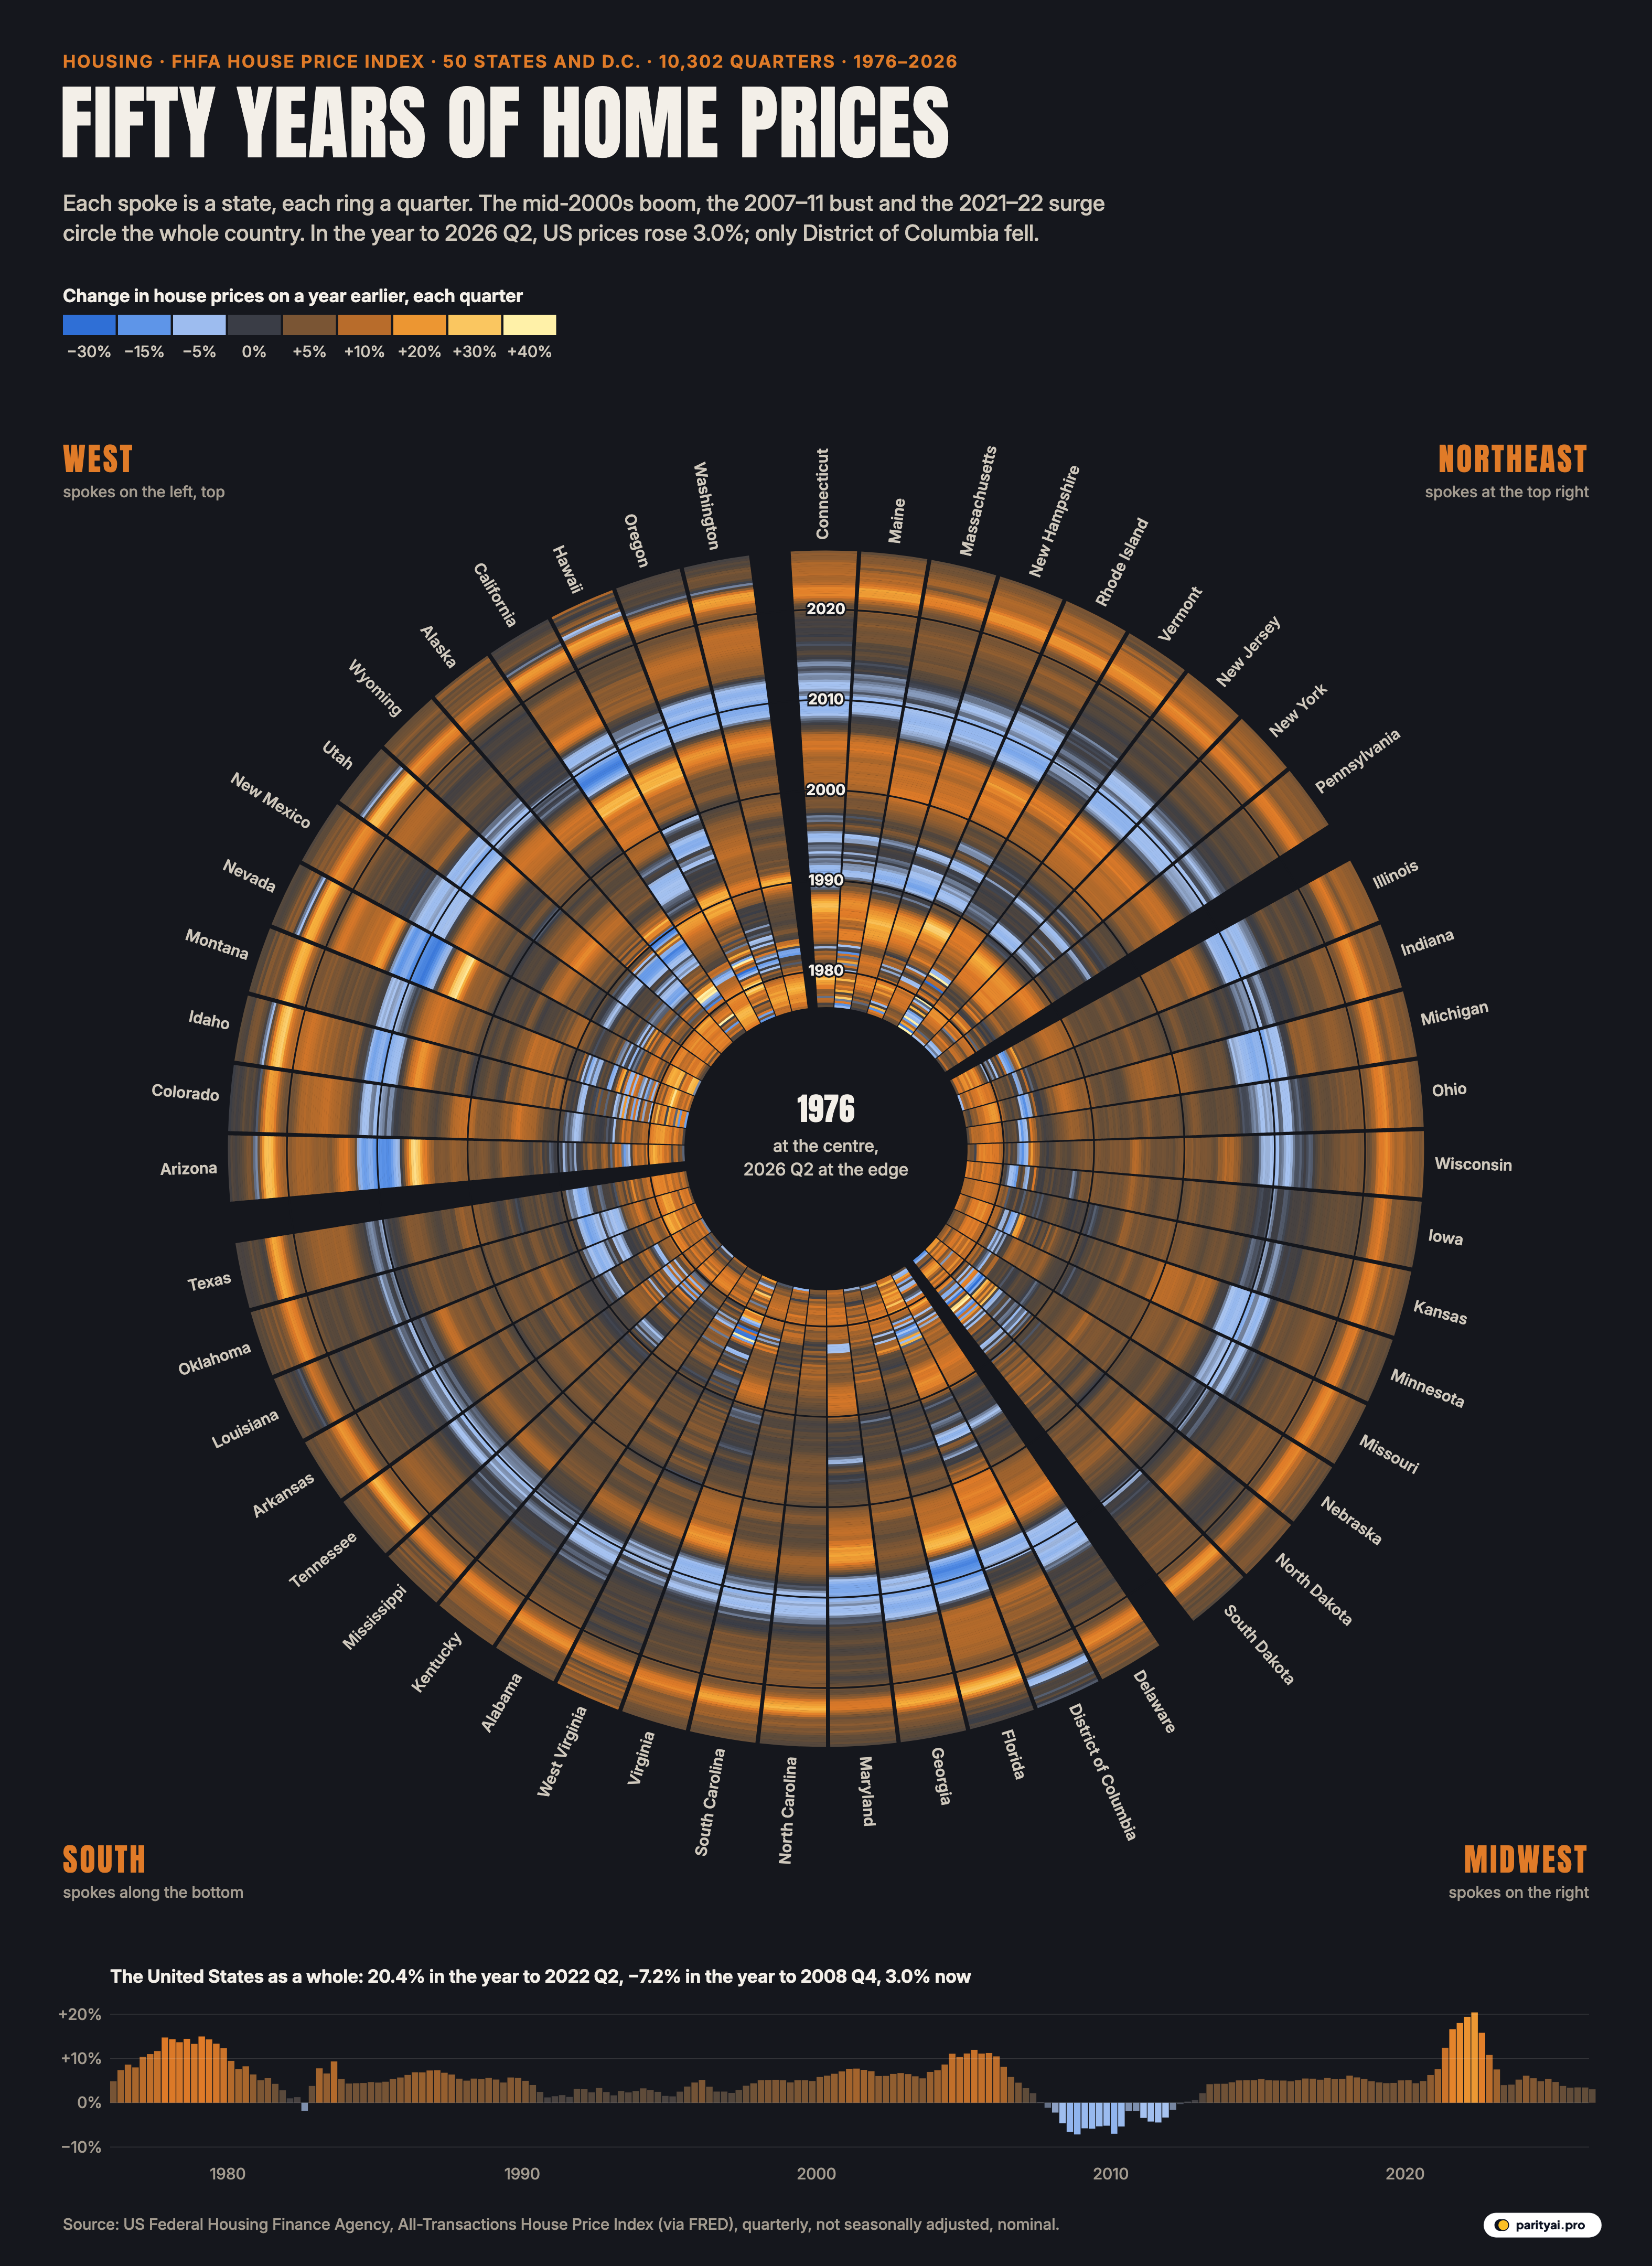
The circle above holds every quarter in between, and every quarter back to 1976, for all 50 states and Washington, D.C. Each of the 51 spokes is a state, grouped by Census region. Each spoke is divided into 202 thin rings, one per quarter, from 1976 at the centre to 2026 Q2 at the edge. The colour of each small cell is how much that state's house prices had changed from the same quarter a year before: blue for falling prices, charcoal for flat, orange for rising and pale yellow for very fast rises. That is 10302 cells in all.
The measure is FHFA's All-Transactions House Price Index. It is built from repeat sales of the same houses with mortgages backed by Fannie Mae or Freddie Mac, using a weighted, repeat-sales statistical technique, and it adds appraisals from refinancings. Because it compares a house with itself, it is not distorted by a change in the mix of homes sold.
The best way to read the circle is by colour. Each band of the legend tells part of the story.
Deep blue: the crash
The darkest blue in the circle comes in one band, in the rings for 2007 to 2012, and it is concentrated in a few spokes. Find Nevada, Arizona, California and Florida, and the blue there is deeper and lasts longer than anywhere else.
The numbers are stark. From its peak in 2006 Q3 to its low in 2012 Q2, Nevada's index fell 55.7%. Arizona fell 46.0%, Florida 44.7%, California 41.0% and Michigan 29.4%. In all, 17 states and D.C. saw falls of more than a fifth from their 2000s peak.
Nationally, the all-transactions index peaked in 2007 Q1 and fell 19.0% to its low in 2012 Q2. Other measures show a deeper fall; the S&P Case-Shiller national index, which uses only sales, dropped about 27% from July 2006 to February 2012 in its current revised data. In the worst quarter for breadth, 2010 Q1, prices were lower than a year earlier in 50 of the 51 spokes.
Pale blue: the quiet slides
Paler blue cells mark smaller falls, and they appear in places the 2000s bust barely touched. Around 1990, a ring of pale blue runs through the Northeast spokes, from Maine and New Hampshire to New York and New Jersey, and through California. Between 1990 and 1996, 11 states had at least one quarter with prices more than 3% below a year earlier.
Earlier still, near the centre, the oil states have their own pale-blue patch in the mid-1980s: Texas, Oklahoma, Louisiana, Alaska and Wyoming. On the outer edge the circle is almost free of blue. In the year to 2026 Q2, the only spoke with falling prices was the District of Columbia, at −0.6%.
A note on the oddest cells in the circle: the single largest rise, 75.3% in Hawaii, 1982 Q4, and the single largest fall, −54.7% in Hawaii, 1981 Q4, both sit near the centre in Hawaii's spoke. In those early years the index rests on few sales in a small state, and big swings in the measured price say more about the sample than the market.
| State | Year to 2026 Q2 | Annual change, 2000–2026 | 2019 Q4 → 2022 Q2 | 2000s peak → trough |
|---|---|---|---|---|
| Hawaii | ▲ 8.7% | +31.1% | −18.5% | |
| West Virginia | ▲ 8.0% | +25.4% | −7.3% | |
| Illinois | ▲ 6.0% | +25.7% | −21.8% | |
| Connecticut | ▲ 5.7% | +34.4% | −20.1% | |
| Wisconsin | ▲ 5.6% | +33.4% | −11.9% | |
| New Jersey | ▲ 5.4% | +35.0% | −22.1% | |
| New York | ▲ 5.3% | +30.2% | −14.0% | |
| Rhode Island | ▲ 5.0% | +40.8% | −27.6% | |
| Kentucky | ▲ 4.7% | +33.1% | −4.4% | |
| North Dakota | ▲ 4.7% | +19.5% | none | |
| Pennsylvania | ▲ 4.7% | +31.3% | −9.4% | |
| Michigan | ▲ 4.6% | +34.5% | −29.4% | |
| Indiana | ▲ 4.6% | +36.9% | −7.3% | |
| Vermont | ▲ 4.3% | +38.5% | −6.8% | |
| Ohio | ▲ 4.3% | +35.5% | −12.9% | |
| Delaware | ▲ 4.0% | +34.1% | −20.4% | |
| New Hampshire | ▲ 3.9% | +42.3% | −20.0% | |
| Alaska | ▲ 3.9% | +25.7% | −2.7% | |
| South Carolina | ▲ 3.8% | +41.2% | −13.0% | |
| Kansas | ▲ 3.8% | +33.9% | −5.0% | |
| Virginia | ▲ 3.8% | +32.8% | −17.4% | |
| Mississippi | ▲ 3.7% | +28.1% | −8.9% | |
| Alabama | ▲ 3.7% | +36.2% | −10.4% | |
| Wyoming | ▲ 3.7% | +31.9% | −7.7% | |
| Missouri | ▲ 3.6% | +35.4% | −11.0% | |
| Maine | ▲ 3.2% | +45.7% | −13.1% | |
| Iowa | ▲ 3.2% | +26.8% | −2.5% | |
| Nebraska | ▲ 3.2% | +33.8% | −2.9% | |
| Massachusetts | ▲ 3.2% | +33.9% | −17.6% | |
| Arkansas | ▲ 3.2% | +35.8% | −6.7% | |
| Minnesota | ▲ 3.0% | +30.9% | −21.8% | |
| Idaho | ▲ 3.0% | +63.5% | −27.0% | |
| Louisiana | ▲ 2.9% | +22.4% | −4.2% | |
| Oklahoma | ▲ 2.8% | +33.4% | −3.6% | |
| Montana | ▲ 2.7% | +50.9% | −10.1% | |
| Tennessee | ▲ 2.6% | +48.9% | −8.9% | |
| Utah | ▲ 2.6% | +57.2% | −21.9% | |
| Nevada | ▲ 2.5% | +46.5% | −55.7% | |
| North Carolina | ▲ 2.4% | +46.6% | −13.1% | |
| Maryland | ▲ 2.2% | +28.6% | −25.3% | |
| South Dakota | ▲ 2.2% | +38.0% | −2.7% | |
| New Mexico | ▲ 2.1% | +36.0% | −15.7% | |
| Georgia | ▲ 1.9% | +45.3% | −24.4% | |
| Oregon | ▲ 1.7% | +39.5% | −26.0% | |
| Texas | ▲ 1.6% | +41.7% | −4.1% | |
| Florida | ▲ 1.4% | +53.0% | −44.7% | |
| Washington | ▲ 1.0% | +46.3% | −25.2% | |
| Arizona | ▲ 0.9% | +59.0% | −46.0% | |
| California | ▲ 0.9% | +38.7% | −41.0% | |
| Colorado | ▲ 0.2% | +42.1% | −10.1% | |
| District of Columbia | ▼ 0.6% | +20.7% | −11.9% |
FHFA All-Transactions index, nominal. The bust column is the largest fall from a 2004–09 peak to a low before 2015.
Charcoal: the long flat stretches
The charcoal cells, where prices changed by only a few percent a year, fill more of the circle than any other colour. Most of the 1990s and much of the 2010s are charcoal or dull brown in most spokes. These were the years when house prices rose roughly with incomes and inflation.
Some states barely left the charcoal. The 2000s bust skipped a group of states in the middle of the country: Kansas, Kentucky, Louisiana, Texas, Oklahoma, Nebraska, Alaska, South Dakota, Iowa, North Dakota never fell more than 5% from their mid-2000s highs. Those are mostly states that also missed the frenzy before it. Their spokes are calmer across the whole circle.
The outermost rings, 2023 to 2026, are turning charcoal again. In the year to 2026 Q2, 9 spokes, D.C. included, had gains of less than 2% or a fall: Colorado was up 0.2%, California and Arizona each 0.9%. Florida was up 1.4% and Texas 1.6%. FHFA's headline index, which uses purchases only, put the national rise at 2.1 percent over the same period and found prices falling in four states. On S&P's measure, some Sun Belt cities were already lower than a year earlier by May 2026: Tampa, Phoenix and Dallas all posted annual declines.
Orange: the two booms
Orange runs around the circle twice in recent decades. The first ring is the bubble of the mid-2000s, brightest in the spokes that later turned deepest blue. Nationally, the index rose 11.9% in its fastest year before 2007.
The second orange ring, in 2021 and 2022, is wider and reaches almost every spoke. Between the fourth quarter of 2019 and the second quarter of 2022, US prices on this index rose 38.3%. The biggest gains were in the interior West: Idaho up 63.5%, Arizona 59.0% and Utah 57.2%. Even the slowest state, North Dakota, rose 19.5%. S&P's national index recorded its highest calendar-year increase in 34 years of data in 2021, at 18.8%.
The pandemic boom also reached further than the bubble did. In the second quarter of 2022, prices were up more than 10% on a year earlier in 50 of the 51 spokes. At the height of the 2000s bubble, in mid-2005, the figure was 25. Only the inflationary late 1970s come close: 43 spokes in the spring of 1979.
Pale yellow: the frenzies
The palest yellow cells, gains of 30% or more in a year, are rare. They flare in a few small-state spokes in the late 1970s and early 1980s, near the centre, among them Vermont, Hawaii, Alaska and South Dakota; then in Nevada and Arizona between 2004 and 2006; and once more in Idaho in 2021.
The innermost rings are more yellow than people tend to remember. In the late 1970s house prices across most of the country were rising at double-digit rates, but so were all prices: this was a decade of high inflation. Over the whole period, the national index has risen 11.4 times since the start of 1976. Because the index is not adjusted for inflation, a good part of that is the general rise in prices rather than housing alone.
Then and now
Taking the longest view, the states that rose most since 2000 are not all the ones that boomed hardest. On this index, prices in District of Columbia are up 341.7% since the first quarter of 2000, the most of any spoke, ahead of Idaho (317.9%), Hawaii (327.2%) and Florida (311.3%). The smallest rise since 2000 is in Michigan, at 131.4%. Nationally, prices are 213.1% higher than in 2000 and 62.3% higher than at the end of 2019.
Since the end of 2019, the gap between states has narrowed and flipped in places. Washington, D.C., the biggest gainer since 2000, has risen only 14.6% since 2019 and is the one place now falling. Idaho, the biggest pandemic gainer, is up 77.3% since 2019 but just 3.0% in the past year.
At the other end of the outer ring, the fastest gains in the year to 2026 Q2 were in places that were never at the centre of either boom. Hawaii led at 8.7%, followed by West Virginia at 8.0% and Illinois at 6.0%. New York was up 5.3% and Michigan 4.6%.
Reading the circle with care
Three cautions. The index covers houses financed with mortgages backed by Fannie Mae and Freddie Mac, so it leaves out cash sales and very expensive homes with jumbo loans; it describes the middle of the market. The colours show the change on a year earlier, so a deep blue ring means prices were falling, not that they were low: a state can be blue and still far above where it was a decade before. And the latest quarters will be revised as more sales are recorded.
The circle also compresses time unevenly. Outer rings are longer than inner ones, so recent years take up more space on the page than the 1970s, although each ring is exactly one quarter.
The outer edge
Fifty years of American housing come down to a few rings that matter. Most of the circle is the slow orange-brown of prices rising a few percent a year. Two bright bands mark booms, and one blue band marks the crash that followed the first of them. For now, the outermost rings show prices still rising, slowly, in 50 states, and a market that looks, for the first time in years, like the long charcoal stretches of the past rather than either of the booms.
Sources and method
- US Federal Housing Finance Agency, All-Transactions House Price Index for the states and the United States (via FRED). Quarterly, 1975 Q1 to 2026 Q2, not seasonally adjusted, retrieved October 29, 2026
- FHFA House Price Index
The FHFA All-Transactions index tracks repeat sales and refinance appraisals of the same single-family homes with mortgages backed by Fannie Mae or Freddie Mac, so it measures the change in value of comparable houses rather than the mix of homes sold. Each cell is the change in a state's index from the same quarter a year earlier, which avoids seasonal swings. Prices are nominal; they are not adjusted for inflation. The most recent quarters are revised as more transactions are recorded.
Charts like this, from your own numbers.
Connect a spreadsheet or the tools you run on, and Parity builds the dashboard and writes the report, with every number checked.
Try Parity free

