Charts like this, from your own numbers.
Connect a spreadsheet or the tools you run on, and Parity builds the dashboard and writes the report, with every number checked.
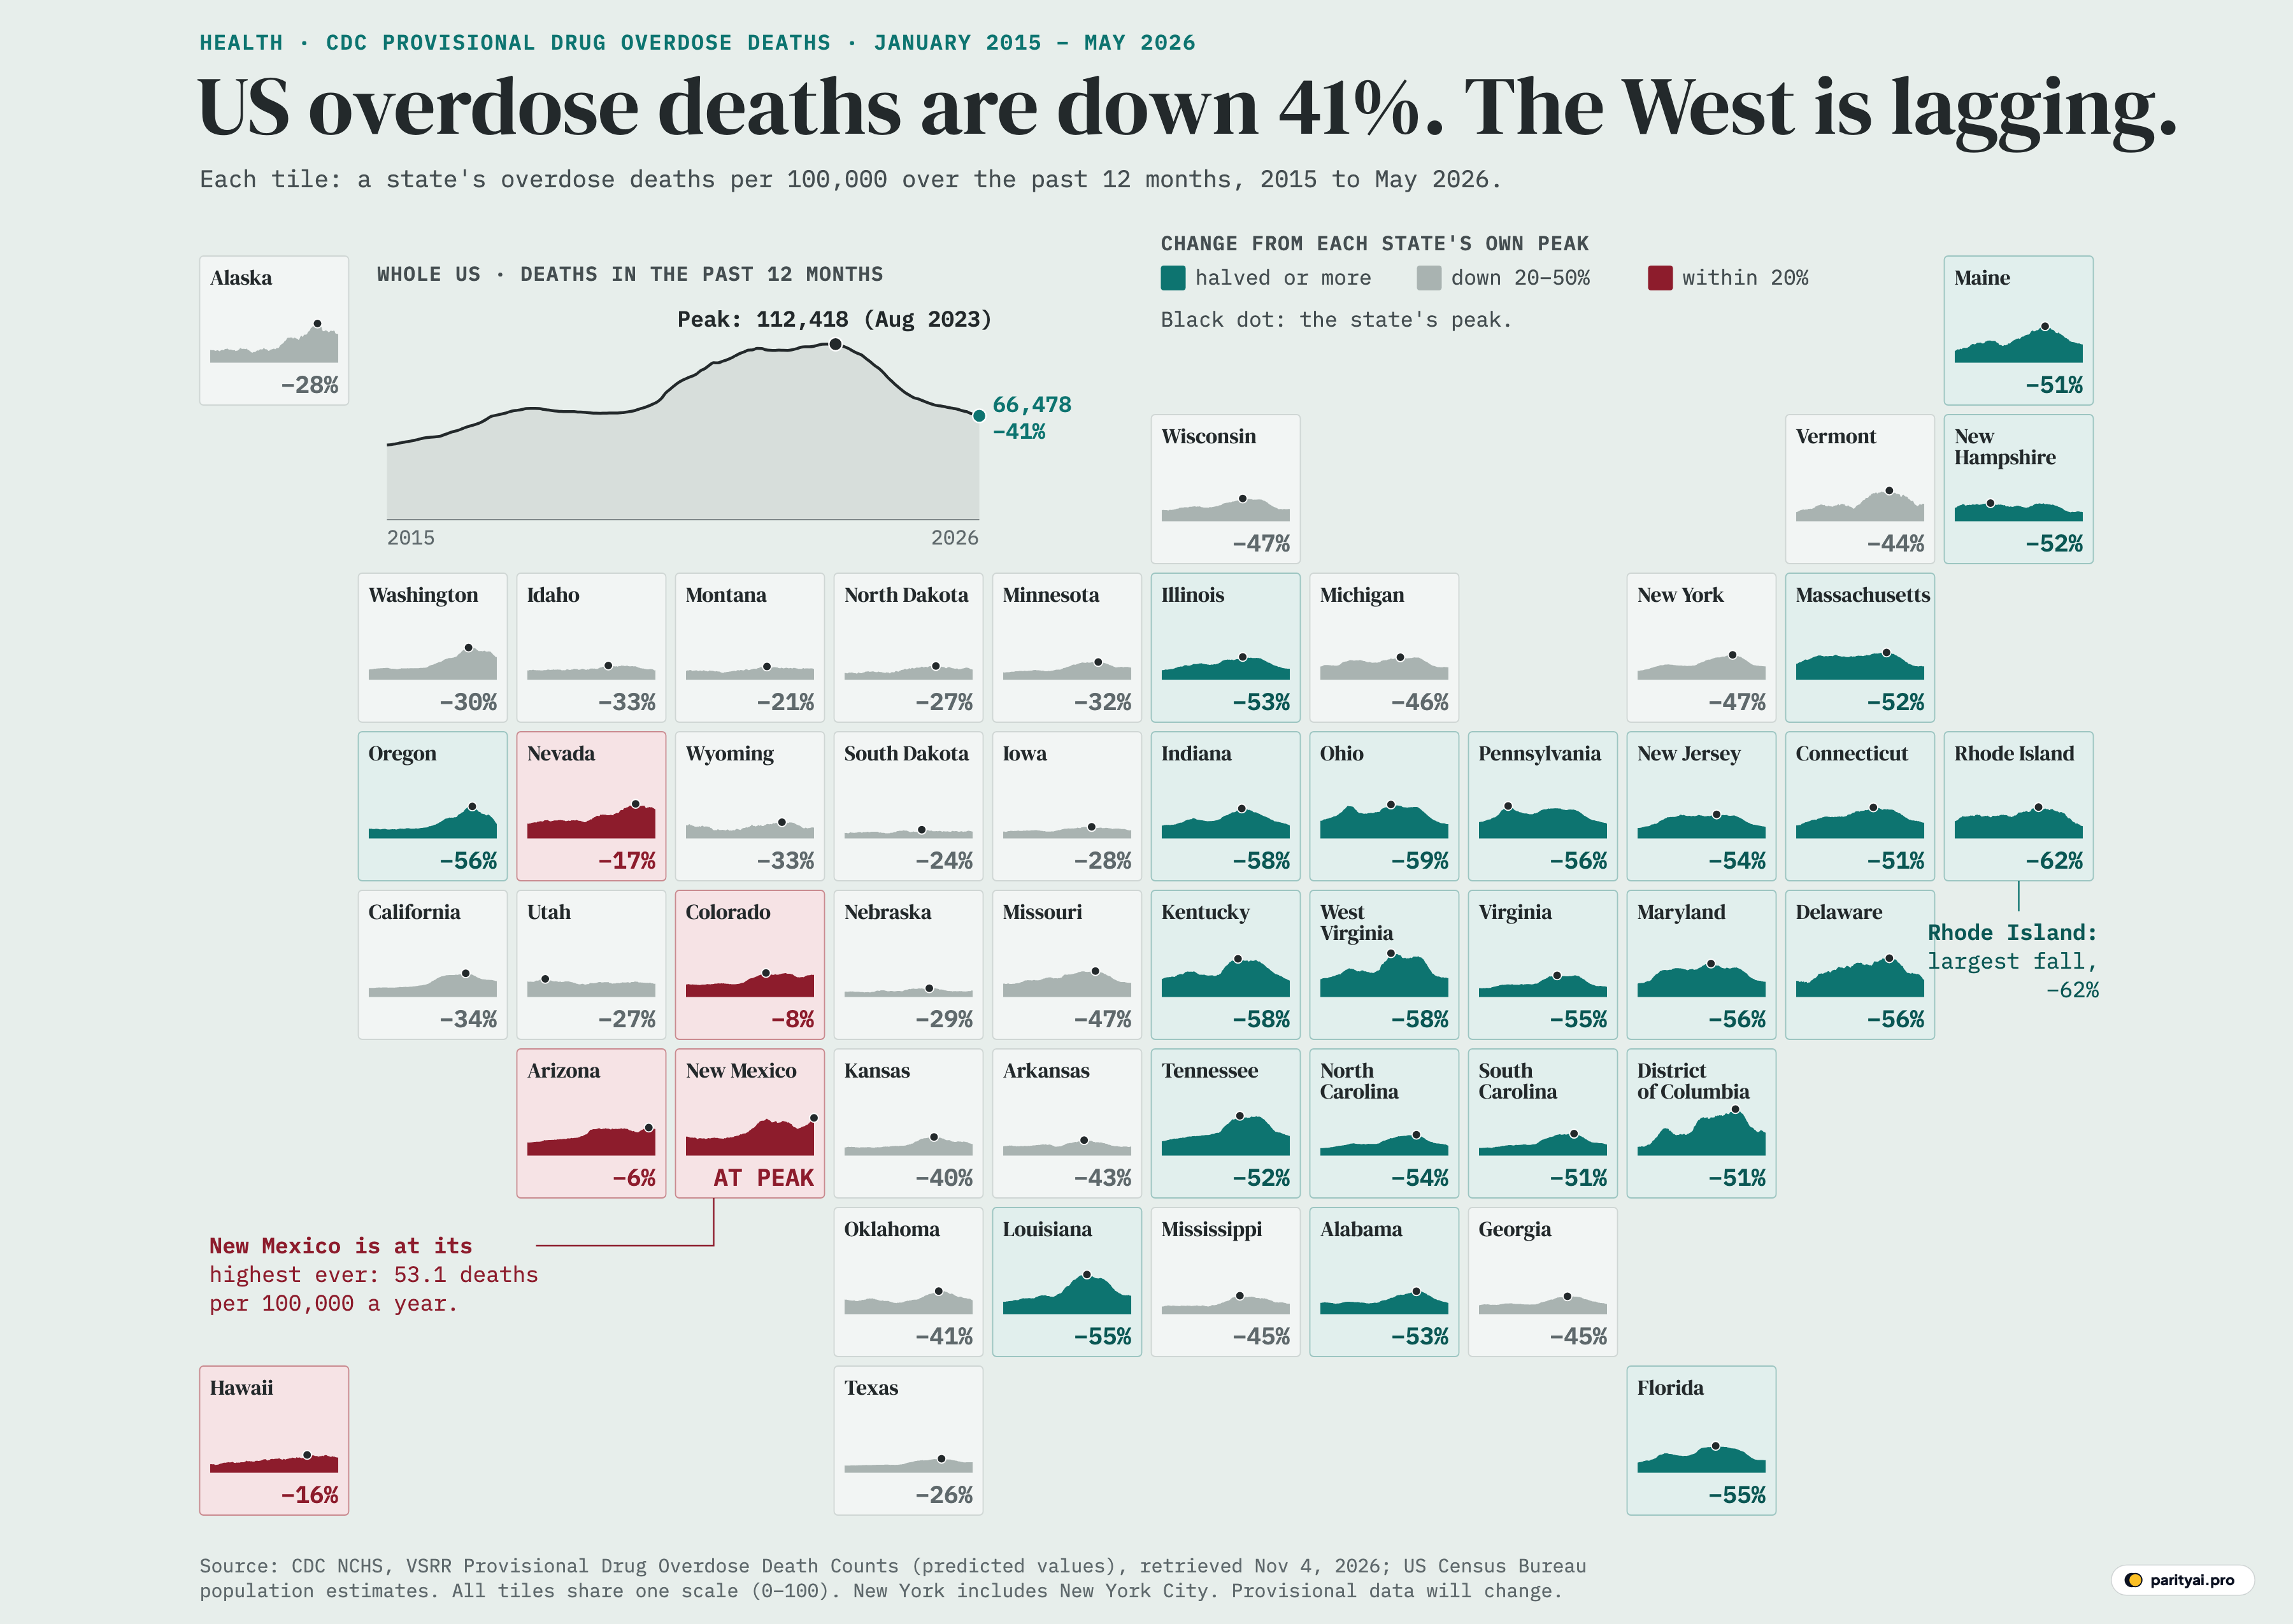
Try Parity freeFifty-one squares sit on the map above, and fifty of them have something in common: the line inside them has come down from a summit. The fifty-first is New Mexico. Its line ends at its highest point, 53.1 drug overdose deaths per 100,000 residents in the 12 months to May 2026, and its tile is the only one on the page marked "at peak". In the 12 months to May 2025 the state recorded 855 overdose deaths. A year later the count was 1,128, a change of +32%.
Almost everywhere else, the story runs the other way. Across the United States, the 12-month total of overdose deaths peaked at 112,418 in the year ending August 2023, according to the provisional counts published by the CDC's National Center for Health Statistics. In the year ending May 2026 the estimate was 66,478. That is 45,940 fewer deaths a year, a fall of 41%. Measured as a rate, which corrects for population growth, the national figure went from 33.4 to 19.5 per 100,000, down 42%. In 23 of the 51 tiles the rate has at least halved.
This piece is organised by drug rather than by place, because death certificates are coded that way and because the five main drug categories have had very different decades. Each section heading carries the code CDC uses for that drug, from the tenth revision of the International Classification of Diseases, and each is built from that indicator's own 12-month series.
Before the codes: how the map and the counts work
Each tile is one state or the District of Columbia, placed roughly where it sits on a map of the country. Inside it is an area chart of the 12-month-ending overdose death rate from January 2015 on the left to May 2026 on the right. All 51 tiles share one vertical scale, from zero to 100 deaths per 100,000, so a tall shape means a high death rate and a flat one a low rate. The black dot is the state's peak, and the percentage at bottom right is the change from that peak to May 2026. Colour sorts the tiles into three groups: teal for the 23 that have at least halved, grey for those down between 20% and 50%, and red for the 5 still within 20% of their peak, all of them in the West. The small line at top left is the whole country, in deaths rather than rates. New York's tile adds CDC's two separate New York series, the state outside New York City and the city itself.
"12-month ending" means what it says. Each value is, in CDC's words, "the number of deaths occurring in the 12-month period ending in the month indicated" (NCHS technical notes). A rolling window smooths out seasonal swings, but it also means a sudden change shows up gradually over a year of tiles.
The counts are provisional. Death certificates for overdoses often wait weeks or months for toxicology results, so CDC publishes both a reported count and a "predicted" one. The technical notes describe predicted counts as "estimates of the number of deaths adjusted for incomplete reporting". We use predicted values throughout. For the latest national month, the reported count is 65,351 and the predicted count 66,478, a gap of 1,127. The gap is widest in the newest months and closes as investigations finish.
One more rule shapes every section below: a single death can involve several drugs. CDC is explicit that "a single death might be included in more than one category" (NCHS). Add up the five categories in the year to May 2026 and you get 86,851, about 20,373 more than the total number of people who died. The drug figures in the table below overlap; they do not stack.
| Drug category | Year to Jan 2015 | Peak | Peak month | Year to May 2026 | From peak |
|---|---|---|---|---|---|
| Fentanyl and other synthetic opioids | 5,804 | July 2023 | ▼ 56% | ||
| Methamphetamine and other psychostimulants | 4,440 | August 2023 | ▼ 35% | ||
| Cocaine | 5,532 | August 2023 | ▼ 38% | ||
| Prescription-type opioids | 12,364 | May 2017 | ▼ 54% | ||
| Heroin | 10,853 | June 2017 | ▼ 89% |
Predicted provisional 12-month-ending counts. A death involving several drugs counts in each, so rows overlap and don't sum to the total.
T40.4: fentanyl and the other synthetic opioids
This is the line that built the peak and the line that has fallen furthest in absolute terms. In the 12 months to January 2015, synthetic opioids other than methadone, a category dominated by illicitly made fentanyl, were involved in 5,804 deaths. By July 2023 the figure was 78,327, about 13.5 times higher. In the year to May 2026 it was 34,507, down 56% from the peak and 43,820 lower. Synthetic opioids were involved in 70% of all overdose deaths at the national peak month; in the latest month the share was 52%.
The map's teal block in the Ohio Valley and the mid-Atlantic is largely a fentanyl story, since these were the states where the drug arrived first and killed most. West Virginia, long the state with the highest rates (CDC's archived state table listed it first in 2017 at "57.8 per 100,000", an age-adjusted figure, CDC), reached a crude 12-month rate of 88.9 in April 2021 on our measure. It now stands at 37.5, a fall of 58%. Ohio has fallen 59%, from a peak in April 2021, and Kentucky 58%. The largest drop of all is in Rhode Island, down 62% from 43.8 to 16.7 per 100,000. Ohio, Kentucky, Indiana and West Virginia follow, each 58% to 59% below its peak.
The District of Columbia had the highest peak rate on the map, 94.5 per 100,000 in September 2023, and it has since fallen 51%. Even so, at 45.8 its latest rate is second only to New Mexico's.
The fentanyl line has not fallen everywhere. Comparing the 12 months to May 2026 with the 12 months to May 2023, synthetic-opioid deaths were higher in 5 of the 49 states with usable data for both periods: Alaska, Nevada, Utah, Arizona and New Mexico. In New Mexico they went from 624 to 738. New Mexico now has the highest synthetic-opioid death rate in the country at 34.7 per 100,000, ahead of the District of Columbia (29.7) and Alaska (27.8). A CDC study published in 2025 notes that illicit fentanyl "proliferated later" in western markets, and the shape of the western tiles is consistent with a wave that arrived late and has not yet broken in some places.
T43.6: methamphetamine and the other psychostimulants
The second-largest line belongs to a category CDC calls "psychostimulants with abuse potential", which in practice is mostly methamphetamine. Deaths involving these drugs rose from 4,440 in the year to January 2015 to 37,350 in the year to August 2023. They have fallen 35% since, to 24,409, a smaller decline than fentanyl's. As a result, their share of all overdose deaths has risen, from 33% at the national peak to 37% now.
Stimulant deaths are tangled up with opioids. CDC found that across January 2021 to June 2024, "Most (73.0%) stimulant-involved overdose deaths co-involved opioids", including 68.8% of methamphetamine-involved deaths (MMWR). So the falling meth line partly reflects the same fentanyl changes as the line above, and the two cannot be cleanly separated.
Where meth leads, the map turns west. In the latest 12 months, the psychostimulant death rate was higher than the synthetic-opioid rate in 16 states: Idaho, Montana, Nevada, Wyoming, South Dakota, Iowa, California, Utah, Nebraska, Kentucky, Kansas, Arkansas, Oklahoma, Mississippi, Hawaii and Texas. The highest psychostimulant rates are in New Mexico (30.2 per 100,000), Nevada (24.2) and Alaska (22.2). Compared with the year to May 2023, psychostimulant deaths were up in 7 places: Alaska, Nevada, Colorado, Arizona, New Mexico, the District of Columbia and Hawaii. Arizona went from 1,471 to 1,630 and New Mexico from 498 to 642.
That pattern helps explain why the West looks different on the map. We grouped 13 states as western: Washington, Oregon, California, Nevada, Idaho, Montana, Wyoming, Utah, Colorado, Arizona, New Mexico, Alaska and Hawaii. Their average fall from peak is 24%; the other 38 tiles average 48%. Only 1 western state, Oregon, has halved, against 22 of the 38 elsewhere.
| State | Rate since 2015 | Peak month | Deaths, year to May 2026 | Rate vs peak |
|---|---|---|---|---|
| New Mexico | May 2026 | 1,128 | 0% | |
| Arizona | October 2025 | 2,822 | ▼ 6% | |
| Colorado | February 2022 | 1,847 | ▼ 8% | |
| Hawaii | August 2023 | 295 | ▼ 16% | |
| Nevada | August 2024 | 1,323 | ▼ 17% | |
| Montana | March 2022 | 165 | ▼ 21% | |
| Utah | August 2016 | 646 | ▼ 27% | |
| Alaska | July 2024 | 292 | ▼ 28% | |
| Washington | November 2023 | 2,528 | ▼ 30% | |
| Wyoming | July 2023 | 88 | ▼ 33% | |
| Idaho | March 2022 | 265 | ▼ 33% | |
| California | August 2023 | 8,554 | ▼ 34% | |
| Oregon | March 2024 | 848 | ▼ 56% |
Thirteen western states, sorted by how little they have fallen. New Mexico's latest month is its peak.
Arizona's peak came as late as October 2025, and its rate is just 6% below it. Colorado peaked back in February 2022 but has climbed again: its deaths rose from 1,674 to 1,847 in the latest year, +10%. Nevada is 17% below a peak reached in August 2024, and Alaska 28% below a peak in July 2024. Utah is the odd case: its peak came in August 2016, before fentanyl reached most of the West, and it sits 27% below it.
T40.5: cocaine
Cocaine's line rose later than fentanyl's and has fallen less. Cocaine-involved deaths numbered 5,532 in the year to January 2015 and peaked at 30,765 in the year to August 2023, the same month as psychostimulants. They are now 19,225, down 38%. Psychostimulants overtook cocaine nationally in the year to August 2019 and have stayed ahead.
The co-involvement figure is even higher here: CDC put it at 79.1% of cocaine-involved deaths for 2021 to mid-2024 (MMWR). The highest latest rates among the 45 places with reportable data are in the District of Columbia (25.5 per 100,000), Vermont (12.4) and Maine (11.8). In 19 places the cocaine rate is higher than the psychostimulant rate. Yet the states where cocaine deaths are now above their May 2023 level are mostly western or rural: Alaska, New Hampshire, Nevada, Iowa, Utah, Colorado, Nebraska, Arizona, New Mexico and Hawaii.
T40.1: heroin
Heroin is the clearest case of one drug replacing another. In the year to January 2015, heroin was involved in 10,853 overdose deaths. It peaked at 16,288 in the year to June 2017, then gave way as fentanyl took over the illicit opioid supply. Synthetic opioids passed heroin in the national counts in the year to August 2016. Heroin deaths are now 1,714, down 89% from the peak, and are 3% of the total. No state with comparable data shows a rise since May 2023.
NIDA's figures from final data tell the same story over a longer span: heroin deaths "rose from 3,036 in 2010 to 15,469 in 2016" before falling, and by 2022 about 80% of heroin deaths also involved illicit fentanyl (NIDA). Heroin reporting is also the patchiest of the five: only 34 places have a reportable latest figure. The highest rates are in the District of Columbia (3.2 per 100,000), New York and Illinois (both 1.6).
T40.2: the prescription-type opioids
The last line is the oldest part of the crisis. "Natural and semi-synthetic opioids" covers drugs such as morphine, oxycodone and hydrocodone, whether they came from a pharmacy or not. Deaths involving them were already at 12,364 in the year to January 2015, and they peaked at 15,150 in the year to May 2017. They have drifted down since, to 6,996, 54% below the peak. Heroin deaths ran above this line from the year to November 2015 until the year to December 2020; prescription-type opioids are now the second-largest opioid category, though fentanyl's line is roughly five times higher.
This decline began before fentanyl's and follows a long fall in prescribing. CDC's archived prescribing maps note that the number of opioid prescriptions dispensed "peaked in 2012 at more than 255 million" (CDC, archived). The rates now are low and fairly even: the highest are in Nevada (4.1), Utah (4.0) and West Virginia (4.0) per 100,000.
What the codes cannot say: why deaths fell
The counts record which drugs were found, not why fewer people are dying. Researchers do not agree, and it is better to set out the competing views than to pick one.
One view is that the illicit supply changed. A study in Science, reported by STAT in January 2026, argued that the decline was "driven in large part by a sudden shift in North America's illicit drug supply in 2023" and that it "likely stems from a decrease in fentanyl potency". The DEA has reported that 29% of fentanyl pills it tested in the last fiscal year contained a potentially lethal dose, down from 76% two years earlier (ABC7). In the same STAT article, the epidemiologist Nabarun Dasgupta pushed back: "The shock doesn't explain the experience of the whole country."
Another view credits naloxone and treatment. The FDA approved over-the-counter Narcan in March 2023, months before the national peak. But a research letter from Brown University found that "naloxone use did not increase relative to the number of overdoses as deaths have fallen since 2023" (Brown), though its data miss reversals made without a 911 call. A Brookings analysis argues that wider buprenorphine prescribing "has not yet translated into a meaningful surge in treatment uptake", that ideas about a shrinking pool of vulnerable users "lack supporting evidence", and calls the decline "largely a puzzle". The Associated Press summed up the state of knowledge plainly: "Researchers cannot yet say with confidence why deaths have gone down" (AP via Fortune).
A weaker fentanyl supply is not necessarily a safer one. In Philadelphia, the sedative medetomidine was found in 72% of illegal opioid samples tested in late 2024 as xylazine faded (MMWR).
Limits of the tiles
- Provisional, and still moving. These are not final statistics. CDC's May 2025 release put 2024 at an estimated 80,391 deaths, "a decrease of 26.9%" (NCHS); the current file puts calendar 2024 at 81,313. NPR reported 69,973 deaths for 2025 in May 2026 (NPR); the same series now reads 70,735. Expect the latest months to be revised again.
- Pending investigations. The predicted values adjust for deaths still under investigation, but the adjustment is a model. Drug-specific counts are more sensitive than totals, because a death can be counted before toxicology names the drug.
- Rolling windows. Every value covers 12 months. "May 2026" means June 2025 through May 2026. A turn in a state's trend takes months to show.
- Overlapping drugs. The drug categories are not exclusive, and some deaths list no specific drug, so the drug lines can't be added up or compared with the total as shares of a whole.
- Crude rates. We divide by each state's July population estimate for the year (2025 for the 2026 months). The rates are not age-adjusted, so they will not match CDC's published age-adjusted rates.
- Missing drug data. CDC withholds drug-specific figures where reporting quality is low. Oregon has no reportable drug detail for the latest month, and heroin is missing for many states.
The whole table
Sorted from the largest fall to the smallest, with each state's rate trend since 2015. The rows highlighted are the five within 20% of their peak.
| # | State | Rate, 2015–2026 | Peak (per 100k) | Peak month | May 2026 | Change from peak |
|---|---|---|---|---|---|---|
| 1 | Rhode Island | 43.8 | June 2022 | 16.7 | ▼ 62% | |
| 2 | Ohio | 47.5 | April 2021 | 19.5 | ▼ 59% | |
| 3 | Kentucky | 53.7 | October 2021 | 22.4 | ▼ 58% | |
| 4 | Indiana | 41.9 | February 2022 | 17.6 | ▼ 58% | |
| 5 | West Virginia | 88.9 | April 2021 | 37.5 | ▼ 58% | |
| 6 | Delaware | 54.5 | April 2023 | 24.1 | ▼ 56% | |
| 7 | Maryland | 46.8 | July 2021 | 20.7 | ▼ 56% | |
| 8 | Pennsylvania | 45.4 | August 2017 | 20.1 | ▼ 56% | |
| 9 | Oregon | 44.8 | March 2024 | 19.8 | ▼ 56% | |
| 10 | Louisiana | 55.8 | June 2022 | 25.1 | ▼ 55% | |
| 11 | Florida | 37.6 | December 2021 | 17.1 | ▼ 55% | |
| 12 | Virginia | 30.1 | December 2021 | 13.6 | ▼ 55% | |
| 13 | North Carolina | 41.6 | July 2023 | 19.1 | ▼ 54% | |
| 14 | New Jersey | 33.3 | January 2022 | 15.4 | ▼ 54% | |
| 15 | Illinois | 31.9 | March 2022 | 15.1 | ▼ 53% | |
| 16 | Alabama | 31.9 | July 2023 | 15.1 | ▼ 53% | |
| 17 | Massachusetts | 38.2 | January 2023 | 18.3 | ▼ 52% | |
| 18 | New Hampshire | 36.2 | March 2018 | 17.3 | ▼ 52% | |
| 19 | Tennessee | 55.9 | December 2021 | 26.9 | ▼ 52% | |
| 20 | District of Columbia | 94.5 | September 2023 | 45.8 | ▼ 51% | |
| 21 | Maine | 51.2 | January 2023 | 25.0 | ▼ 51% | |
| 22 | South Carolina | 43.8 | June 2023 | 21.5 | ▼ 51% | |
| 23 | Connecticut | 43.4 | November 2021 | 21.3 | ▼ 51% | |
| 24 | New York | 34.7 | June 2023 | 18.3 | ▼ 47% | |
| 25 | Wisconsin | 31.6 | March 2022 | 16.7 | ▼ 47% | |
| 26 | Missouri | 36.3 | March 2023 | 19.2 | ▼ 47% | |
| 27 | Michigan | 31.3 | February 2022 | 17.0 | ▼ 46% | |
| 28 | Georgia | 24.6 | November 2022 | 13.5 | ▼ 45% | |
| 29 | Mississippi | 25.4 | December 2021 | 14.1 | ▼ 45% | |
| 30 | Vermont | 43.1 | April 2023 | 24.0 | ▼ 44% | |
| 31 | Arkansas | 21.2 | March 2022 | 12.0 | ▼ 43% | |
| 32 | Oklahoma | 32.1 | May 2023 | 18.9 | ▼ 41% | |
| 33 | Kansas | 25.7 | December 2022 | 15.5 | ▼ 40% | |
| 34 | California | 33.0 | August 2023 | 21.7 | ▼ 34% | |
| 35 | Idaho | 19.6 | March 2022 | 13.1 | ▼ 33% | |
| 36 | Wyoming | 22.2 | July 2023 | 14.9 | ▼ 33% | |
| 37 | Minnesota | 24.6 | June 2023 | 16.8 | ▼ 32% | |
| 38 | Washington | 45.3 | November 2023 | 31.6 | ▼ 30% | |
| 39 | Nebraska | 11.7 | July 2022 | 8.3 | ▼ 29% | |
| 40 | Iowa | 15.6 | November 2022 | 11.2 | ▼ 28% | |
| 41 | Alaska | 55.0 | July 2024 | 39.6 | ▼ 28% | |
| 42 | Utah | 25.1 | August 2016 | 18.3 | ▼ 27% | |
| 43 | North Dakota | 18.8 | February 2023 | 13.8 | ▼ 27% | |
| 44 | Texas | 19.0 | August 2023 | 14.0 | ▼ 26% | |
| 45 | South Dakota | 11.5 | November 2021 | 8.8 | ▼ 24% | |
| 46 | Montana | 18.2 | March 2022 | 14.4 | ▼ 21% | |
| 47 | Nevada | 48.5 | August 2024 | 40.3 | ▼ 17% | |
| 48 | Hawaii | 24.5 | August 2023 | 20.6 | ▼ 16% | |
| 49 | Colorado | 33.5 | February 2022 | 30.7 | ▼ 8% | |
| 50 | Arizona | 39.2 | October 2025 | 37.0 | ▼ 6% | |
| 51 | New Mexico | 53.1 | May 2026 | 53.1 | 0% |
12-month-ending drug overdose deaths per 100,000 residents (crude rate), CDC predicted provisional counts. Highlighted rows are less than 20% below their peak.
New Mexico's tile is the one to watch in the next releases. Its rate in the year to May 2026 was 53.1 per 100,000, about double its 26.2 at the start of 2015 and higher than the national rate ever reached. Nationally, 45,940 fewer people died in the latest 12 months than at the peak. Whether the decline spreads west, stalls or reverses there will decide much of what the next set of tiles looks like.
Sources and method
- CDC National Center for Health Statistics, VSRR Provisional Drug Overdose Death Counts (dataset xkb8-kh2a). 12-month-ending counts by state and month, January 2015 to May 2026, retrieved November 4, 2026. Public domain.
- US Census Bureau, state population estimates (Vintage 2025 and Vintage 2020). July 1 resident population, 2015–2025, used to compute rates. Public domain.
We use CDC's predicted provisional counts, which adjust reported counts for deaths still under investigation and for reporting delays; where a predicted value is missing we use the reported value. Each value is a rolling total of deaths in the 12 months ending in the month shown, by state of residence where the death occurred in the US. New York's tile adds CDC's separate New York (excluding New York City) and New York City series. Rates divide each 12-month total by the state's July 1 Census population estimate for the calendar year of the ending month (2025 for 2026 months); they are crude rates, not age-adjusted. A state's peak is its highest 12-month-ending rate from January 2015 on, and its change is from that peak to May 2026. Drug categories come from death-certificate codes, overlap (one death can involve several drugs) and are only shown for states where CDC rates the drug reporting quality adequate. Provisional numbers will change as investigations close.
Charts like this, from your own numbers.
Connect a spreadsheet or the tools you run on, and Parity builds the dashboard and writes the report, with every number checked.
Try Parity free

