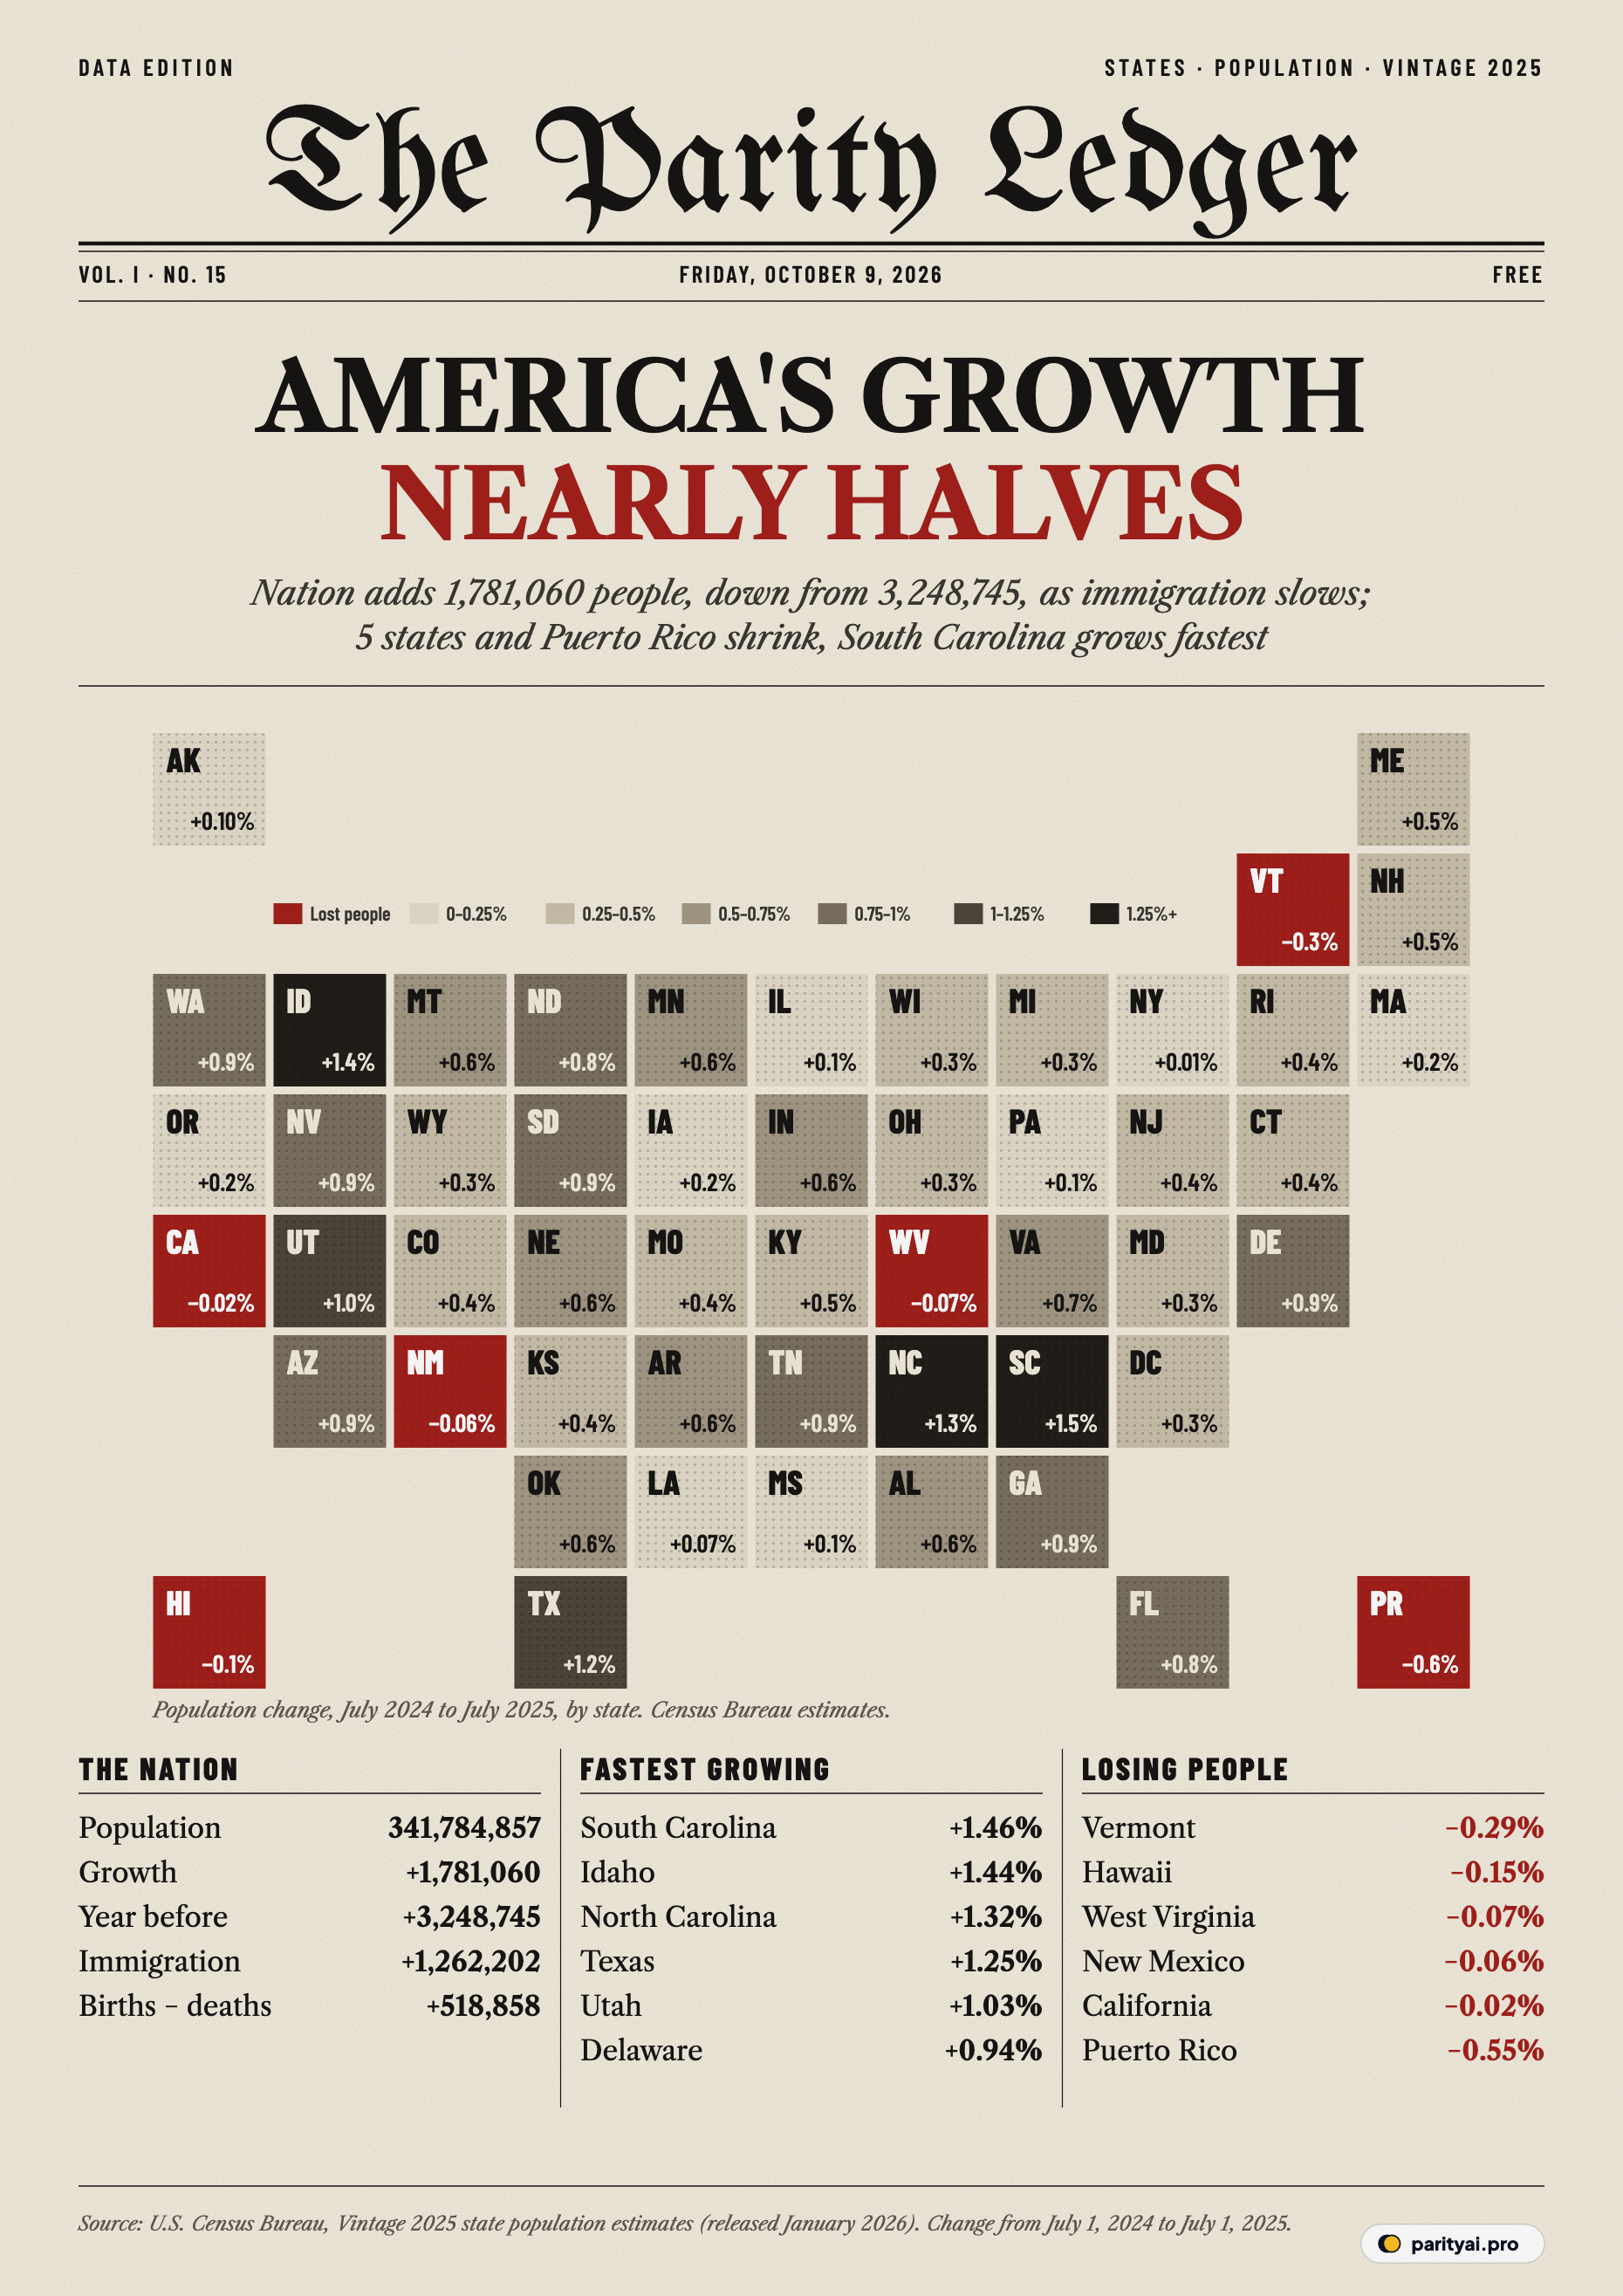
WASHINGTON — The United States grew by 1,781,060 people in the year to July 1, 2025, the Census Bureau estimates. That is barely more than half the 3,248,745 it added the year before, and growth slowed in all but two states.
The slowdown came almost entirely from immigration. Net international migration, the number of people moving to the country minus those leaving, fell from 2,734,468 to 1,262,202. Births exceeded deaths by only 518,858, so immigration still accounted for 71% of the nation's growth.
The Bureau's news release called it the country's "slowest population growth since the early period of the COVID-19 pandemic." The population reached 341,784,857, up 0.52% in a year, against 0.96% a year earlier.
Five states shrank: Vermont, Hawaii, West Virginia, New Mexico, California. Puerto Rico, which is not counted in the national total, lost −17,686 people.
Fastest growth in the Carolinas
South Carolina grew fastest, adding +1.46% to its population, followed by Idaho (+1.44%) and North Carolina (+1.32%). Texas (+1.25%) and Utah (+1.03%) completed the top five.
The leaders have something in common: they draw people from other states rather than from abroad. South Carolina gained 66,622 residents through domestic migration, people moving from elsewhere in the US, but only 12,930 through international migration. North Carolina drew the most domestic movers of any state, 84,064, ahead of Texas with 67,299.
In raw numbers, Texas still dwarfs everyone. It added 391,243 people, more than any other state, from a mix of births (157,711 more than deaths), immigration (167,475) and moves from other states (67,299). That was down from 599,331 the year before. Florida added 196,680, down from 336,590.
Two ways to grow in the Mountain West
The second- and fifth-fastest-growing states sit next to each other on the map but grow in different ways. Idaho added 28,861 people, and most of them came from other states: 19,915 net domestic movers, against 6,900 more births than deaths and 2,148 from abroad. For years it has drawn movers from elsewhere in the West, many of them looking for cheaper housing and more space than the coastal states offer.
Utah, by contrast, grows mostly from within. It added 35,921 people, and 24,961 of them came from births outnumbering deaths, the result of the youngest population and one of the highest birth rates of any state. Domestic migration added only 3,343. When immigration falls, a state like Utah barely notices. States that rely on newcomers from abroad, such as Florida, which gained 178,674 immigrants this year against just 22,517 from other states, feel it at once.
California edges down
California's population fell by −9,465, a rounding error for a state of 39 million but a symbolic one. Its numbers show the pattern of a state that people keep leaving. On balance, −229,077 residents left for other states, the largest domestic outflow in the country. Births minus deaths (109,715) and immigration (109,278) nearly made up for it, but not quite.
New York shows the same pattern from a stronger starting point. It lost −137,586 residents to other states but gained 95,634 from abroad, and ended almost exactly flat (+0.01%).
For Vermont (−0.29%), Hawaii (−0.15%), West Virginia (−0.07%) and New Mexico (−0.06%), the losses were small. In West Virginia the issue is natural decline: deaths outnumbered births by −7,887, more than the 6,408 who moved in from other states.
Immigration pullback hits everywhere
According to the Bureau, international migration fell from about 2.7 million to 1.3 million between the two years. Almost every state felt it. By our count, 49 of the 50 states and the District of Columbia grew more slowly, or shrank faster, than the year before. In its announcement the Bureau noted the two exceptions, Montana and West Virginia.
The South, where most of the country's growth happens, saw population growth fall below 1% for the first time since 2021, the Bureau said. Sun Belt states that had relied on a mix of domestic movers and immigrants felt the drop in the second.
The estimates cover the year to July 1, 2025, so they capture only the start of the tighter immigration enforcement of 2025. The economist Jed Kolko noted that the period does "not fully capture" the year's policy changes. The Bureau itself projected that, if current trends continue, net international migration could fall to about 321,000 in 2026. That is a quarter of this year's figure.
Five years of whiplash
Seen over a longer stretch, 2025 looks less like a collapse and more like the end of an unusual surge.
The pandemic year to July 2021 was the low point. The country grew by only 522,062: immigration had almost stopped, and births exceeded deaths by just 146,036, as COVID-19 deaths rose. Then the borders reopened. Net international migration jumped to 1,672,112 in the year to July 2022, 2,264,137 in 2023 and a peak of 2,734,468 in 2024. Those were the largest in the five years shown, and they drove total growth to 3,248,745 in 2024.
California's numbers show the same whiplash. It lost −374,881 people in 2021 and −27,580 in 2022, as residents left during the pandemic and immigration dried up. As immigration recovered, it grew again, by +56,320 in 2023 and +183,107 in 2024, before slipping to −9,465 this year. For California, immigration is what makes the difference between growing and shrinking, because the state loses so many residents to other states every year.
| Year to July 1 | Total growth | Net international migration | Births minus deaths | California |
|---|---|---|---|---|
| 2021 | 376,026 | 146,036 | ▼ 374,881 | |
| 2022 | 1,672,112 | 224,026 | ▼ 27,580 | |
| 2023 | 2,264,137 | 494,611 | ▲ 56,320 | |
| 2024 | 2,734,468 | 514,277 | ▲ 183,107 | |
| 2025 | 1,262,202 | 518,858 | ▼ 9,465 |
Census Bureau Vintage 2025 series, which revises earlier years. A small residual means components do not add exactly to the total.
Births, deaths and the arithmetic of growth
Without immigration, the United States would barely be growing. In the year to July 2025 there were 3,620,461 births and 3,101,603 deaths, a natural increase of 518,858. That is about 0.15% of the population, well below the levels of a generation ago. The country's fertility rate has been below the level needed to replace each generation for years, and an ageing population means more deaths each year.
That makes the national total very sensitive to immigration. If net international migration falls to the roughly 321,000 the Bureau projected for 2026, total growth would fall well under a million people a year. Births minus deaths would then account for most of it.
The map on the front page
The tile map on our front page gives every state, the District of Columbia and Puerto Rico a square of equal size, arranged roughly in its geographic position. That way small states such as Delaware and Rhode Island are as visible as Texas, and the colour, not the land area, carries the data.
Darker tiles grew faster; red tiles lost people. The darkest band runs through the Carolinas and the Mountain West: Idaho, Utah and Nevada. The red tiles sit at the edges of the map, in California, Hawaii and Vermont, along with West Virginia and New Mexico. In the middle of the country, most states grew by between a quarter and three-quarters of a percent.
| # | State | Population, July 2025 | Change 2024–25 | People | International migration | Domestic migration | Change 2023–24 |
|---|---|---|---|---|---|---|---|
| 1 | South Carolina | 5,570,274 | ▲ 1.46% | 12,930 | ▲ 66,622 | +1.85% | |
| 2 | Idaho | 2,029,733 | ▲ 1.44% | 2,148 | ▲ 19,915 | +1.54% | |
| 3 | North Carolina | 11,197,968 | ▲ 1.32% | 46,890 | ▲ 84,064 | +1.66% | |
| 4 | Texas | 31,709,821 | ▲ 1.25% | 167,475 | ▲ 67,299 | +1.95% | |
| 5 | Utah | 3,538,904 | ▲ 1.03% | 7,501 | ▲ 3,343 | +1.56% | |
| 6 | Delaware | 1,059,952 | ▲ 0.94% | 3,473 | ▲ 6,855 | +1.43% | |
| 7 | Washington | 8,001,020 | ▲ 0.92% | 46,202 | ▲ 9,238 | +1.14% | |
| 8 | Arizona | 7,623,818 | ▲ 0.89% | 28,219 | ▲ 31,107 | +1.40% | |
| 9 | Nevada | 3,282,188 | ▲ 0.88% | 10,551 | ▲ 14,914 | +1.32% | |
| 10 | Tennessee | 7,315,076 | ▲ 0.88% | 17,990 | ▲ 42,389 | +1.37% | |
| 11 | Georgia | 11,302,748 | ▲ 0.88% | 42,579 | ▲ 27,333 | +1.27% | |
| 12 | South Dakota | 935,094 | ▲ 0.86% | 3,183 | ▲ 2,169 | +1.02% | |
| 13 | Florida | 23,462,518 | ▲ 0.85% | 178,674 | ▲ 22,517 | +1.47% | |
| 14 | North Dakota | 799,358 | ▲ 0.75% | 2,810 | ▲ 512 | +0.80% | |
| 15 | Virginia | 8,880,107 | ▲ 0.69% | 40,436 | ▲ 6,268 | +1.00% | |
| 16 | Montana | 1,144,694 | ▲ 0.63% | 899 | ▲ 6,348 | +0.61% | |
| 17 | Oklahoma | 4,123,288 | ▲ 0.62% | 8,420 | ▲ 14,492 | +0.86% | |
| 18 | Nebraska | 2,018,006 | ▲ 0.62% | 6,599 | ▼ 366 | +0.88% | |
| 19 | Arkansas | 3,114,791 | ▲ 0.60% | 5,470 | ▲ 14,475 | +0.85% | |
| 20 | Alabama | 5,193,088 | ▲ 0.58% | 8,946 | ▲ 23,358 | +0.88% | |
| 21 | Minnesota | 5,830,405 | ▲ 0.57% | 12,486 | ▲ 8,300 | +0.77% | |
| 22 | Indiana | 6,973,333 | ▲ 0.56% | 17,852 | ▲ 12,197 | +0.78% | |
| 23 | Kentucky | 4,606,864 | ▲ 0.50% | 15,709 | ▲ 7,269 | +0.75% | |
| 24 | New Hampshire | 1,415,342 | ▲ 0.48% | 2,403 | ▲ 6,554 | +0.50% | |
| 25 | Maine | 1,414,874 | ▲ 0.46% | 4,040 | ▲ 7,406 | +0.46% | |
| 26 | New Jersey | 9,548,215 | ▲ 0.44% | 53,064 | ▼ 37,428 | +1.18% | |
| 27 | Missouri | 6,270,541 | ▲ 0.43% | 12,665 | ▲ 14,028 | +0.61% | |
| 28 | Kansas | 2,977,220 | ▲ 0.40% | 7,440 | ▼ 519 | +0.53% | |
| 29 | Colorado | 6,012,561 | ▲ 0.40% | 15,356 | ▼ 12,100 | +1.29% | |
| 30 | Connecticut | 3,688,496 | ▲ 0.38% | 17,534 | ▼ 5,945 | +0.91% | |
| 31 | Rhode Island | 1,114,521 | ▲ 0.37% | 5,923 | ▼ 1,551 | +0.84% | |
| 32 | Wyoming | 588,753 | ▲ 0.35% | 258 | ▲ 1,474 | +0.35% | |
| 33 | District of Columbia | 693,645 | ▲ 0.34% | 3,915 | ▼ 4,128 | +1.28% | |
| 34 | Ohio | 11,900,510 | ▲ 0.34% | 28,505 | ▲ 11,926 | +0.44% | |
| 35 | Maryland | 6,265,347 | ▲ 0.32% | 20,503 | ▼ 12,127 | +0.65% | |
| 36 | Michigan | 10,127,884 | ▲ 0.28% | 30,706 | ▲ 1,796 | +0.38% | |
| 37 | Wisconsin | 5,972,787 | ▲ 0.26% | 7,260 | ▲ 6,984 | +0.45% | |
| 38 | Iowa | 3,238,387 | ▲ 0.25% | 5,903 | ▼ 970 | +0.49% | |
| 39 | Massachusetts | 7,154,084 | ▲ 0.22% | 40,240 | ▼ 33,340 | +0.92% | |
| 40 | Oregon | 4,273,586 | ▲ 0.19% | 9,636 | ▲ 2,228 | +0.35% | |
| 41 | Mississippi | 2,954,160 | ▲ 0.14% | 7,451 | ▼ 917 | +0.26% | |
| 42 | Illinois | 12,719,141 | ▲ 0.13% | 44,752 | ▼ 40,017 | +0.55% | |
| 43 | Pennsylvania | 13,059,432 | ▲ 0.10% | 26,921 | ▼ 2,936 | +0.28% | |
| 44 | Alaska | 737,270 | ▲ 0.10% | 1,959 | ▼ 4,525 | +0.26% | |
| 45 | Louisiana | 4,618,189 | ▲ 0.07% | 14,900 | ▼ 14,387 | +0.35% | |
| 46 | New York | 20,002,427 | ▲ 0.01% | 95,634 | ▼ 137,586 | +1.09% | |
| 47 | California | 39,355,309 | ▼ 0.02% | 109,278 | ▼ 229,077 | +0.47% | |
| 48 | New Mexico | 2,125,498 | ▼ 0.06% | 2,879 | ▼ 2,267 | +0.35% | |
| 49 | West Virginia | 1,766,147 | ▼ 0.07% | 244 | ▲ 6,408 | −0.15% | |
| 50 | Hawaii | 1,432,820 | ▼ 0.15% | 4,768 | ▼ 8,876 | +0.00% | |
| 51 | Vermont | 644,663 | ▼ 0.29% | 623 | ▼ 726 | −0.19% | |
| – | Puerto Rico | 3,184,835 | ▼ 0.55% | −2,779 | 0 | −0.04% |
Census Bureau Vintage 2025 estimates, July 1, 2024 to July 1, 2025. Highlighted rows lost population. Bars show numeric gains only. Puerto Rico is listed last and is not ranked.
What the numbers measure
The figures are the Census Bureau's Vintage 2025 estimates, released in January 2026. They are not a head count. The Bureau starts from the 2020 census and adds births, subtracts deaths and estimates migration using tax records, Medicare enrolment, immigration statistics and survey data. Each new vintage revises earlier years, so the 2024 figures here may differ from those published a year ago.
Migration is the hardest part to estimate, and the Bureau said this year's international figures reflect "methodological improvements," including more administrative data at the state level. Domestic migration estimates rely heavily on address changes on tax returns. People who don't file, or who move without updating their address, can be missed.
The estimates also measure change over a year, so a single large event, such as a factory opening, a hurricane or a policy change, can show up sharply in one year and fade in the next. The 2020 census and the next one, in 2030, are the only true counts.
Why it matters
Population estimates aren't just trivia. They help decide how federal funding is split between states, and they feed the projections used to plan schools, roads and hospitals. After the 2030 census, the actual count will reapportion the 435 seats in the House of Representatives. If the patterns in these estimates hold, Texas, Florida and the Carolinas would be likely to gain seats, and California and New York to lose them.
A country that adds 1.8 million people a year still grows quickly by the standards of most rich nations. Few of them have natural growth to match, because most have fewer births. But the engine of that growth has been immigration, and this year's numbers show how fast the engine can slow.
The bottom of the fold
For a few places, 2025 marked a turning point: California's first decline since 2022, and the South's slowest growth in four years. For most of the country, it was simply a slower year. The next set of estimates, due in late 2026 or early 2027 and covering the year to July 2026, will show whether this was a dip or the new normal.
Sources and method
- U.S. Census Bureau, Vintage 2025 population estimates (NST-EST2025-ALLDATA). State totals and components of change, July 1, 2020 to July 1, 2025, released January 2026
Change is the Census Bureau's estimated population change from July 1, 2024 to July 1, 2025 (NPOPCHG_2025), divided by the July 1, 2024 estimate. Components (births minus deaths, net international migration and net domestic migration) are from the same file; a small residual makes the components differ slightly from the total. Puerto Rico is shown but not counted in US totals. Vintage 2025 revises earlier years, so 2024 figures here may differ from those published a year ago.
Charts like this, from your own numbers.
Connect a spreadsheet or the tools you run on, and Parity builds the dashboard and writes the report, with every number checked.
Try Parity free

