Charts like this, from your own numbers.
Connect a spreadsheet or the tools you run on, and Parity builds the dashboard and writes the report, with every number checked.
Try Parity freeTwo tide gauges at opposite corners of the country have spent the better part of a century writing opposite messages. At Grand Isle, a barrier island at the bottom of Louisiana, the sea has been rising at +3.59 inches per decade since 1947. At Skagway, at the top of Alaska's Inside Passage, the trend since 1944 is −7.14 inches per decade: the sea there is falling. Draw each trend as a straight line over its own record and Grand Isle's sea is about 28.4 inches higher than when the gauge began, while Skagway's is about 58.5 inches lower.
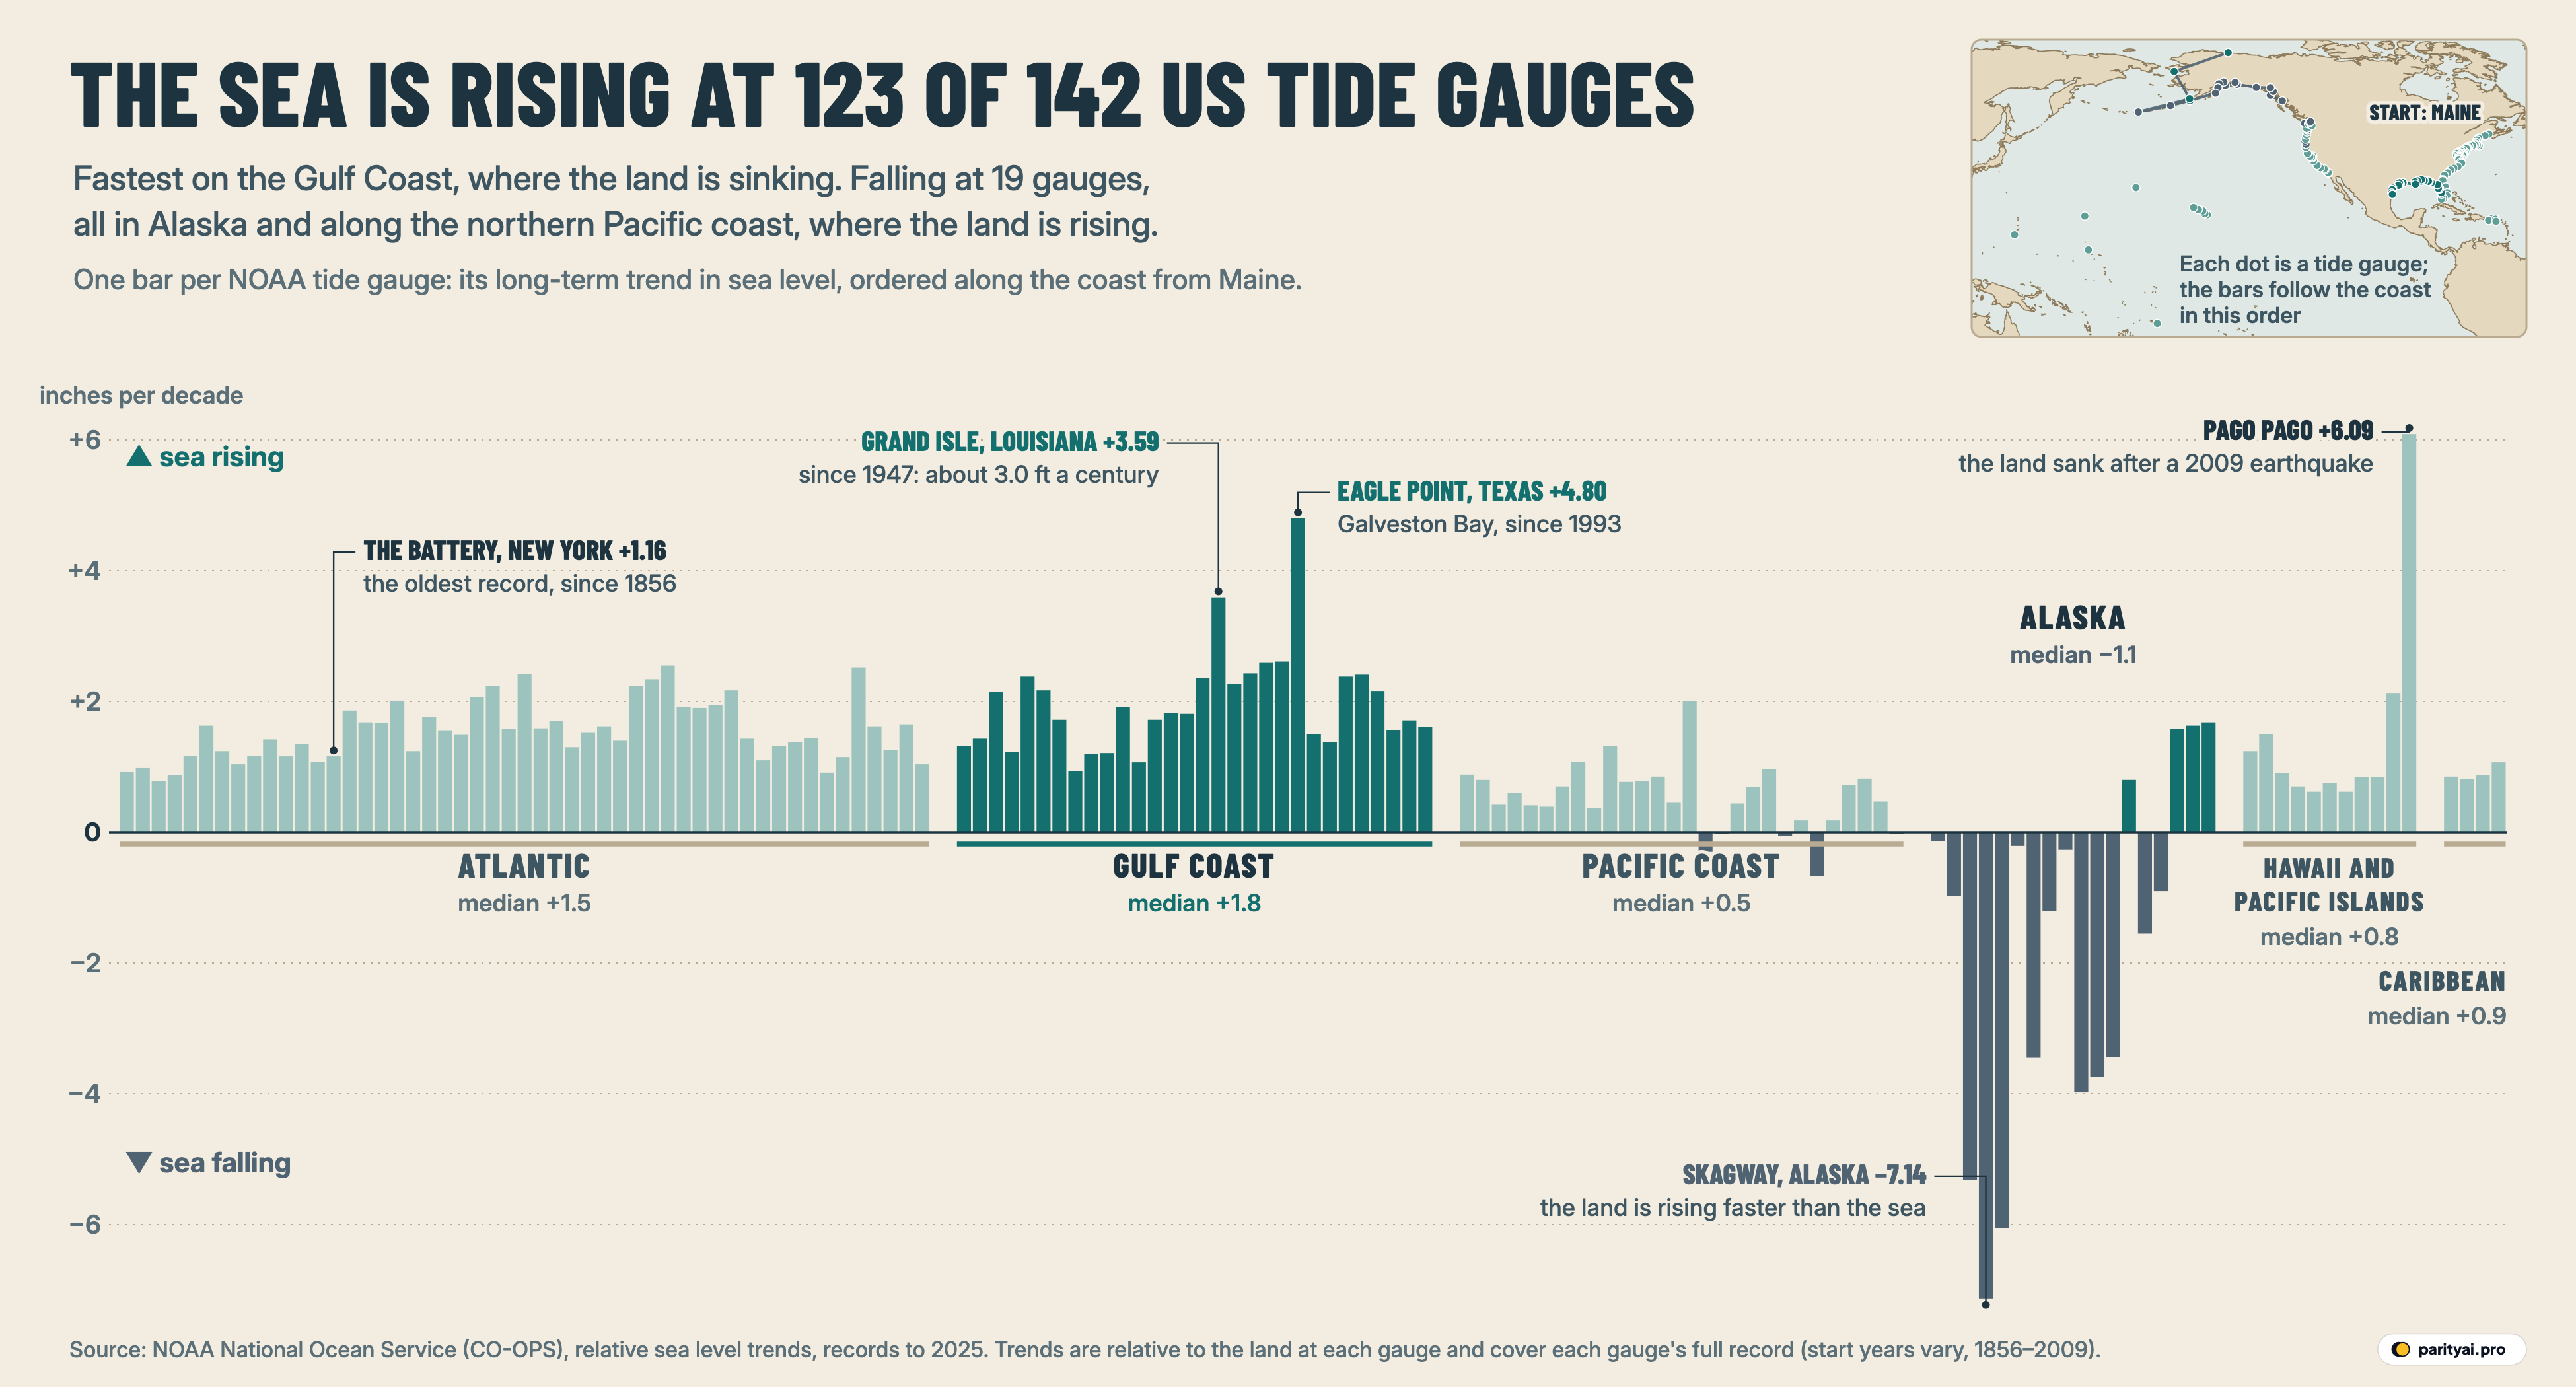
Both are honest measurements. Both come from the same federal network, NOAA's relative sea level trends, which publishes one long-term trend for each of 144 US-affiliated tide gauges. We left out the two Bermuda stations, which are not on US soil, and kept 142. At 123 of them the sea is rising. At 19 it is falling, and every one of those 19 sits in Alaska or along the northern Pacific coast.
The graphic above is the whole coast unrolled into a single strip. Start at Eastport, Maine, on the far left, travel south past New York and the Chesapeake to the Florida Keys, turn west along the Gulf to the Mexican border, jump to San Diego and run north to the Canadian line, then on through Alaska, out across Hawaii and the Pacific islands, and finish in Puerto Rico and the Virgin Islands. Each bar is one gauge. A bar above the line means the sea is rising against the land there; below the line, falling. The height is the trend in inches per decade (multiply by 2.54 for millimetres per year). The small map shows the route. Gulf Coast bars and Alaska's bars are drawn darker because they carry the story; the rest are pale but drawn to the same scale.
What follows is a stack of postcards, one from each of six gauge towns, each telling part of the story through its own record. The postmark on each card is its record: when the gauge started, and the trend it has written since.
The Battery, New York: the card everyone else is compared with
Postmarked 1856–2025. Trend +1.16 inches per decade (+3.0 mm a year).
The tide gauge at the southern tip of Manhattan holds the longest record in the set, starting in 1856. Only 4 gauges began before 1900: The Battery (1856), Fernandina Beach (1897), San Francisco (1897), Seattle (1899). Across its 170 years, the Battery's trend works out to about 19.7 inches of rise, or roughly a foot per century.
That makes it a useful middle. The median trend across all 142 gauges is +1.23 inches per decade (+3.1 mm a year), almost exactly the Battery's figure. Boston (+1.17) and Baltimore (+1.30) are close to it too. New England's gauges have a median of +1.16; the Chesapeake Bay and the Virginia and Maryland shore, at +1.90, run faster.
The number on this card needs one word of warning, and it applies to every card in the stack. NOAA's trend is relative: it is, in the agency's words, "the height of the ocean relative to a specific point on land," and it "accounts for both changes in the ocean's surface and vertical land movements" (NOAA). A gauge is bolted to a pier. If the pier's ground sinks, the gauge sees the sea rise faster. If the ground rises, the gauge sees the sea rise more slowly, or fall. NOAA's Ocean Service puts it plainly: "Global sea level trends and relative sea level trends are different measurements" (NOAA Ocean Service).
For the person who owns a house near the water, relative sea level is the number that matters. The ocean does not care whether it is rising or the yard is sinking. But it is why the strip looks so uneven, and why the rest of these postcards are mostly about the ground.
| Coast segment | Gauges | Median trend | mm per year | Falling | Fastest rise | Slowest (or falling) |
|---|---|---|---|---|---|---|
| Atlantic | 51 | +3.8 | 0 | Windmill Point +2.55 | Portland +0.78 | |
| Gulf Coast | 30 | +4.6 | 0 | Eagle Point +4.80 | Cedar Key +0.94 | |
| Pacific Coast | 28 | +1.4 | 5 | North Spit +2.00 | Neah Bay −0.67 | |
| Alaska | 18 | −2.8 | 14 | Prudhoe Bay +1.68 | Skagway −7.14 | |
| Hawaii and Pacific islands | 11 | +2.1 | 0 | Pago Pago +6.09 | Honolulu +0.62 | |
| Caribbean | 4 | +2.2 | 0 | Lime Tree Bay +1.07 | Magueyes Island +0.81 |
Median of NOAA's long-term relative sea level trends at the gauges in each segment, in inches per decade (and millimetres per year). Falling = gauges with a negative trend. Records end in 2025 at nearly every gauge but start in different years.
Grand Isle, Louisiana: the island that keeps getting lower
Postmarked 1947–2025. Trend +3.59 inches per decade (+9.1 mm a year), rank 3 of 142.
Grand Isle's bar is the tall dark one near the middle of the Gulf segment. Its trend is about three times the Battery's, 3.1 to be exact, and works out to roughly three feet per century.
The US Geological Survey has studied this gauge closely. It notes that it "has a nearly-continuous record since 1947" and that "the average rate of RSLR at Grand Isle is about 9.3 millimeters per year," close to the +9.1 mm in NOAA's current trend (USGS). The rate has not been steady. The USGS finds that it "accelerated from about 3.3 mm/yr between 1947 and 1965 to about 10.7 mm/yr between 1965 and 1993." The same page sets that against the region's oil and gas history: "Annual production from onshore Louisiana oil-and-gas fields accelerated rapidly during the 1950s and 1960s." It also reports "an observed decrease in subsidence rates since 1993," which its researchers had expected once production fell. Natural processes in the delta matter too, and the USGS lists several. The point for the strip is simple: much of what Grand Isle records is the island going down, not only the Gulf coming up.
The rest of the Gulf segment looks the same, only less extreme. Its median gauge rises at +1.81 inches per decade (+4.6 mm a year), the highest median of any segment, against +1.49 for the Atlantic and +0.53 for the Pacific coast. 13 of the 30 Gulf gauges rise at 2 inches per decade or more, and none is falling. Within the Gulf there is a clear west-east step. The 12 gauges on Florida's Gulf side have a median of +1.38, with Cedar Key the slowest at +0.94. Texas, at +2.27, and Louisiana sit well above.
Eagle Point, Texas: a fast record with a short postmark
Postmarked 1993–2025. Trend +4.80 inches per decade (+12.2 mm a year), rank 2 of 142.
The tallest bar on the US mainland belongs to a gauge on the western shore of Galveston Bay. Eagle Point's trend, +4.80 inches per decade, is 4.1 times the Battery's. Only one gauge in the whole set beats it, and that one is on a Pacific island (see the last postcard).
The card comes with a short postmark, though. Eagle Point's record starts in 1993, and NOAA warns that "sea level trends that are based on shorter records (30 years or less) are not as precise" (NOAA). Morgans Point, about 23 km up the bay with a record from the same year, shows +1.50. That gap between near neighbours is a reminder that each bar describes one spot of ground.
Galveston's own long record is steadier and still striking. Galveston Pier 21 has measured the sea since 1904, and its trend of +2.61 inches per decade adds up to about 31.8 inches over 122 years, 2.3 times the Battery's pace and 3 times San Diego's. The upper Texas coast has a well-documented reason for sinking ground. The Texas Legislature created the Harris-Galveston Subsidence District in 1975 because heavy pumping from the Gulf Coast Aquifer "led to declines in water levels," and the district says "historical subsidence rates near the coast were recorded as the highest in the region."
Put the Gulf cards together and the pattern is hard to miss. Of the ten fastest-rising gauges in the country, 6 are on the Gulf Coast: Eagle Point, Grand Isle, Galveston Pier 21, Galveston Bay Entrance, Sabine Pass, Packery Channel. The other four are Pago Pago, American Samoa, Windmill Point, Virginia, Port Canaveral, Florida, Chesapeake Channel, Virginia.
| # | Tide gauge | Inches per decade | mm per year | ± NOAA | Record |
|---|---|---|---|---|---|
| 1 | Pago Pago, American Samoa | 6.09 | +15.5 | 1.06 | 2009–2025 |
| 2 | Eagle Point, Texas | 4.8 | +12.2 | 0.27 | 1993–2025 |
| 3 | Grand Isle, Louisiana | 3.59 | +9.1 | 0.07 | 1947–2025 |
| 4 | Galveston Pier 21, Texas | 2.61 | +6.6 | 0.04 | 1904–2025 |
| 5 | Galveston Bay Entrance, Texas | 2.59 | +6.6 | 0.10 | 1957–2025 |
| 6 | Windmill Point, Virginia | 2.55 | +6.5 | 0.20 | 1982–2025 |
| 7 | Port Canaveral, Florida | 2.52 | +6.4 | 0.26 | 1994–2025 |
| 8 | Sabine Pass, Texas | 2.43 | +6.2 | 0.15 | 1958–2020 |
| 9 | Chesapeake Channel, Virginia | 2.42 | +6.2 | 0.11 | 1975–2025 |
| 10 | Packery Channel, Texas | 2.41 | +6.1 | 0.21 | 1988–2025 |
| 133 | Sitka, Alaska | ▼ 0.97 | −2.5 | 0.05 | 1924–2025 |
| 134 | Seward, Alaska | ▼ 1.21 | −3.1 | 0.11 | 1964–2025 |
| 135 | Unalaska, Alaska | ▼ 1.55 | −3.9 | 0.10 | 1958–2025 |
| 136 | Kodiak Island, Alaska | ▼ 3.44 | −8.7 | 0.16 | 1984–2025 |
| 137 | Valdez, Alaska | ▼ 3.45 | −8.8 | 0.19 | 1988–2025 |
| 138 | Seldovia, Alaska | ▼ 3.74 | −9.5 | 0.12 | 1964–2025 |
| 139 | Nikiski, Alaska | ▼ 3.98 | −10.1 | 0.16 | 1973–2025 |
| 140 | Juneau, Alaska | ▼ 5.32 | −13.5 | 0.06 | 1936–2025 |
| 141 | Yakutat, Alaska | ▼ 6.06 | −15.4 | 0.19 | 1988–2025 |
| 142 | Skagway, Alaska | ▼ 7.14 | −18.1 | 0.09 | 1944–2025 |
Ranks are out of all 142 gauges. Up arrows mean the sea is rising relative to the land at the gauge. Gulf Coast gauges are highlighted. Short records (Pago Pago since 2009, Eagle Point since 1993) carry wider uncertainty.
Skagway, Alaska: where the sea seems to drain away
Postmarked 1944–2025. Trend −7.14 inches per decade (−18.1 mm a year), rank 142 of 142.
Now turn the strip upside down. The long slate bars hanging below the line are Alaska, and the deepest is Skagway's. Yakutat (−6.06) and Juneau (−5.32) are next. Juneau is about 140 km down the same channel from Skagway.
This is the same measurement as Grand Isle with the land doing the opposite thing. Southeast Alaska is rising. Juneau "is rising by about a half an inch a year," according to a 2018 report by KTOO, and glaciologist Roman Motyka explains the cause: "As glaciers retreat, the absence of pressure from the ice causes the land to spring up." NOAA lists the same process, land "still rebounding from the compressive weight of Ice Age glaciers," among the local factors that make relative sea level differ from the global average (NOAA Ocean Service). Where the land rises faster than the ocean, the gauge records a falling sea.
Of Alaska's 18 gauges, 14 are falling: Ketchikan, Sitka, Juneau, Skagway, Yakutat, Cordova, Valdez, Seward, Anchorage, Nikiski, Seldovia, Kodiak Island, Unalaska, Adak Island. All 14 fall by more than NOAA's stated uncertainty. The four that rise are Sand Point, Port Moller, Nome, Prudhoe Bay: one in the Shumagin Islands off the Alaska Peninsula, one on the peninsula's Bering Sea side, and two far to the north, on Norton Sound and the Arctic coast. Nome (+1.63) and Prudhoe Bay (+1.68) show rises close to the Atlantic median, but both records start around 1990, so their postmarks are short too.
Alaska's segment median is −1.09 inches per decade. It is the only segment on the strip where the typical gauge is falling.
Crescent City, California: two towns, two directions
Postmarked 1933–2025. Trend −0.30 inches per decade (−0.8 mm a year).
The Pacific coast segment is the quiet stretch of the strip. Its median of +0.53 inches per decade is about a third of the Gulf's. California's gauges have a median of +0.73, and Oregon's and Washington's together +0.31. Five of the falling gauges are here: Crescent City, California, Port Orford, Oregon, Astoria, Oregon, Neah Bay, Washington, Cherry Point, Washington.
Crescent City sits just south of the Oregon border, and its card has a twist. North Spit, on Humboldt Bay about 110 km to the south, shows +2.00 inches per decade, the fastest gauge on the whole Pacific coast. Crescent City shows −0.30. A 2023 study of the two records by Patton and colleagues found that "CC is uplifting at ~2.83 mm/year and NS is subsiding at ~3.21mm/year," and satellite positioning (GNSS) showed "similar rates of ~2.60 mm/year of uplift at Crescent City." The same ocean, two pieces of ground moving in opposite directions.
Further north the pattern continues. A study of GPS land motion in the Pacific Northwest reports that "uplift rates of 4.5 mm/yr persist along the western Olympic Peninsula of northwestern Washington State" (NASA Airborne Science summary). Neah Bay, at the tip of that peninsula, is one of the falling gauges, at −0.67. Seattle, inside Puget Sound, rises at +0.82.
Pago Pago, American Samoa: the newest postmark and the tallest bar
Postmarked 2009–2025. Trend +6.09 inches per decade (+15.5 mm a year), ± 1.06.
The tallest bar on the strip is not on the Gulf at all. It sits near the far right, among the Pacific islands, and it has the shortest record of any gauge: NOAA's trend for Pago Pago starts in 2009.
That date is the story. "On September 29, 2009, an 8.1 magnitude double earthquake shook the small group of Samoan Islands," a NOAA analysis begins. Since then, "American Samoa has shifted downward (or subsided) by approximately 8 in (20 cm)." Of the roughly 9 inches of relative sea level rise from 2009 to 2020, NOAA found that only about 1 inch "was due to a rise in the ocean surface." NASA researchers later measured the island of Tutuila sinking "an average of 0.24 to 0.35 inches (6 to 9 millimeters) per year between 2015 and 2022," compared with 1 to 2 millimetres a year before the earthquake (NASA).
Pago Pago's uncertainty, ± 1.06 inches per decade, is the widest in the set. NOAA says it computes trends "with the intent of having uncertainty below 1.5 millimeters per year"; Pago Pago is the only one of the 142 gauges above that line. Read the bar as real but young. The rest of the island segment is calmer: Hawaii's six gauges have a median of +0.82, and Guam's record since 1993 shows +2.12.
Reading the postmarks
Every card in this stack has a different postmark, and that is the main caveat. The gauges' start years run from 1856 to 2009, with a median of 1958. 24 have a century or more of data; 7 began in 1990 or later. A trend over 170 years and a trend over 17 years are both on the same strip, and they are not equally firm. The ± values in the tables are NOAA's own uncertainty for each trend, and three gauges (Port Orford, Astoria, Cherry Point) are within that range of no change at all.
A few other things to keep in mind:
- Splices. 20 of the records join two nearby gauges into one series, with an adjustment NOAA records in the data. The CSV includes those notes.
- End dates. Nearly every record runs to 2025. Five stop earlier: Bergen Point (2024), Naples (2023), Sabine Pass (2020), Corpus Christi (2022), Sand Point (2024).
- Straight lines. Each trend is one straight line through the whole record. It does not show whether the rise has sped up recently, and in places it has: NASA puts the global rate over the satellite era at "0.13 inches (3.4 millimeters) per year," up "from about 0.1 inches (2.5 millimeters)" (NASA). The satellite figure covers a different period and measures the ocean surface rather than the sea against the land, so it is not directly comparable with the gauge trends.
- Order along the coast. The strip follows a route we drew through the gauges. Inside bays such as the Chesapeake and San Francisco Bay, the order is approximate.
| Tide gauge | Since | Years | Inches per decade | Rise over the record |
|---|---|---|---|---|
| The Battery, New York City | 1856 | 1.16 | 19.7 in | |
| Fernandina Beach, Florida | 1897 | 0.91 | 11.7 in | |
| San Francisco, California | 1897 | 0.78 | 10.1 in | |
| Seattle, Washington | 1899 | 0.82 | 10.4 in | |
| Philadelphia, Pennsylvania | 1900 | 1.24 | 15.6 in | |
| Charleston, South Carolina | 1901 | 1.38 | 17.3 in | |
| Baltimore, Maryland | 1902 | 1.3 | 16.1 in | |
| Galveston Pier 21, Texas | 1904 | 2.61 | 31.8 in | |
| Honolulu, Hawaii | 1905 | 0.62 | 7.5 in | |
| San Diego, California | 1906 | 0.88 | 10.6 in | |
| Atlantic City, New Jersey | 1911 | 1.67 | 19.2 in | |
| Portland, Maine | 1912 | 0.78 | 8.9 in |
Rise over the record is the linear trend multiplied by the length of the record, not the measured difference between the first and last years. Some long records splice two nearby gauges (NOAA notes each splice).
The address on the front
Turn the stack over and look at the strip as one picture. Almost the whole coast is above the line, which is the ocean rising. The height of each bar, which is most of what makes one town's card different from another's, is largely the ground: sinking under Louisiana and Galveston, rising under Skagway and Crescent City, dropping after an earthquake under Pago Pago.
The two pull in different directions only for now. NOAA's interagency 2022 sea level rise technical report projects that "sea level along the U.S. Coastline is predicted to rise 10 - 12 inches" over the next 30 years, with flooding "more than 10 times as often as it does today." On the Gulf, that rise lands on ground that is already going down. In Alaska, rising land has so far outpaced the sea at 14 gauges. The next time NOAA updates its trends, the question for each town will be the same one these postcards have answered for decades: which is moving faster, the water or the ground.
Sources and method
- NOAA National Ocean Service, Center for Operational Oceanographic Products and Services (CO-OPS): relative sea level trends (sealvltrends API). Long-term linear trends for 144 US-affiliated water level stations, with monthly data to December 2025 at most stations; retrieved November 10, 2026. Public domain; courtesy of NOAA's National Ocean Service, which requests attribution.
- NOAA CO-OPS station metadata API (states for each station)
- Natural Earth land shapes via world-atlas
Each bar is NOAA's published linear trend fitted to monthly mean sea level at one tide gauge, over that gauge's whole record (the start year varies from 1856 to 2009). NOAA publishes trends in inches per decade; millimetres per year are that figure times 2.54. The trends are relative: they combine the change in the ocean with any sinking or rising of the land under the gauge, and they are not adjusted for either. The two Bermuda stations in NOAA's list are left out, because Bermuda is not a US territory and the two records are spliced from each other. Stations are ordered along the coast by projecting each onto a hand-drawn route through the coast's tide gauges; the order inside bays such as Chesapeake Bay and San Francisco Bay is approximate. A gauge counts as rising or falling by the sign of its trend; the ± uncertainty NOAA publishes with each trend is shown in the tables, and three trends near zero are within that uncertainty of no change.
Charts like this, from your own numbers.
Connect a spreadsheet or the tools you run on, and Parity builds the dashboard and writes the report, with every number checked.
Try Parity free

