Charts like this, from your own numbers.
Connect a spreadsheet or the tools you run on, and Parity builds the dashboard and writes the report, with every number checked.
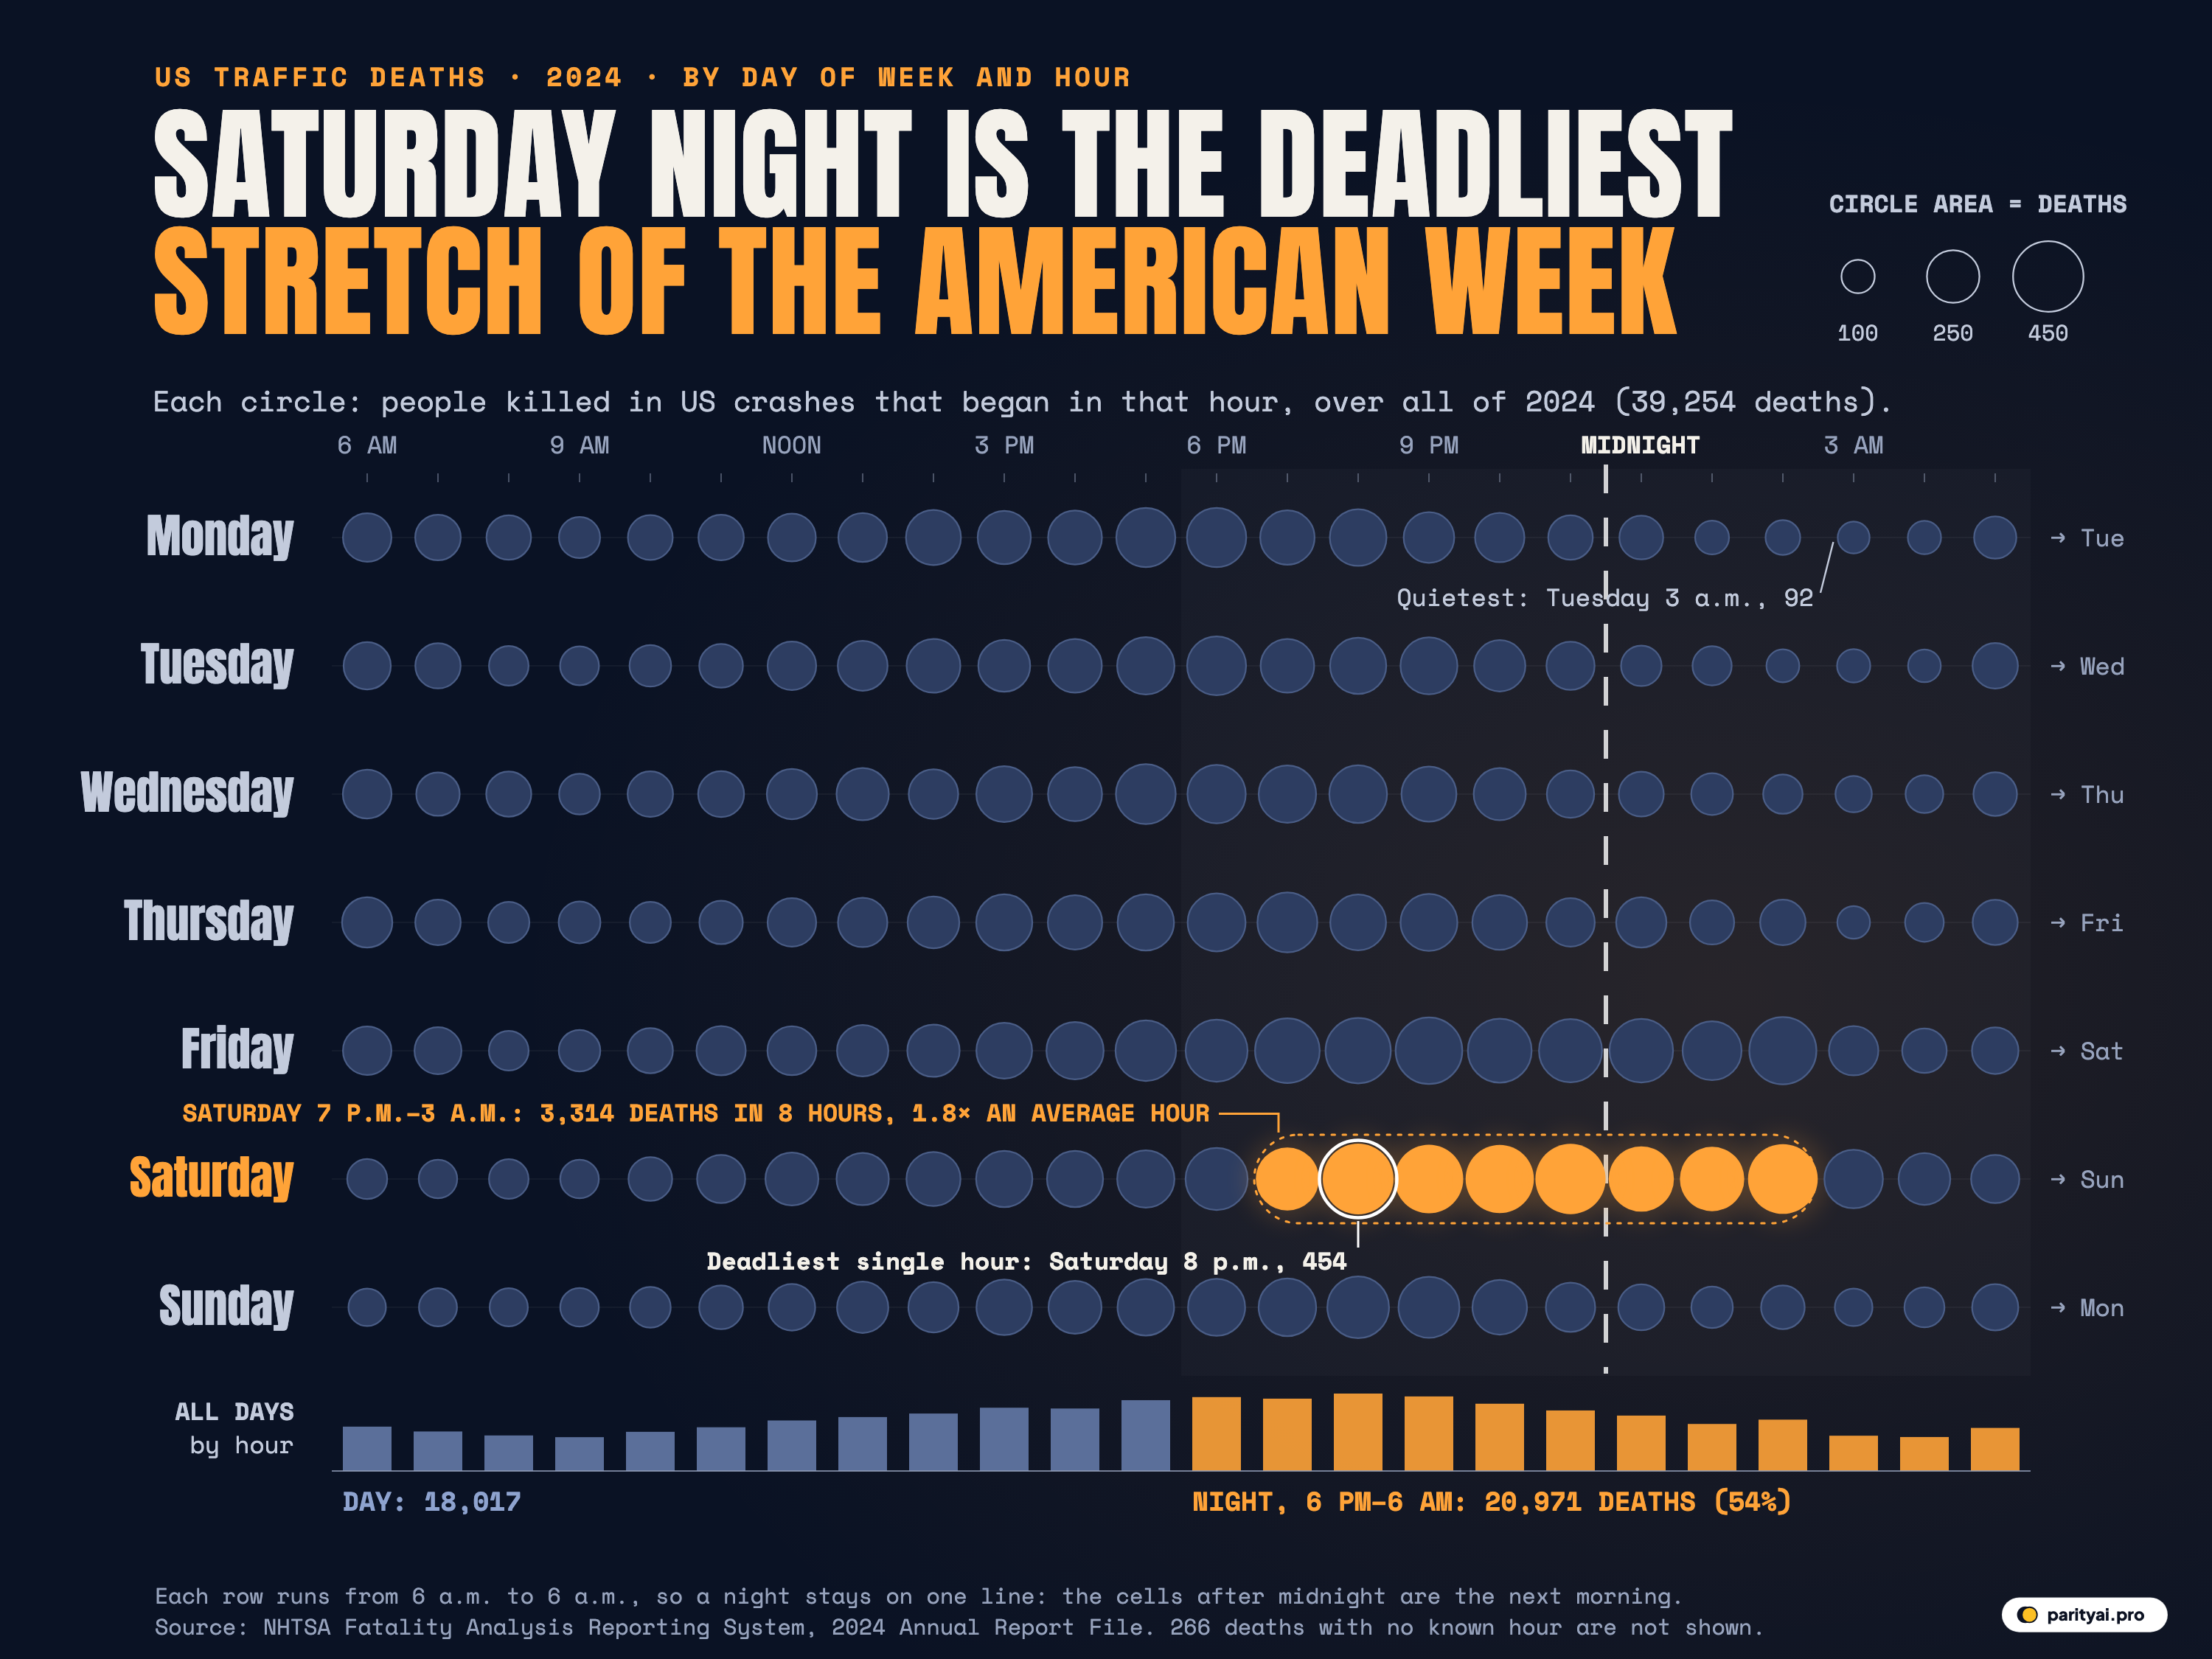
Try Parity freeAcross the whole of 2024, 92 people died in American road crashes that began on a Tuesday between 3:00 and 3:59 in the morning. In crashes that began on a Saturday between 8:00 and 8:59 in the evening, 454 died. Both counts cover every road in the country for a full year, and the second is 4.9 times the first. They are the quietest and the deadliest hours of the American week, and in this data the only thing that tells them apart is the time on the clock and the day on the calendar.
The National Highway Traffic Safety Administration counts every one of these deaths in its Fatality Analysis Reporting System, or FARS: a census of every crash on a public road in which someone died within 30 days. The 2024 file holds 36,297 fatal crashes and 39,254 deaths. That is 1,771 fewer than the 41,025 of 2023, a fall of 4.3%, according to NHTSA's 2024 overview. The 2024 file is what NHTSA calls the Annual Report File, a near-final version that gets one more round of small corrections before the final file. Its total matches the overview exactly.
The graphic sorts those deaths into the 168 hours of a week. Each row is a day, and each circle is one hour of that day, sized by the number of people killed in crashes that began in that hour across all of 2024. A bigger circle means more deaths: the area, not the width, carries the count. The rows run from 6 a.m. to 6 a.m. rather than midnight to midnight, so a night stays on one line. The white dashed lane line marks midnight, and the circles to its right belong to the next morning: the last five circles on the Saturday row are the early hours of Sunday. Eight circles are orange. They are the deadliest run of eight consecutive hours anywhere in the week, from Saturday 7 p.m. to Sunday 3 a.m., and they account for 3,314 deaths.
What follows walks once around the clock, starting at midnight, and asks what the data shows in each part of the day.
| Part of the day | Deaths | Per hour | Worst day | In the dark | Pedestrian share | Median age killed |
|---|---|---|---|---|---|---|
| Midnight to 3 a.m. | 1,553 | Sunday | 100% | 20% | 33 | |
| 3 a.m. to 6 a.m. | 1,134 | Sunday | 92% | 26% | 35 | |
| 6 a.m. to 10 a.m. | 1,161 | Monday | 17% | 15% | 46 | |
| 10 a.m. to 3 p.m. | 1,484 | Saturday | 0% | 7% | 56 | |
| 3 p.m. to 7 p.m. | 2,049 | Friday | 18% | 13% | 48 | |
| 7 p.m. to midnight | 2,134 | Saturday | 86% | 27% | 39 |
Clock blocks of three to five hours, all days of 2024 combined. Per hour = deaths ÷ number of hours in the block (each hour summed over all 366 days of 2024).
After midnight, the weekend shows itself
The three hours from midnight to 3 a.m. held 4,660 deaths in 2024, 12% of all deaths with a known time. That is not the largest block of the day. Spread across every night of the year, it is roughly the size of the morning commute. But this block is where the days of the week pull furthest apart.
On the early hours of a Sunday, the three hours from midnight took 386, 376 and 441 lives. The 2 a.m. hour, at 441, is one of the five deadliest hours of the entire week. On the early hours of a Tuesday, the same three-hour block was quiet: 109 people died in crashes that began at 2 a.m., a quarter of the Sunday figure. The ratio between the two 2 a.m. hours is 4.0 to 1. Wednesday 2 a.m. was lower still, at 98.
Put the block's days side by side and the pattern is lopsided. The worst day for the midnight-to-3 block was Sunday, with 1,203 deaths, and the quietest was Wednesday, with 386. Saturday and Sunday mornings together account for 2,292 of the block's 4,660 deaths, nearly half, from two of the seven nights.
The people who die in these hours are younger than at any other time of day. The median age of those killed in crashes from midnight to 3 a.m. was 33, against 42 for the year as a whole, and 52% were between 16 and 34. Nearly all of these crashes happen in the dark (100% of deaths by the police-reported light condition, rounded), and 20% of the people killed were pedestrians.
NHTSA itself reports one difference between night and day driving. In its 2023 alcohol-impaired driving fact sheet, it found that "the rate of alcohol impairment among drivers involved in fatal traffic crashes was three times higher at night than during the day (30% versus 10%)", and that 28 percent of drivers in weekend fatal crashes were alcohol-impaired, compared with 15 percent during the week. That is NHTSA's finding about drivers, from its own analysis; the chart here counts deaths by hour and does not separate them by cause.
Before dawn, a sudden quiet
Then the count drops. Deaths in crashes that began in the 3 a.m. hour, all days combined, came to 1,069, down 31% from 1,556 in the 2 a.m. hour. The 4 a.m. hour was lower again, at 1,029. Across the week, the quietest eight-hour stretch begins at Tuesday 1 a.m. and runs to Tuesday 9 a.m., with 1,097 deaths. The busiest eight hours, Saturday evening into Sunday, saw 3.0 times as many.
The block from 3 a.m. to 6 a.m. held 3,403 deaths, 9% of the total. It is still a night block: 92% of its deaths came in the dark. It also has one of the highest pedestrian shares of the day. Pedestrians made up 26% of those killed between 3 and 6 a.m., against 18% for the year. In raw numbers that is 888 people on foot, a figure that rises hour by hour toward dawn: 235 at 3 a.m., 269 at 4 a.m. and 384 at 5 a.m.
The weekend lingers here too. Sunday was the worst day for this block, with 764 deaths; Tuesday was the quietest, with 354.
The morning commute is calmer than its reputation
The roads fill up after 6 a.m., but deaths do not follow. The block from 6 to 10 a.m. held 4,643 deaths, 12% of the total, about the same as the three hours after midnight even though it is an hour longer. The 6 a.m. hour is the deadliest of the four, at 1,344, and it is still often dark: 47% of its deaths came in crashes in the dark. By 7 a.m. that share was 9%.
Then comes the quietest hour of the entire day. Crashes that began in the 9 a.m. hour killed 1,025 people across 2024, all days combined, the lowest of any of the 24 clock hours, just under the 4 a.m. hour's 1,029. The busiest hour, 8 p.m., saw 2,346, 2.3 times as many.
This is the one block of the day where Saturday and Sunday are both quieter than every weekday. A weekday 7 a.m. hour averaged 186 deaths over the year; on Saturdays it was 134 and on Sundays 131. The worst day for the morning block was Monday, with 734, and the quietest was Sunday, with 525. The people killed are older too: a median age of 46.
The long, flat middle of the day
From 10 a.m. to 3 p.m., the count climbs slowly and steadily: 1,187 at 10 a.m., 1,325 at 11, 1,531 at noon, 1,634 at 1 p.m. and 1,741 at 2 p.m. Together the five hours held 7,418 deaths, 19% of the total.
The days of the week barely differ in this block. Saturday was the worst at 1,150 and Sunday the quietest at 985, a narrow range for a block that covers five hours. The midday rows on the graphic are the most uniform stretch of circles in the picture.
Midday has its own profile. It is the block with the oldest victims, a median age of 56, and the lowest pedestrian share, 7%. Only 23% of those killed were 16 to 34, less than half the share after midnight.
Evening rush, the same on every day
From 3 p.m. the circles grow quickly. The four hours from 3 to 7 p.m. held 8,195 deaths, 21% of the total, and the 6 p.m. hour alone came to 2,239.
What stands out is how little the day of the week matters here. The worst day for the block was Friday, with 1,260 deaths. The quietest was Tuesday, with 1,118. The average for Monday to Thursday was 1,149, and Sunday, with no commute to speak of, came to 1,119. The late afternoon is dangerous on every day, at about the same level, which means the large gap between weekdays and weekends seen on the graphic is not a daytime pattern. It opens after dark.
Light begins to fail during this block, depending on the season and the place. 22% of deaths in the 5 p.m. hour came in the dark, then 44% at 6 p.m. and 58% at 7 p.m.
| Day | Deaths by hour, 6 a.m. → 5 a.m. | Deaths, calendar day 2024 | Deadliest hour | Quietest hour | vs 2023 |
|---|---|---|---|---|---|
| Monday | 5,132 | 6 p.m. (319) | 3 a.m. (128) | ▼ 2% | |
| Tuesday | 4,845 | 6 p.m. (315) | 3 a.m. (92) | ▼ 1% | |
| Wednesday | 5,071 | 5 p.m. (324) | 4 a.m. (97) | ▼ 2% | |
| Thursday | 5,162 | 7 p.m. (325) | 3 a.m. (120) | ▼ 3% | |
| Friday | 5,989 | 9 p.m. (403) | 3 a.m. (97) | ▼ 5% | |
| Saturday | 6,722 | 8 p.m. (454) | 7 a.m. (134) | ▼ 6% | |
| Sunday | 6,067 | 2 a.m. (441) | 6 a.m. (127) | ▼ 8% |
The sparkline runs from 6 a.m. on that day to 5:59 a.m. the next, like the chart's rows. Totals, peak and quietest hours are for the calendar day (midnight to midnight).
Late night, where the worst hours live
The five hours from 7 p.m. to midnight are the deadliest block of the day: 10,669 deaths, 27% of the total, at an average of 2,134 per clock hour. The single deadliest hour of the day, all days combined, is 8 p.m., with 2,346; 9 p.m. follows at 2,259.
This block is also where pedestrians die in the largest numbers. The block took 2,871 pedestrians, 27% of everyone killed in it. The 8 p.m. hour alone killed 698 people on foot, more than any other hour, and the six hours from 6 p.m. to midnight together accounted for 3,351 pedestrian deaths, 48% of those with a known time. NHTSA's 2023 pedestrian fact sheet reports the same shape: "the highest total percentage (26%) occurred from 6 to 8:59 p.m.", and 77 percent of pedestrian deaths that year happened in the dark.
Now the week splits open. The worst day for the late block was Saturday, with 2,111 deaths. Monday, the quietest, had 1,192. Friday evening is already heavy, at 386 in the 8 p.m. hour and 403 at 9 p.m. Saturday evening is the heaviest of all. Here is the orange run on the graphic: 361 deaths at 7 p.m., 454 at 8 p.m., 427 at 9, 422 at 10 and 447 at 11, then past the lane line into Sunday with 386, 376 and 441.
Those eight hours, from Saturday 7 p.m. to Sunday 3 a.m., held 3,314 deaths, 8.5% of the year's total in 4.8% of the week's hours. An average hour of the week carried 232 deaths over the year; this stretch averaged 414, 1.8 times as many. Of the ten deadliest single hours of the week, 6 fall on the Saturday row, from 6 a.m. Saturday to 6 a.m. Sunday. The deadliest is Saturday 8 p.m. (454), then Saturday 11 p.m. (447) and Sunday 2 a.m. (441).
Sunday evening is different. Its 8 p.m. hour saw 345 deaths and its 11 p.m. hour 220, and the circles after midnight on the Sunday row, the early hours of Monday, are back among the small ones: 192 at midnight and 172 at 2 a.m.
How firmly the clock holds
A pattern in one year of data could be chance. This one is not. In 2023, with 41,025 deaths, the deadliest eight-hour stretch also started at Saturday 7 p.m., and held 3,520 deaths. 9 of 2024's ten deadliest hours were also in 2023's top ten. Across all 168 hours, the 2023 and 2024 counts have a correlation of 0.96, so a week's shape in one year almost exactly predicts the next.
The broad splits are just as clear. Of the 20 deadliest hours of the week, 19 are at night and 19 fall inside NHTSA's weekend, which runs from Friday 6 p.m. to Monday 6 a.m. Using NHTSA's definition of night, 6 p.m. to 5:59 a.m., our counts reproduce the agency's published figures exactly: 20,971 deaths at night and 18,017 by day in 2024. The night has the same number of hours as the day but 54% of the deaths, an average of 250 per hour of the week against 214.
The weekend split is similar. Each weekend hour carried 267 deaths over the year, against 213 for a weekday hour, 1.26 times as many. (Our weekend total from cells with a known hour is 16,021; NHTSA's overview gives 16,128, because it also places some crashes with no recorded hour.)
One more number says something about what the night pattern is not. Fatal crashes at night killed 1.079 people each on average, and those by day 1.085. Night crashes are no more deadly one by one. There are simply more of them.
| Hour starting | Deaths (all days) | Saturday | Tuesday | Pedestrians killed | In the dark | vs 2023 |
|---|---|---|---|---|---|---|
| midnight | 366 | 174 | 100% | ▲ 3% | ||
| 1 a.m. | 315 | 104 | 99% | ▼ 6% | ||
| 2 a.m. | 408 | 109 | 100% | ▼ 3% | ||
| 3 a.m. | 221 | 92 | 100% | ▼ 16% | ||
| 4 a.m. | 180 | 100 | 98% | ▼ 8% | ||
| 5 a.m. | 196 | 162 | 82% | ▼ 4% | ||
| 6 a.m. | 145 | 202 | 47% | ▼ 8% | ||
| 7 a.m. | 134 | 186 | 9% | ▼ 3% | ||
| 8 a.m. | 142 | 142 | 2% | ▲ 4% | ||
| 9 a.m. | 135 | 137 | 0% | ▼ 3% | ||
| 10 a.m. | 173 | 157 | 0% | ▼ 3% | ||
| 11 a.m. | 210 | 173 | 0% | ▲ 5% | ||
| noon | 254 | 214 | 0% | ▲ 1% | ||
| 1 p.m. | 248 | 225 | 0% | ▲ 4% | ||
| 2 p.m. | 265 | 262 | 0% | ▼ 8% | ||
| 3 p.m. | 287 | 244 | 0% | ▼ 3% | ||
| 4 p.m. | 285 | 261 | 2% | ▼ 7% | ||
| 5 p.m. | 297 | 298 | 22% | ▼ 6% | ||
| 6 p.m. | 350 | 315 | 44% | ▼ 6% | ||
| 7 p.m. | 361 | 260 | 58% | ▼ 7% | ||
| 8 p.m. | 454 | 286 | 82% | ▼ 7% | ||
| 9 p.m. | 427 | 294 | 96% | ▼ 8% | ||
| 10 p.m. | 422 | 238 | 99% | ▼ 5% | ||
| 11 p.m. | 447 | 210 | 100% | 0% |
People killed in crashes that began in each clock hour, US, 2024 (FARS Annual Report File). 266 deaths in crashes with no known hour are left out. "In the dark" is the police-reported light condition (dark, lit or unlit). Highlighted: the four deadliest hours.
What the clock can't say
Three limits matter for reading the graphic.
These are counts, not risks. FARS records who died and when, but not how many people were on the road in each hour. A busy hour with many drivers can have many deaths without being any more dangerous per mile, and a quiet hour can look calm because few people are driving. The 9 a.m. low and the 4 a.m. low may have very different explanations, and this data cannot tell them apart. NHTSA's national rate, 39,254 deaths over 3,294 billion vehicle miles, works out to 1.19 per 100 million miles for 2024, according to its overview, but there is no official hour-by-hour version of that denominator in FARS.
The hour is the hour the crash happened, in local time, as recorded on the police report. Someone who died days later is counted in the hour of the crash. 253 fatal crashes, with 266 deaths, have no known hour; they are in the national totals but not on the chart, which is why the cells add up to 38,988 rather than 39,254.
The 2024 file is not yet final. NHTSA's overview uses the 2023 Final File and the 2024 Annual Report File, and the final 2024 file will revise some records. The shape of the week, which barely moved between a final 2023 and a near-final 2024, is unlikely to change.
Saturday, again
The worst hours on American roads keep the same appointment every week. In 2024, with 1,771 fewer deaths than the year before, the deadliest stretch still began at 7 on a Saturday evening and ended at 3 on Sunday morning, as it did in 2023. Saturday was the deadliest calendar day, with 6,722 deaths, and Tuesday the least deadly, with 4,845. The morning commute and the middle of the day look much the same on every day, and the evening rush varies little. The difference between a quiet week and a deadly one opens up after dark, and it is widest on one night of the seven.
Sources and method
- National Highway Traffic Safety Administration (NHTSA), Fatality Analysis Reporting System (FARS), 2024 Annual Report File, national CSV. accident.csv and person.csv, downloaded November 10, 2026. The 2024 file is NHTSA's Annual Report File; a final file with small revisions follows. US government work, public information.
- NHTSA FARS 2023 Final File, national CSV. accident.csv, used to check that the 2024 pattern repeats. Public information.
- NHTSA, Overview of Motor Vehicle Traffic Crashes in 2024 (DOT HS 813 791, April 2026). National totals and NHTSA's day/night and weekend definitions.
Each crash in FARS records the day of week and the hour it happened. We add up FATALS (people killed, including those who died within 30 days) for every day-and-hour cell. 253 crashes in 2024 (266 deaths) have no known hour and are left out of the chart, so the cells sum to 38,988 of the 39,254 deaths; they stay in the national totals. Hours are clock hours (8 p.m. means 8:00 to 8:59 p.m.) in local time where the crash happened. The chart runs each row from 6 a.m. to 5:59 a.m. the next day, so a night stays on one row; 'Saturday 2 a.m.' sits on the Saturday row but happened on Sunday morning. The deadliest stretch is the eight consecutive hours with the most deaths out of all 168 hours of the week. Night and day follow NHTSA (night is 6 p.m. to 5:59 a.m.), and so does the weekend (Friday 6 p.m. to Monday 5:59 a.m.). Pedestrian deaths and ages come from person.csv (person type pedestrian, injury severity fatal). Light condition is the police-reported condition at the crash. Counts are deaths, not rates: we don't know how many people were driving in each hour, so a busy hour is not necessarily a riskier one per mile.
Charts like this, from your own numbers.
Connect a spreadsheet or the tools you run on, and Parity builds the dashboard and writes the report, with every number checked.
Try Parity free

