Charts like this, from your own numbers.
Connect a spreadsheet or the tools you run on, and Parity builds the dashboard and writes the report, with every number checked.
Try Parity freeIn Tunica County, Mississippi, in flat Delta farmland that has never been anyone's idea of wind country, stand the tallest land-based wind turbines in the United States. There are 41 of them, all from the Delta Wind Project, which came online in 2024. Each tower lifts its hub 136 metres off the ground and carries a rotor 150 metres across, so a blade pointing straight up reaches 211 metres. Mississippi has no other turbines in the national database. It went from zero to the record in one project.
That one project says a lot about how American wind power has changed. Sites that once looked too calm are now worth building on, because a taller tower reaches steadier wind and a longer blade sweeps more of it. The other half of the story is where the machines already stand, and that answer has barely moved: down the middle of the country, with Texas far ahead.
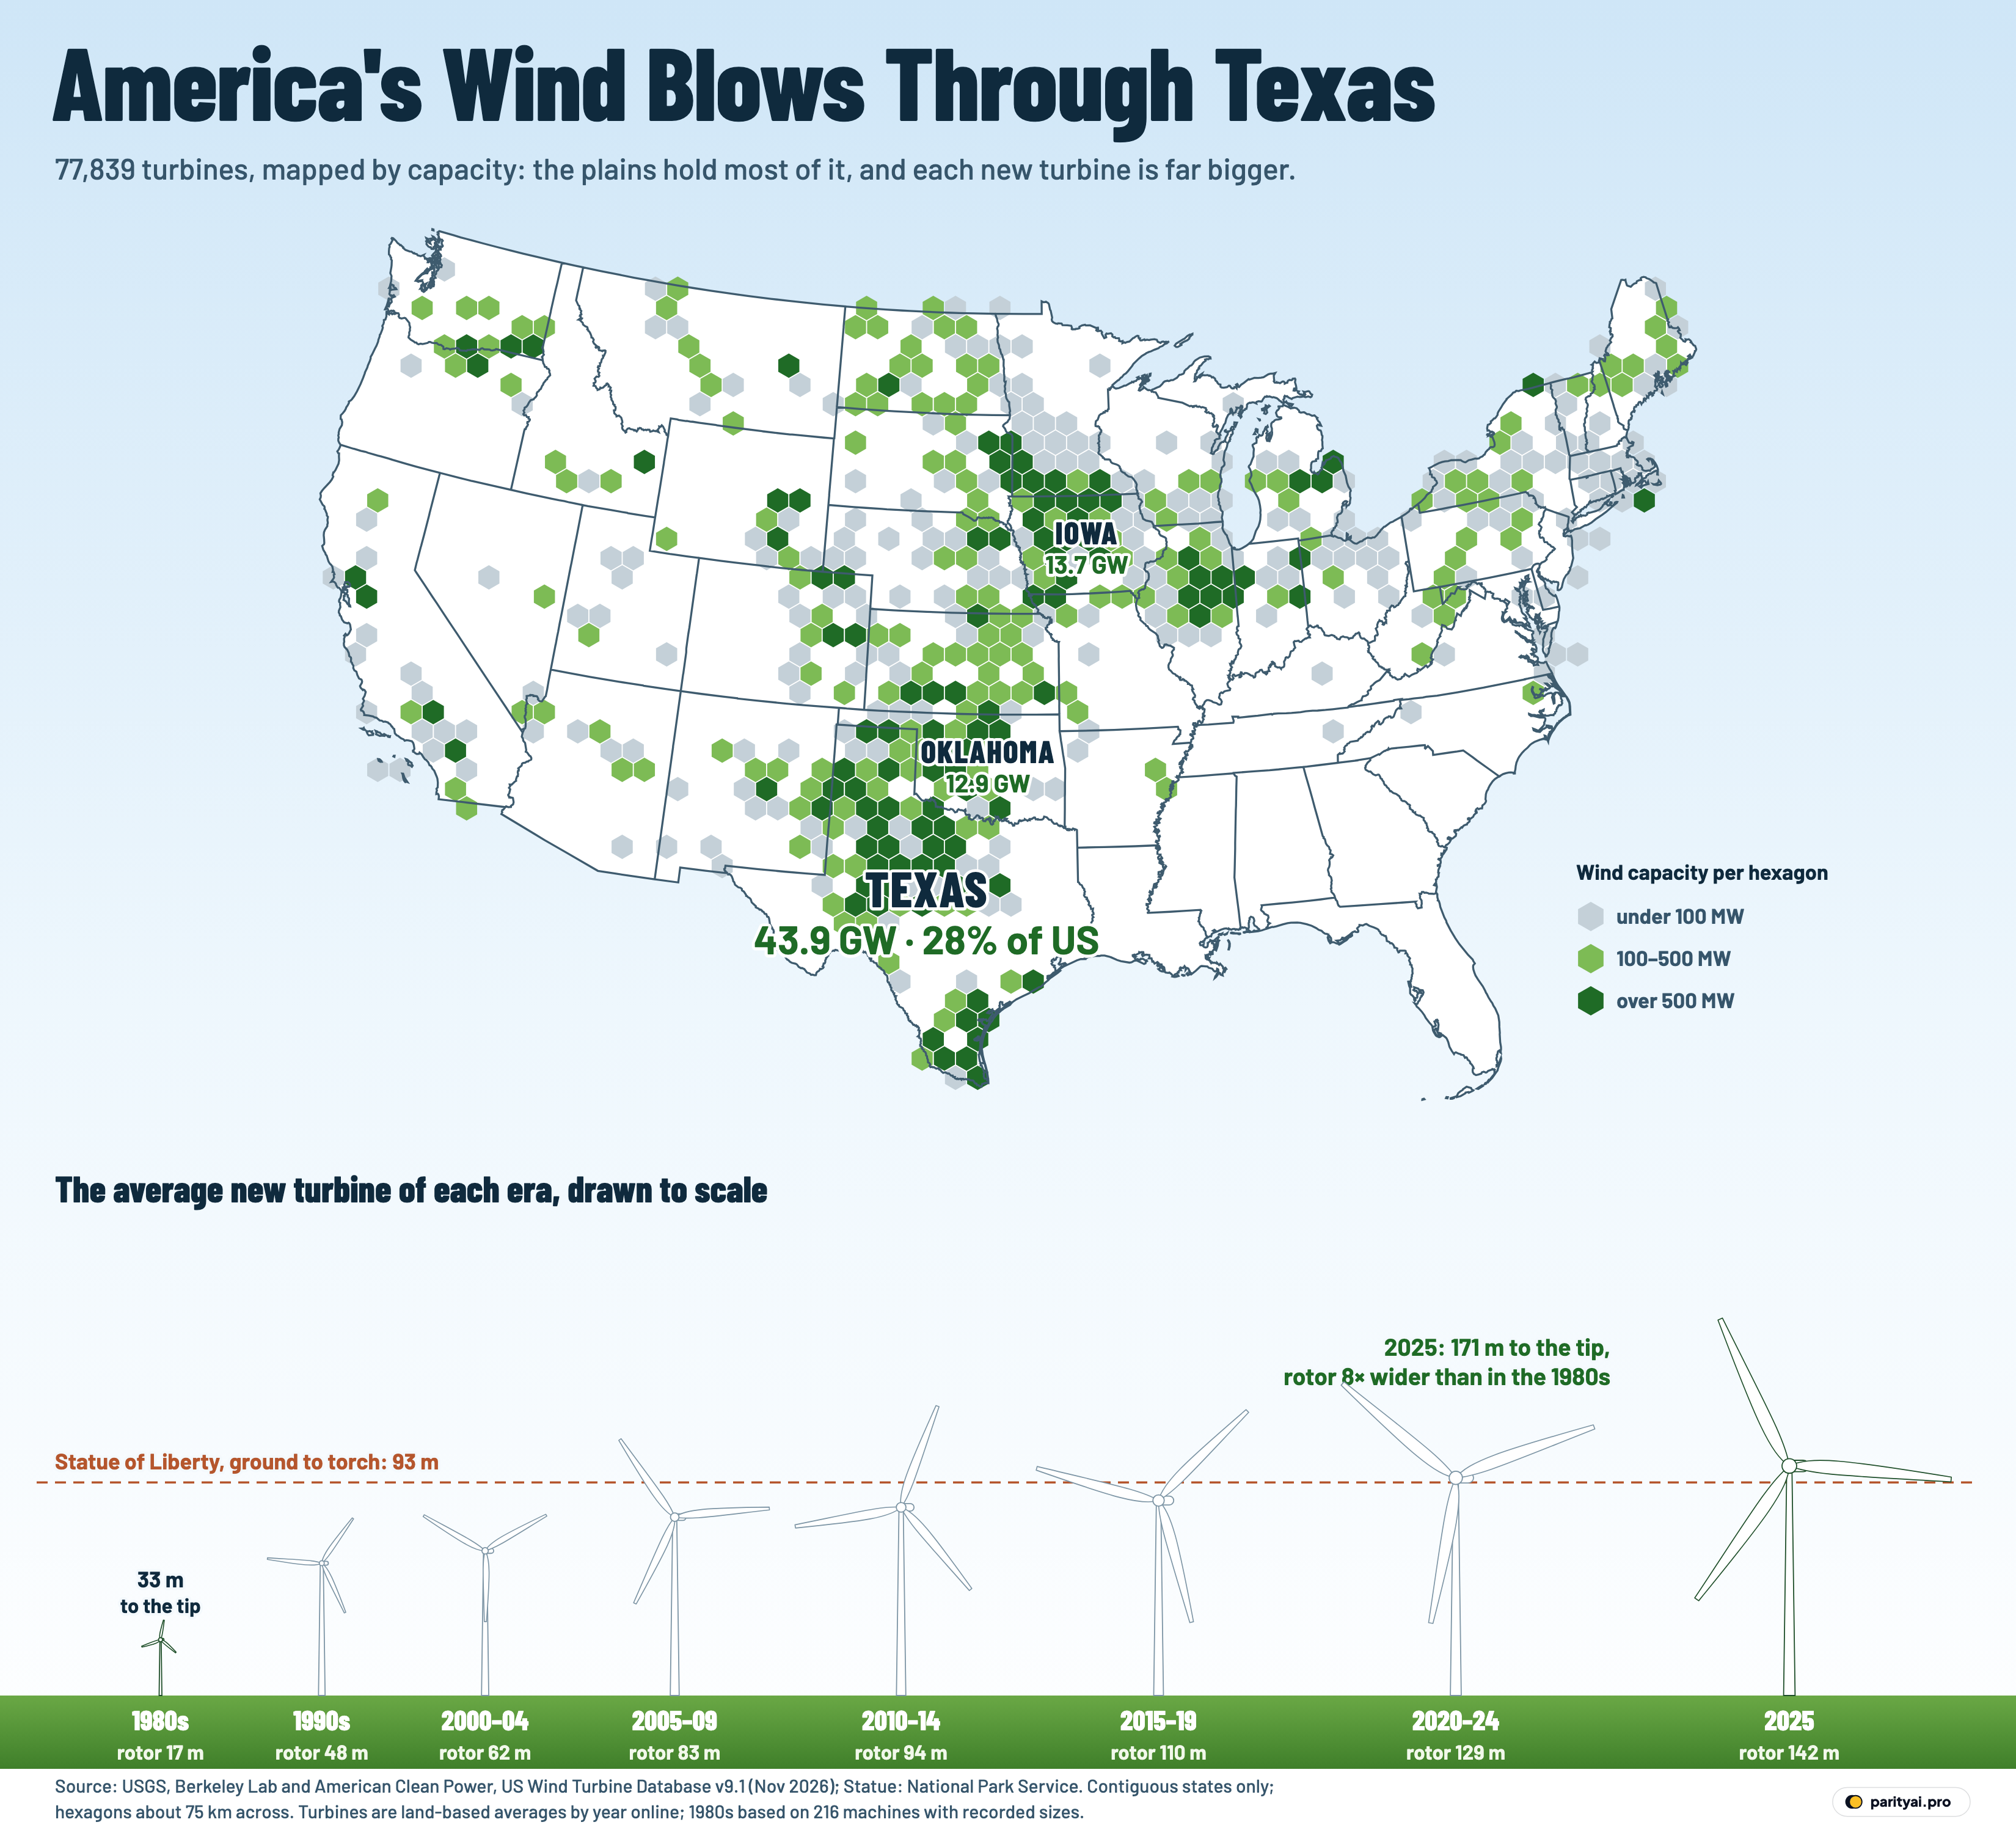
The graphic above shows both halves. The map counts every turbine in the US Wind Turbine Database, 77,839 of them, in hexagons about 75 kilometres across. A hexagon's colour comes from the total nameplate capacity of the turbines inside it: grey for under 100 megawatts, light green for 100 to 500, and dark green for more than 500. Only Texas, Iowa and Oklahoma are labelled. Along the bottom, eight white turbines stand on a strip of grass, all drawn to the same scale: the average land-based turbine that came online in each period, from the 1980s to 2025, at its real hub height and rotor diameter. The dashed line is the Statue of Liberty, which the National Park Service measures at 92.99 metres from the ground to the tip of the torch.
What follows takes the turbine apart, from the concrete up, one component per section.
Foundation: the database everything rests on
A turbine's foundation is the part nobody sees, and every other part depends on it. Here, that is the database.
The US Wind Turbine Database is built jointly by the US Geological Survey, Lawrence Berkeley National Laboratory and the trade group American Clean Power, which together keep it "continuously updated", according to its home page. The release used here, version 9.1 from September 2026, holds 77,839 turbines in 45 states plus Guam and Puerto Rico. Each record has a location checked against aerial imagery, the project name, the year the project came online, and the machine's specifications: nameplate capacity in kilowatts, hub height, rotor diameter and total height.
Four things in the foundation matter for everything above it.
First, the database is a count of what is standing, not of what was ever built. The data team removes decommissioned turbines when it spots them in imagery, though its data page warns that "some decommissioned turbines likely have not yet been identified". So the 1980s and 1990s are thin in this graphic partly because many machines from those years are gone. Only 2,660 of today's turbines date from before 2000.
Second, the year is the project's year. The API documentation defines it as the year a turbine "became operational and began providing power", which may differ from when construction began. A wind farm finished in January is counted in the year it came online, even if most of its towers went up in the previous autumn.
Third, specifications are missing for some turbines. 5,056 records have no nameplate capacity, and 1,279 of those are from the 1980s. The 1980s turbine in the lineup is therefore an average of only 216 machines that have recorded dimensions, out of 1,709 standing from that decade, all of them in California except one in Oklahoma. The 2025 turbine rests on 1,477 of 3,094, because the newest records are still being filled in.
Fourth, the map leaves out 336 turbines in Alaska (144), Hawaii (128), Puerto Rico (63) and Guam, so that the contiguous states can be drawn large enough to read. They are in every total.
Tower: four times taller
The tower is the simplest part of a turbine and the one that has grown most visibly. The average land-based turbine standing from the 1980s has a hub about 24 metres up. By the 1990s it was 58 metres, and for turbines that came online in 2025 it is 100 metres: 4.1 times the 1980s height.
| Came online | Turbines standing | Hub height | Rotor diameter | Capacity each |
|---|---|---|---|---|
| 1980s | 1,709 | |||
| 1990s | 951 | |||
| 2000–04 | 3,188 | |||
| 2005–09 | 15,392 | |||
| 2010–14 | 16,090 | |||
| 2015–19 | 19,152 | |||
| 2020–24 | 16,589 | |||
| 2025 | 3,094 |
Land-based turbines in the US Wind Turbine Database that are still standing, by the year their project came online. Averages use turbines with a recorded value; 1980s figures rest on the few hundred machines from that decade with specifications, and 2025 records are incomplete.
The climb has not been steady. Hub heights jumped between the 1980s and the late 1990s, when the machines in the database change from small California turbines to modern utility-scale designs, and then rose more slowly. Turbines from 2000 to 2004 average 63 metres; those from 2015 to 2019, 85 metres; those from 2020 to 2024, 95 metres. Since the early 2000s, average hub height has risen 59%.
These numbers match the government's own tracking closely. The Department of Energy's Land-Based Wind Market Report put the average hub height of turbines installed in 2023 at 103.4 metres, "up 5% from 2022 and 83% since 1998−1999". Berkeley Lab's 2026 data update gives 102 metres for 2025, against 100 metres in this count.
The Statue of Liberty line in the graphic is a useful ruler. The average hub only rises above it in the 2020s, but blade tips have cleared it since the late 2000s. Of the turbines with a recorded total height, 69,233, or 96%, are taller from ground to blade tip than the statue is from ground to torch. 21,843 land-based turbines reach 150 metres or more.
Tower height also varies by place. The average hub in California, where many turbines are old, stands 71 metres up; in Texas it is 85 metres.
Nacelle: where the megawatts are made
The nacelle is the housing on top of the tower that holds the generator, and the number stamped on it, the nameplate capacity, is what the hexagons on the map add up. In all, the database holds 159.6 gigawatts of nameplate capacity. Berkeley Lab's own count, which uses a different method, is 161 gigawatts of cumulative wind capacity at the end of 2025, after "6.9 GW added in 2025".
Capacity per turbine has grown faster than any dimension. The 1980s machines in the database average 104 kilowatts. The 1990s average was 709 kilowatts, the early 2000s 1.11 megawatts and the late 2000s 1.68 megawatts. Turbines from 2020 to 2024 average 3.03 megawatts, and those from 2025 average 3.80 megawatts: roughly 37 times the 1980s figure, and 242% more than in the early 2000s.
The year-by-year table shows what that means for how wind gets built. The year with the most turbines still standing is 2012, with 6,660. The year with the most capacity is 2020, at 17.0 gigawatts from 6,229 turbines. Fewer machines now carry more power: 2025's 3,094 turbines add up to 6.1 gigawatts, nearly half of 2012's 13.0 gigawatts from about half as many turbines.
| Year online | Turbines | Capacity added | MW per turbine | Rotor | Rotor vs year before |
|---|---|---|---|---|---|
| 2000 | 28 | 0.85 | 49 m | ||
| 2001 | 1,701 | 0.91 | 55 m | 6 | |
| 2002 | 457 | 0.88 | 52 m | ▼ 3 | |
| 2003 | 915 | 1.62 | 79 m | 27 | |
| 2004 | 87 | 1.16 | 62 m | ▼ 17 | |
| 2005 | 1,169 | 1.51 | 81 m | 19 | |
| 2006 | 974 | 1.58 | 79 m | ▼ 2 | |
| 2007 | 2,916 | 1.66 | 82 m | 3 | |
| 2008 | 4,636 | 1.67 | 84 m | 2 | |
| 2009 | 5,697 | 1.74 | 84 m | 0 | |
| 2010 | 2,961 | 1.77 | 86 m | 2 | |
| 2011 | 3,494 | 1.98 | 93 m | 7 | |
| 2012 | 6,660 | 1.96 | 96 m | 3 | |
| 2013 | 579 | 1.85 | 96 m | 1 | |
| 2014 | 2,396 | 1.92 | 99 m | 3 | |
| 2015 | 4,304 | 2.00 | 102 m | 3 | |
| 2016 | 3,809 | 2.15 | 108 m | 6 | |
| 2017 | 4,348 | 2.11 | 106 m | ▼ 2 | |
| 2018 | 3,108 | 2.44 | 116 m | 10 | |
| 2019 | 3,583 | 2.55 | 121 m | 5 | |
| 2020 | 6,229 | 2.76 | 125 m | 4 | |
| 2021 | 4,491 | 3.01 | 128 m | 3 | |
| 2022 | 2,667 | 3.25 | 132 m | 4 | |
| 2023 | 1,992 | 3.34 | 133 m | 1 | |
| 2024 | 1,210 | 3.50 | 137 m | 4 | |
| 2025 | 3,094 | 3.80 | 141 m | 4 |
Land-based turbines still standing, by project year. Rotor change is in metres. Because older turbines that have been torn down or repowered are no longer in the database, early years undercount what was built then.
The bars also show how uneven the building has been. Only 579 turbines standing today came online in 2013, after 6,660 in 2012, and 2024 produced 1,210 turbines and 4.0 gigawatts. The 2025 figure in this database, 6.1 gigawatts, sits below Berkeley Lab's 6.9 gigawatts because new turbines reach the database about a quarter after they are installed. The project page notes that releases "generally lag installations by one quarter". Another 751 turbines are already listed for 2026.
Most of these nacelles come from a few manufacturers. GE Wind is listed on 35,326 turbines, 45% of the total, and Vestas on 18,247.
Hub: Texas, and the plains that turn around it
On a turbine, the hub is the centre that everything spins around. In American wind, that centre is Texas.
Texas has 19,943 turbines, 26% of the national count, and 43.9 gigawatts of capacity: 28% of the US total, and 3.2 times as much as Iowa, which is second with 13.7 gigawatts. On the map, Texas hexagons cover the state from the Panhandle down through west-central Texas and on to the Gulf Coast in the far south of the state.
| # | State | Capacity | Share of US | Turbines | Avg hub height | Oldest–newest |
|---|---|---|---|---|---|---|
| 1 | Texas | 27.5% | 19,943 | 85 m | 1999–2026 | |
| 2 | Iowa | 8.6% | 6,514 | 83 m | 1992–2026 | |
| 3 | Oklahoma | 8.1% | 5,849 | 85 m | 1983–2026 | |
| 4 | Kansas | 6.1% | 4,415 | 87 m | 2001–2025 | |
| 5 | Illinois | 5.3% | 3,951 | 89 m | 2004–2025 | |
| 6 | California | 3.8% | 4,947 | 71 m | 1982–2026 | |
| 7 | Colorado | 3.4% | 3,320 | 81 m | 2001–2026 | |
| 8 | North Dakota | 3.1% | 2,334 | 83 m | 2002–2025 | |
| 9 | Minnesota | 3.0% | 2,726 | 79 m | 1997–2023 | |
| 10 | Wyoming | 2.9% | 1,698 | 84 m | 2003–2025 | |
| 11 | New Mexico | 2.7% | 2,866 | 84 m | 2003–2026 | |
| 12 | Oregon | 2.7% | 2,187 | 77 m | 1998–2025 | |
| 13 | Michigan | 2.3% | 1,713 | 92 m | 2008–2023 | |
| 14 | Indiana | 2.3% | 1,762 | 88 m | 2008–2025 | |
| 15 | South Dakota | 2.3% | 1,502 | 86 m | 2001–2023 |
Nameplate capacity of turbines standing in each state at the database's V9.1 release (September 2026), including offshore turbines assigned to a state. Turbines with no recorded capacity are left out of the sums.
The rest of the list reads like a map of the Great Plains and the Corn Belt. After Texas and Iowa come Oklahoma (12.9 GW), Kansas (9.7 GW) and Illinois (8.5 GW). Those five states hold 56% of the country's installed capacity. Add the rest of the plains and the mountain front (Nebraska, the Dakotas, Minnesota, Colorado, Wyoming, Montana and New Mexico) and the share reaches 71%.
That ranking matches what the turbines produce. The Energy Information Administration lists the five states with the most wind generation in 2025 as Texas, Iowa, Oklahoma, Kansas and Illinois, the same five, and says they made "about 52% of total U.S. wind electricity generation".
The dark green hexagons, those holding more than 500 megawatts each, are mostly in Texas, which has more of them than any other state, followed by Iowa, Oklahoma, Illinois and Kansas. A few more are scattered from Washington and California to Michigan and Indiana. The largest single project in the database by capacity is Western Spirit in New Mexico, with 377 turbines and 1.1 gigawatts.
The empty parts of the map are just as clear. Alabama, Florida, Georgia, Louisiana and South Carolina have no turbines in the database at all, and the Southeast as a whole is close to blank until Mississippi's single project in the Delta.
California is the exception that shows the history. It ranks 6th by capacity, with 6.0 gigawatts, but 4th by number of turbines, with 4,947, because so many of them are small and old: 35% of California's turbines came online before 1990. That is the trace of the first American wind boom. EIA's history of wind records that "the United States possessed 95 percent of the world's installed wind capacity in the early 1980's", and that California studies had picked out the Altamont, Tehachapi and San Gorgonio passes as the best sites.
Blades: the part that grew most
If one component explains the change in the bottom row of the graphic, it is the blade.
The average rotor from the 1980s is 17 metres across. In the 1990s it was 48 metres; the early 2000s, 62; the late 2000s, 83; the early 2010s, 94; the late 2010s, 110; 2020 to 2024, 129; and in 2025, 142 metres. That is 8 times wider than the 1980s rotor and 129% wider than in the early 2000s.
Width undersells it, because a rotor harvests wind across the whole circle it sweeps, and that area grows with the square of the diameter. The 2025 rotor's circle covers about 66 times as much sky as the 1980s rotor.
Since the early 2000s, rotors have also grown faster than towers. In 2000–04 the average rotor was slightly narrower than the hub was high. By 2025 it was 142 metres across on a 100-metre tower, so the rotor is now much wider than the tower is tall, and the 2025 turbine's tip reaches about 171 metres when a blade points up. The 1980s machine topped out around 33 metres.
The DOE report found the same growth. It put the average rotor of turbines installed in 2023 at 133.8 metres, up 178% since 1998–99. Berkeley Lab's figure for 2025 is 141 metres. In the year-by-year table the early 2000s bounce around, because few turbines from those years still stand, but since 2010 the average rotor has grown every year except 2017.
That is what made Delta Wind possible. Longer blades catch more energy from slower wind, which helps explain why a project like the one in Tunica County could be built on land that earlier, smaller turbines would have passed over.
The grid connection: from nameplate to power
A turbine is only useful once its cable reaches the grid, and the capacity on the map is a ceiling, not an output. Wind does not blow at full strength all the time, so turbines produce well below their nameplate over a year.
What they did produce in 2025 was substantial. EIA reports that wind turbines were "the source of about 10.5% of total U.S. utility-scale electricity generation" that year, about 464 billion kilowatt-hours. By its count the US made 20% of the world's wind electricity in 2025, second to China's 35%.
The newest connections are at sea. The database lists 129 offshore turbines, the few hexagons in the water off southern New England and Virginia, and their records show where turbine growth is heading. The tallest offshore turbines are at Vineyard Wind, 248 metres to the blade tip, with 13-megawatt nameplates. That is taller than any land-based turbine and more than three times the capacity of the average 2025 land-based turbine.
America's offshore wind took a long time to start and has had a rough few years. Block Island, with "five 6-megawatt wind turbines", was the first, in December 2016; the database lists its 5. South Fork Wind, 12 turbines east of Long Island, opened in March 2024 as the first commercial-scale farm. Vineyard Wind finished installing all 62 turbines in March 2026; the database has 61 so far. Revolution Wind was halted by the federal government in August 2025, when it was about 80% complete, and restarted under a court order. It was halted again in December 2025 and allowed to resume in January 2026, and it finished installing its 65 turbines in September 2026. Only 28 are in this release.
Those gaps are the database's lag again, and they mean the offshore totals are a floor. 39 of the 129 offshore records still have no capacity, so the 1,038 megawatts summed here undercount what is already standing in the water. Even counted in full, it is small beside the plains: 48 Texas counties each hold more turbines than all of America's offshore projects combined.
Look at the graphic once more with all the parts in place. The plains hold the load. Each new machine is taller, has a much wider rotor and carries more power than the one before. The biggest of them now stand in Mississippi farmland and in the Atlantic, two places the 1980s industry never reached, and the next database release will add more of both.
Sources and method
- US Geological Survey, Lawrence Berkeley National Laboratory and American Clean Power: US Wind Turbine Database (USWTDB) API. All 77,839 turbines in release V9.1, retrieved November 4, 2026. Public domain.
- US state boundaries (us-atlas, from the Census Bureau's cartographic files)
- National Park Service: Statue of Liberty statistics
Capacities are each turbine's nameplate rating (t_cap, kW) summed into hexagons about 75 km across on an Albers equal-area map of the contiguous states; turbines in Alaska, Hawaii, Puerto Rico and Guam are counted in totals but not mapped. Turbines with no recorded capacity (mostly 1980s machines) are left out of capacity sums but counted in turbine totals. The year is p_year, the year the project came online, not the year each turbine was built. Average hub height, rotor diameter and capacity per period use land-based turbines with a recorded value; 1980s averages rest on the few hundred machines from that decade with specifications, and 2025 data are still incomplete. The database removes decommissioned turbines when they are spotted in aerial imagery, so totals describe the turbines standing at release, not every turbine ever built.
Charts like this, from your own numbers.
Connect a spreadsheet or the tools you run on, and Parity builds the dashboard and writes the report, with every number checked.
Try Parity free

